Fig. 4
Download original image
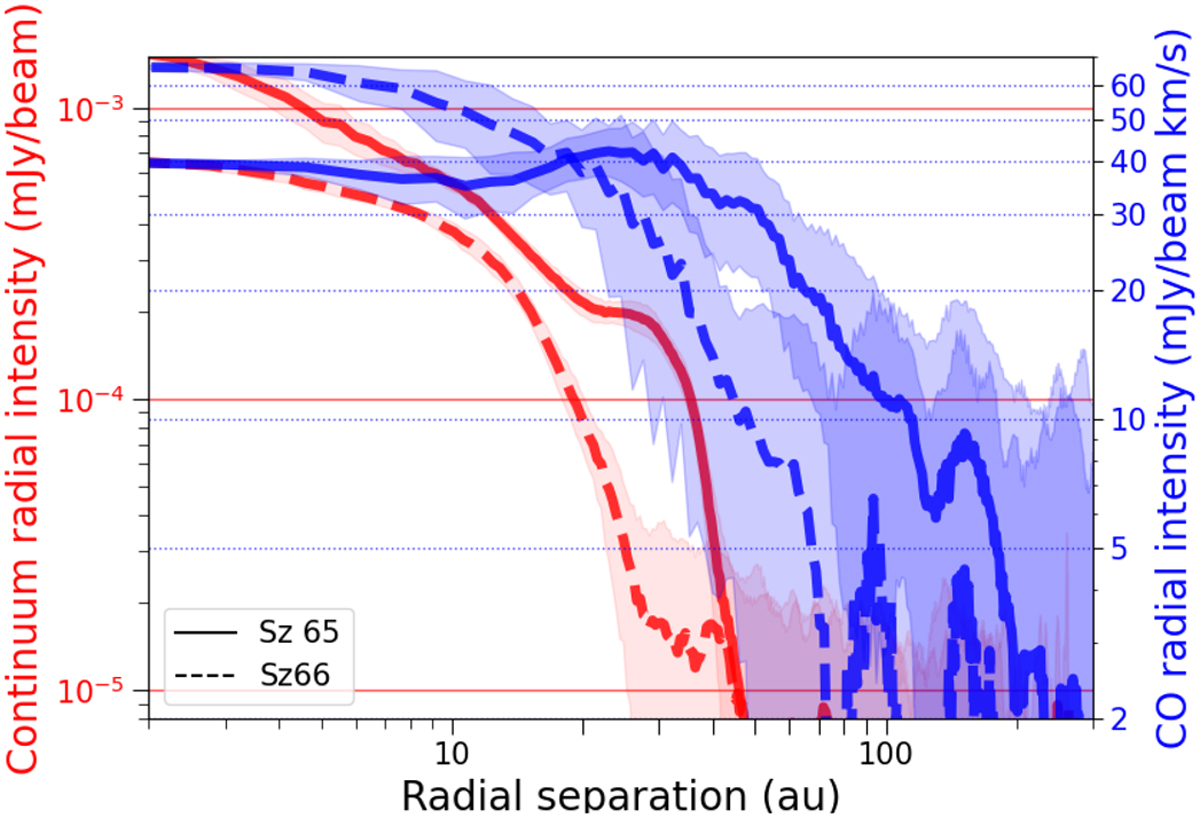
Azimuthally averaged deprojected radial intensity profiles of the dust continuum (red) and CO emission (blue) for Sz 65 (solid line) and Sz 66 (dashed line). The standard deviation in each of the radial bins used for averaging is shown as the shaded area. The beam size for the continuum data corresponds to ~4 au, and the CO data have ~15 au.
Current usage metrics show cumulative count of Article Views (full-text article views including HTML views, PDF and ePub downloads, according to the available data) and Abstracts Views on Vision4Press platform.
Data correspond to usage on the plateform after 2015. The current usage metrics is available 48-96 hours after online publication and is updated daily on week days.
Initial download of the metrics may take a while.