Free Access
Fig. 1
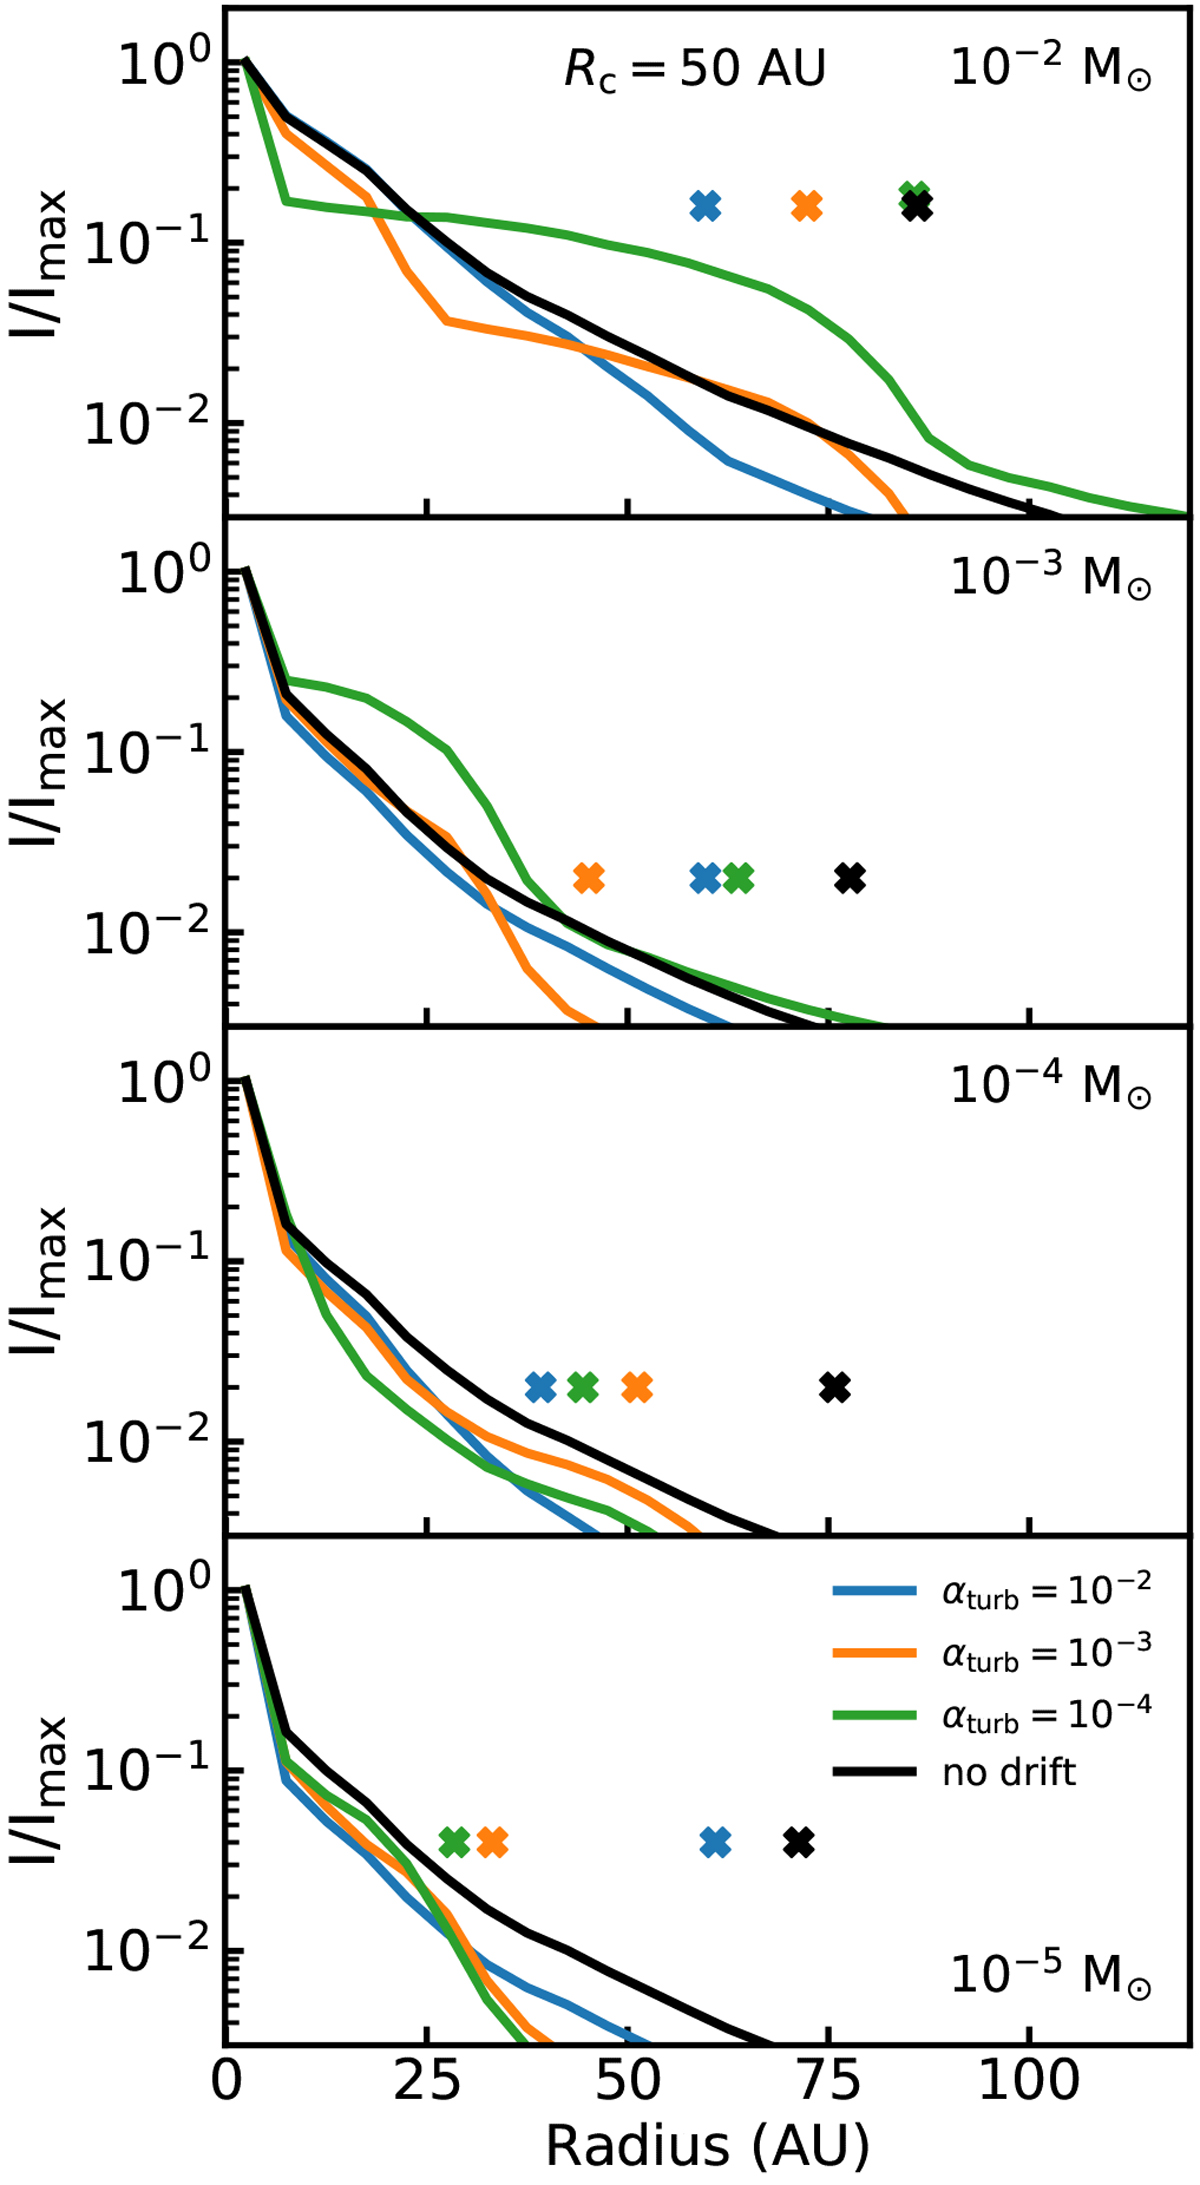
Radial intensity profiles of the 1.3 mm continuum emission, normalised to the peak intensity, for the models with Rc = 50 AU. Crosses at an arbitrary height above the line denote the dust outer radii, defined as the radii enclosing 90% of the total flux. The resulting cumulative intensity curves are shown in Fig. E.1.
Current usage metrics show cumulative count of Article Views (full-text article views including HTML views, PDF and ePub downloads, according to the available data) and Abstracts Views on Vision4Press platform.
Data correspond to usage on the plateform after 2015. The current usage metrics is available 48-96 hours after online publication and is updated daily on week days.
Initial download of the metrics may take a while.