| Issue |
A&A
Volume 627, July 2019
|
|
|---|---|---|
| Article Number | A151 | |
| Number of page(s) | 68 | |
| Section | Stellar structure and evolution | |
| DOI | https://doi.org/10.1051/0004-6361/201935684 | |
| Published online | 16 July 2019 | |
The Wolf–Rayet binaries of the nitrogen sequence in the Large Magellanic Cloud
Spectroscopy, orbital analysis, formation, and evolution
1
Institute of Astrophysics, KU Leuven, Celestijnlaan 200D, 3001 Leuven, Belgium
e-mail: This email address is being protected from spambots. You need JavaScript enabled to view it.
2
Leibniz-Institut für Astrophysik Potsdam, An der Sternwarte 16, 14482 Potsdam, Germany
3
Institut für Physik und Astronomie, Universität Potsdam, Karl-Liebknecht-Str. 24/25, 14476 Potsdam, Germany
4
Département de physique and Centre de Recherche en Astrophysique du Québec (CRAQ), Université de Montréal, 6128, Succ. Centre-Ville, H3C 3J7 Montréal, Québec, Canada
5
Armagh Observatory, College Hill, Armagh BT61 9DG, UK
6
Cherenkov Telescope Array Observatory gGmbH, Via Piero Gobetti 93/3, 40126 Bologna, Italy
7
Astronomy and Astrophysics Research Group, Vrije Universiteit Brussel, Pleinlaan 2, 1050 Brussels, Belgium
8
The Observatories of the Carnegie Institution for Science, 813 Santa Barbara St., Pasadena, CA 91101, USA
Received:
12
April
2019
Accepted:
10
May
2019
Abstract
Context. Massive Wolf–Rayet (WR) stars dominate the radiative and mechanical energy budget of galaxies and probe a critical phase in the evolution of massive stars prior to core collapse. It is not known whether core He-burning WR stars (classical WR; cWR) form predominantly through wind stripping (w-WR) or binary stripping (b-WR). Whereas spectroscopy of WR binaries has so-far largely been avoided because of its complexity, our study focuses on the 44 WR binaries and binary candidates of the Large Magellanic Cloud (LMC; metallicity Z ≈ 0.5 Z⊙), which were identified on the basis of radial velocity variations, composite spectra, or high X-ray luminosities.
Aims. Relying on a diverse spectroscopic database, we aim to derive the physical and orbital parameters of our targets, confronting evolution models of evolved massive stars at subsolar metallicity and constraining the impact of binary interaction in forming these stars.
Methods. Spectroscopy was performed using the Potsdam Wolf–Rayet (PoWR) code and cross-correlation techniques. Disentanglement was performed using the code Spectangular or the shift-and-add algorithm. Evolutionary status was interpreted using the Binary Population and Spectral Synthesis (BPASS) code, exploring binary interaction and chemically homogeneous evolution.
Results. Among our sample, 28/44 objects show composite spectra and are analyzed as such. An additional five targets show periodically moving WR primaries but no detected companions (SB1); two (BAT99 99 and 112) are potential WR + compact-object candidates owing to their high X-ray luminosities. We cannot confirm the binary nature of the remaining 11 candidates. About two-thirds of the WN components in binaries are identified as cWR, and one-third as hydrogen-burning WR stars. We establish metallicity-dependent mass-loss recipes, which broadly agree with those recently derived for single WN stars, and in which so-called WN3/O3 stars are clear outliers. We estimate that 45 ± 30% of the cWR stars in our sample have interacted with a companion via mass transfer. However, only ≈12 ± 7% of the cWR stars in our sample naively appear to have formed purely owing to stripping via a companion (12% b-WR). Assuming that apparently single WR stars truly formed as single stars, this comprises ≈4% of the whole LMC WN population, which is about ten times less than expected. No obvious differences in the properties of single and binary WN stars, whose luminosities extend down to log L ≈ 5.2 [L⊙], are apparent. With the exception of a few systems (BAT99 19, 49, and 103), the equatorial rotational velocities of the OB-type companions are moderate (veq ≲ 250 km s−1) and challenge standard formalisms of angular-momentum accretion. For most objects, chemically homogeneous evolution can be rejected for the secondary, but not for the WR progenitor.
Conclusions. No obvious dichotomy in the locations of apparently single and binary WN stars on the Hertzsprung-Russell diagram is apparent. According to commonly used stellar evolution models (BPASS, Geneva), most apparently single WN stars could not have formed as single stars, implying that they were stripped by an undetected companion. Otherwise, it must follow that pre-WR mass-loss/mixing (e.g., during the red supergiant phase) are strongly underestimated in standard stellar evolution models.
Key words: stars: massive / stars: Wolf–Rayet / Magellanic Clouds / binaries: close / binaries: spectroscopic / stars: evolution
© ESO 2019
1. Introduction
Through their stellar winds, intense radiation, and supernova (SN) explosions, massive stars (Mi ≳ 8 M⊙) dominate the energy budget of their host galaxies. Among these stars, massive Wolf–Rayet (WR) stars define a spectral class of stars with emission-dominated spectra that are physically characterized by strong, radiatively driven winds (see Crowther 2007, for a review). They are subdivided in three main flavors: the nitrogen sequence (WN), the carbon sequence (WC), or the very rare oxygen sequence (WO), depending on whether their atmospheres are N-rich (CNO cycle products) or C/O-rich (He-burning products). Most known WR stars are classical WR stars1 (cWR), defined as evolved, core He-burning (or rarely C-burning) WR stars. However, very massive stars can already appear as WR stars on the main sequence (de Koter et al. 1997). As immediate progenitors of black holes (BHs) and neutron stars, the attributes of WR stars largely determine observed properties of SN explosions and gravitational-wave (GW) detections arising from the merging of compact objects. Studying WR stars is hence essential for understanding the evolution of massive stars (e.g., Hamann et al. 2006; Tramper et al. 2015; Shenar et al. 2016; Sander et al. 2019), the energy budget of galaxies (e.g., Doran et al. 2013; Ramachandran et al. 2018), the upper-mass limit of stars (e.g., Bestenlehner et al. 2011; Shenar et al. 2017; Tehrani et al. 2019), and the properties of compact objects and SNe (e.g., Woosley et al. 2002; Langer 2012; de Mink et al. 2014; Marchant et al. 2016; Hainich et al. 2018). Despite this, their formation, especially in the context of binary interaction, is still considered poorly understood.
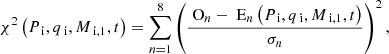
We discern among four distinct formation channels for WR stars. These formation channels are illustrated in a Hertzsprung-Russell diagram (HRD) in Fig. 1 using evolution tracks calculated with the BPASS2 (Binary Population and Spectral Synthesis) code V2.0 (Eldridge et al. 2008; Eldridge & Stanway 2016), and are defined as follows:
-
Main-sequence WR stars (ms-WR; “born this way”) are core H-burning WR stars. They typically exhibit WN spectra already on the main sequence by virtue of their very large masses (≳60 M⊙ at solar metallicity) and correspondingly strong winds (de Koter et al. 1997; Crowther & Walborn 2011). Spectroscopically, they are associated with weaker wind “slash WR stars” (/WN), hydrogen-rich WN stars (WNh), and luminous blue variables (LBVs). Examples include WR 24 in the Galaxy (WN6h), the two components of BAT99 119 (WN6h + O3.5 If/WN7) in the Large Magellanic Cloud (LMC), and probably the two components of HD 5980 (WN6h + WN6-7h) in the Small Magellanic Cloud (SMC).
-
Wind-stripped WR stars (w-WR) are cWR stars that formed through intrinsic mass loss, i.e., stellar winds or eruptions (Conti 1976; Smith 2014). Only stars that are sufficiently massive can become w-WR stars. The minimum initial mass Mi,w-WR is a strong function of the metallicity Z. It is estimated to be ≈20−30 M⊙ at solar metallicity, ≈30−60 M⊙ at LMC metallicity (≈1/3 Z⊙), and 45−100 M⊙ at SMC metallicity (≈1/5 Z⊙) (Crowther & Hadfield 2006; Maeder 2002; Hainich et al. 2015), keeping in mind that these values are strongly dependent on the mass loss and mixing prescriptions in evolution models. Examples include WR 6 in the Galaxy (WN4b) or BAT99 7 in the LMC (WN4b).
-
Wind+binary-stripped WR (wb-WR) stars are cWR stars that were originally massive enough to become WR stars as single stars (i.e., Mi ≥ Mi,w-WR), but were further stripped by a companion, either via Roche lobe overflow (RLOF) or via common-envelope evolution (CEE, Paczynski 1973; Vanbeveren et al. 1998a). The WR primary of the Galactic binary WR 139 (V444 Cyg, WN5 + O6) likely started its life with Mi ≳ 30 M⊙ and was partly stripped by the secondary star (Vanbeveren et al. 1998b), making it a good candidate for a wb-WR star. Other examples include most confirmed WR binaries in the SMC (Shenar et al. 2016).
-
Binary-stripped WR stars (b-WR) are cWR stars that could only form as a result of binary interaction. That is, a b-WR star would not become a WR star without a companion. The b-WR channel extends the minimum initial mass of WR stars to lower values, bounded from below by the initial mass Mi,WR at which the stripped product no longer exhibits a WR spectrum (see Fig. 1 and Sect. 6.1.3). Only few candidates for b-WR exist. The peculiar primary of the system HD 45166 (WN7 + B7 V or qWR + B7 V), which was reported as a short period (≈1.6 d) 4.2 M⊙ + 4.8 M⊙ WR binary seen at a very low inclination of 0.77°, is probably the best-known candidate for a b-WR star (Steiner & Oliveira 2005; Groh et al. 2008).
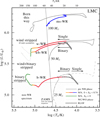 |
Fig. 1. Illustration of the ms-WR, w-WR, wb-WR, and w-WR formation channels of WR stars. Shown are evolution tracks calculated at a metallicity Z = 0.008 (≈ZLMC) with the BPASS code for single stars with initial masses Mi = 100, 50, and 25 M⊙ (upper, middle, and dashed lower tracks, respectively). Also plotted are BPASS binary evolution tracks with Mi = 50 M⊙, Pi = 25 d, qi = 0.7 (upper), and Mi = 25 M⊙, Pi = 25 d, qi = 0.7 (lower). The colors correspond to surface hydrogen mass fractions (blue: 0.4 < XH < 0.74, red: 0.2 < XH < 0.4, orange: 0.05 < XH < 0.2, green: XH < 0.05). Empirically, stars found in the dashed region are not expected to show a WR spectrum (see Sect. 6.1.3). |
By construction, each WN star belongs uniquely to one of these categories. We note that w-WR, wb-WR, and b-WR stars are all cWR stars. Spectroscopically, classical WN stars would tend to early types (WNE; WN2–5), while ms-WR stars to late types (WNL, WN6–11), but this does not hold strictly (e.g., in the Galaxy: WR 123 – a hydrogen-free WN8 star; WR 3 – a hydrogen-rich WN3 star; Hamann et al. 2006). The WC/WO stars, which will be the subject of future studies, are always H-free and are therefore always cWR stars. While the spectroscopic classification of WR stars is fairly unambiguous, it is not straightforward to identify their evolutionary channel.
One of the central problems in this context is to correctly estimate the frequency of binary stripped (b-WR) stars among a population of WR stars as a function of Z. It is now widely accepted that the majority of massive stars interacts with a companion star during their lifetime (Sana et al. 2012). Among the Galactic WR stars about 40% are observed to be binaries (van der Hucht 2001); this is comparable to the binary fraction recently reported for the M 31 and M 33 galaxies (Neugent & Massey 2014). Considering the rapid power-law increase of the initial mass function (IMF) toward lower initial masses, the longer lifetimes of lower mass stars, and the high frequency of interacting binaries, b-WR stars should be abundant in our Universe, which may significantly affect the energy budget of galaxies (Götberg et al. 2017). However, to date, only a few WR stars are considered good candidates for b-WR stars (Groh et al. 2008; Richardson et al. 2011).
It is by now empirically (Nugis et al. 2007; Mokiem et al. 2007; Hainich et al. 2015) and theoretically (Kudritzki et al. 1987; Vink et al. 2001) established that the intrinsic mass-loss rates of massive stars decreases with decreasing surface metallicity, Ṁ ∝ Zα, with 0.5 ≲ α ≲ 1. This immediately implies that it is harder for stars at lower metallicity to peel off their outer layers intrinsically and become w-WR stars. In other words, the intrinsic formation channel becomes increasingly inefficient with decreasing metallicity. In contrast, no evidence exists that the efficiency of binary-stripping strongly depends on metallicity (e.g., Sana et al. 2013; Neugent & Massey 2014)3. One may therefore expect that the fraction of b-WR stars in a population of WR stars should grow with decreasing metallicity.
Motivated by such predictions, Bartzakos et al. (2001), Foellmi et al. (2003a), Foellmi et al. (2003b; FMG03 hereafter), and Schnurr et al. (2008; S08 hereafter) conducted a large spectroscopic survey in the SMC and LMC with the goal of measuring the binary fraction in their WR populations and deriving the binary orbits (sensitive to periods up to ≈200 d). The LMC and SMC are both known to have a subsolar metallicity of a factor ∼1/3 and ∼1/5 solar, respectively (Dufour et al. 1982; Larsen et al. 2000). Following the reasoning of the previous paragraph, it is expected that the fraction of WR stars formed via the binary channel is relatively large in the LMC and even larger in the SMC. It was therefore surprising that FMG03 and S08 measured a WN binary fraction of ≈40% in the SMC and ≈30% in the LMC, comparable to the Galactic fraction.
In Shenar et al. (2016, 2018), we performed spectroscopic analyses of the five confirmed WR binaries in the SMC; the seven remaining apparently single WR stars were analyzed by Hainich et al. (2015). The results only worsened the problem. Although indications for past mass transfer were found in the binaries, all WR stars were found to have very large initial masses of Mi ≳ 60 M⊙. While their evolution depends on the detailed treatment of rotation and the mass-loss prescription, within the uncertainties, such stars may already reach the WR phase intrinsically even at SMC metallicity (see details in Shenar et al. 2016). Using the terminology introduced above, all WR binary components in the SMC were found to be wb-WR stars, while no b-WR stars could be identified. Thus, binary interaction does not seem to be responsible for the number of observed WR stars in the SMC.
In this study, we extend our analysis to the LMC, for which we adopt a distance of d = 49.97 kpc (Pietrzyński et al. 2013). Owing to both its higher metallicity and larger size, the sample of binary candidates amounts to 44, virtually increasing the SMC sample tenfold. The goal of this study is threefold. First, through quantitative spectroscopy, we wish to supply physical parameters for the LMC WN binaries. Second, we wish to exploit existing orbital solutions and, if possible, derive improved solutions through radial-velocity (RV) measurements. This method is indispensable for weighing WR stars, whose surfaces are concealed by their thick winds, rendering a spectroscopic measurement of their mass via measurement of their surface gravity impossible. Thirdly, being no longer limited by low-number statistics, we aim to estimate the impact of binary interaction in forming WR stars at subsolar metallicity.
The paper is organized as follows: In Sects. 2 and 3, we briefly describe the selection of our targets and the observational data used in our study. In Sect. 4, we present the methods and assumptions for our spectroscopic and orbital analyses, while Sect. 5 contains our results. We discuss our results in Sect. 6 and summarize our findings in Sect. 7. In Appendix A, we provide a detailed discussion for each of our targets, in Appendix B we present the spectral fits for the whole sample, and in Appendix C we give a log of the observational data used and measured RVs.
2. The sample
The LMC hosts 154 known WR stars (Massey et al. 2014; Neugent et al. 2018), 82% of which belong to the nitrogen sequence (WN). The WC/WO stars in the LMC, which comprise about 18% of the total WR content with only a few confirmed binaries, will be the subject of future studies. The 109 WN stars listed in the fourth catalog of LMC WN stars Breysacher et al. (1999; BAT99 hereafter) were previously analyzed as single stars by Hainich et al. (2014; H14 thereafter). Among these stars, H14 delineated 43 that are either known binary systems or binary candidates. These objects constitute our sample. Two additional objects, BAT99 17 and 60, are included in this work based on the presence of absorption features in their spectra, which are indicative of the presence of a companion. Similar to BAT99 116 and 119, which were analyzed in separate studies (Shenar et al. 2017; Tehrani et al. 2019), the very luminous ms-WR + ms-WR system BAT99 118 requires a more in-depth analysis and is therefore delayed to future studies. Two additional WN binaries discovered by Neugent et al. (2017), LMC 143-1 and LMC 173-1, are not included owing to lack of data. Altogether, our final sample comprises 44 WN binaries and binary candidates.
The binary nature of 22 objects in our sample was established in previous studies via periodic RV variation, and seven additional targets are considered binary candidates on the basis of RV variations (σRV > σerr) for which no period could be found (FMG03, S08). A few additional candidates are included because of the presence of spectral features that are strongly indicative of a companion (e.g., BAT99 17 and 60). The authors of H14 identified further binary candidates based on their X-ray properties. Single WN stars are generally known to exhibit faint X-ray luminosities (Ignace et al. 2000; Skinner et al. 2012; Oskinova et al. 2012) not exceeding ≈1032 erg s−1. In contrast, wind-wind collisions (WWC) in WR binaries can yield X-ray luminosities that are a few orders of magnitude larger, ≈1033−1034 erg s−1 (Moffat 1998). Even more X-ray luminous are the rarely observed WR binaries with accreting compact objects (e.g., Cyg X-3; Lommen et al. 2005). Every WN star that was detected in X-rays in surveys by Guerrero & Chu (2008a,b) and correspondingly exhibits X-ray luminosities of at least ≈1033 erg s−1 is considered here to be a binary candidate. We note, however, that the presence of X-rays does not necessarily imply binarity, and vice versa. For example, long-period binaries may only emit faint WWC X-ray emission, while single ms-WR stars may emit significant X-rays intrinsically (e.g., Pollock 1995; Huenemoerder et al. 2015).
Figure 2 shows the positions of the 109 known WN stars of the BAT99 catalog on an image of the LMC, also delineating the binary candidates. In Table 1, we list all LMC WN binary candidates. We also give their aliases, spectral types, Smith v-band magnitudes, where the classification procedure is described in Sect. 5.1.1. The status of various binary-candidate criteria is given for each of the targets: X-ray luminosities, composite spectra, eclipses, and RV variations. Finally, we give the suggested configuration for each system based on our study and previous studies. In this work, SB2 refers to systems in which two components are seen in the spectrum and move periodically in anti-phase, while SB1 refers to systems in which only one component (in this case always the WR star) is moving periodically. Per definition, each target in our sample is positive on at least one of these criteria. Bold entries correspond to objects that are confirmed as binaries in our study.
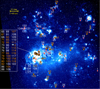 |
Fig. 2. Hα image of the LMC (Smith et al. 2005). The locations of all putatively single (red circles) and binary-candidate (yellow stars and labels) WN stars in the LMC BAT99 catalog are denoted. The WN binaries constitute our sample. |
Overview of our sample: the LMC WN binaries and binary candidates.
It is important to stress that the non-confirmed candidates, as well as other apparently-single WN stars, may still be binaries that were not observed as such because of, for example, low-mass companions, long periods, or inclination effects. Detection biases are discussed in length in FMG03 and S2008. Loosely speaking, the binary sample is estimated to be ≈70% complete to binaries with periods P ≲ 200 d and secondaries with M2 ≳ 8 M⊙. The true binary fraction for WR binaries with larger periods or lower mass secondaries remains unconstrained.
3. Observations
The spectral analysis of the objects in our sample relies on various observational datasets, as described below. In Sect. C in the appendix, we compile all spectra used for the spectral and orbital analysis.
Previously unpublished data were collected by a member of our team (O. Schnurr) for all short-period (P ≤ 5 d) WNL binaries in the LMC located outside the too crowded R 136 cluster at the center of the giant HII region 30 Doradus: BAT99 12, 32, 77, 92 (in fact a WC binary erroneously classified as WN previously; see Sect. A), 95, 103, and 113 (Moffat 1989, S08). These data were obtained during a five-night observing run at Cerro Tololo Inter-American Observatory (CTIO), Chile, from December 14 to 18 2005, using the Ritchey–Chrétien (R–C) Spectrograph attached to the CTIO 4 m telescope. The R–C spectrograph setup used the blue Schmidt camera and the G450 grating (450 l mm−1) setup in second order, to cover a spectral wavelength range from 3700 Å to 5200 Å. With a slit width of 150 μm (corresponding to 1″ on-sky, to match the ambient seeing), a linear dispersion of 0.95 Å per pixel was reached; the three-pixel spectral (velocity) resolving power was thus R ∼ 2400. For each object, the goal was to obtain at least one high-quality spectrum per night with S/N ∼ 200 in the continuum. To achieve this, exposure times ranged from 2250 s to 4500 s. For better cosmic-ray rejection, exposures were split into three subexposures. At the beginning of each night, bias frames and high-S/N internal (quartz lamp) flat-field frames were also taken, and averaged for better statistics. No dark frames were taken. The data were reduced by standard procedure within MIDAS in context “long”. These observations are summarized in Tables C.4–C.10.
For all objects, visual spectra obtained during the campaigns by FMG03 and S08 were used, taken with different telescopes and instruments (see FMG03 and S08). These spectra typically cover ≈4000−6800 Å and have an average resolving power of R ≈ 1000 (for more details, see FMG03 and S08). As in Shenar et al. (2016), we only used spectra that were co-added in the frame of reference of the WR star to enhance the signal to noise to S/N = 100−150, since the original data can no longer be retrieved. Co-adding the spectra in the frame of the WR star may cause the spectral features of the companion to smear when significant RV variations are present. The spectrum of the companion is therefore subject to additional broadening, which scales with the sum of the RV amplitudes K1 + K2. To roughly account for this broadening, we convolved the model of the companion with box profiles with a width of K1 + K2 (see Shenar et al. 2016). In cases in which K1 + K2 is large, the projected rotational velocity and surface gravity of the secondary could be poorly constrained; see Appendix A.
For a large fraction of our sample, UV spectra were retrieved from the Mikulski Archive for Space Telescopes (MAST). In almost all cases, the spectra were obtained using the International Ultraviolet Explorer (IUE), covering the spectral range 1200−2000 Å from the MAST archive. When available, we preferred high resolution spectra binned at intervals of 0.05 Å to achieve an S/N ≈ 20. Otherwise, we used low resolution spectra (FWHM ≈ 6 Å, S/N ≈ 20). Low resolution, flux calibrated IUE spectra in the range 2000−3000 Å were not used for detailed spectroscopy because of their low S/N(≈5−10), but rather to cover the spectral energy distribution (SED) of the targets. We also used optical low resolution spectra taken by Torres-Dodgen & Massey (1988) for the SEDs of our targets. When available, flux calibrated, high resolution Far Ultraviolet Spectroscopic Explorer (FUSE) spectra covering the spectral range 960−1190 Å were also retrieved from the MAST archive and binned at 0.05 Å to achieve an S/N ≈ 30. The IUE and FUSE spectra were normalized with the reddened model continuum.
For a significant number of objects, we retrieved additional spectra taken with the Fibre Large Array Multi Element Spectrograph (FLAMES) mounted on the Very Large Telescope (VLT) Unit Telescope 2 (UT2), Chile. The FLAMES spectra (072.C-0348, Rubio; 182.D-0222, Evans; 090.D-0323, Sana; 092.D-0136, Sana) were secured between 2004 and 2014 with the FLAMES instrument mounted on the VLT partly in the course of two programs: the VLT FLAMES Tarantula Survey (Evans et al. 2011) and the Tarantula Massive Binary Monitoring project. These programs cover the spectral range 3960−4560 Å, and typically have S/N ≳ 100 and R ≈ 7000. The spectra are rectified using an automated routine that fits a piecewise first-order polynomial to the apparent continuum and cleaned from cosmic events using a self-written Python routine.
Two archival spectra of BAT99 6, taken with the Fiber-fed Extended Range Optical spectrograph (FEROS) mounted on the 2.2 m telescope in La Silla on 3 October 2005 and 27 June 2006, were retrieved from the European Southern Observatory (ESO) archives. These spectra have a resolving power of R = 48 000, a S/N ≈ 50, and a spectral coverage of 3900−7000 Å. A single spectrum of BAT99 12, taken with the Ultraviolet and Visual Echelle Spectrograph (UVES) mounted on the VLT on 29 November 2004, was retrieved from the ESO archives. The spectrum has R ≈ 60 000 and S/N ≈ 80.
Photometry for all our objects was extracted from the literature using the Vizier tool4. We obtained UBV, JHK, and IRAC photometry from compilations by Bonanos et al. (2009), Zacharias et al. (2005), Zaritsky et al. (2004), Ulaczyk et al. (2012), Delmotte et al. (2002), Kato et al. (2007), Popescu et al. (2012), Massey et al. (2000), Nascimbeni et al. (2016), Parker (1992), Evans et al. (2011), and Röser et al. (2008). We obtained Wide-field Infrared Survey Explorer photometry from Cutri et al. (2012, 2013). The UBV photometry compiled in Tehrani et al. (2019) was taken for BAT99 116.
4. Analysis
4.1. Spectral analysis
4.1.1. The PoWR code
We performed a spectral analysis of the available spectra for each of the targets listed in Table 1. Unless otherwise stated, the analysis accounts for all known components in the system. The analysis is performed with the Potsdam Wolf–Rayet (PoWR) model atmosphere code, especially suitable for hot stars with expanding atmospheres5. The PoWR model iteratively solves the co-moving frame radiative transfer and the statistical balance equations in spherical symmetry under the constraint of energy conservation without assuming local thermodynamic equilibrium (non-LTE). A more detailed description of the assumptions and methods used in the code is given by Gräfener et al. (2002) and Hamann & Gräfener (2004). By comparing synthetic spectra generated by PoWR to observations, the stellar parameters can be derived.
The inner boundary of the model, referred to as the stellar radius R*, is defined at the Rosseland continuum optical depth τRoss = 20, where LTE can be safely assumed. The value R* is supposed to represent the radius at the hydrostatic layers of the star. In the subsonic region, the velocity field is defined so that a hydrostatic density stratification is approached (Sander et al. 2015). In the supersonic wind region, the prespecified wind velocity field v(r) generally takes the form of a β-law (Castor et al. 1975)
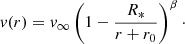 (1)
(1)
In this equation, v∞ is the terminal velocity and r0 ≪ R* is a constant determined so as to achieve a smooth transition between the subsonic and supersonic regions. For OB-type stars, we adopt the usual value of β = 0.8 (e.g., Kudritzki et al. 1989). The value of β for WR stars is heavily debated. Values on the order of unity are reported for some (e.g., Chené et al. 2008; Gräfener & Hamann 2008), while values in the excess of four are reported for others (e.g., Lépine & Moffat 1999; Dessart & Owocki 2005). In fact, hydrodynamically consistent models suggest that the β-law may be too simplistic in the case of WR stars (Gräfener & Hamann 2005; Sander et al. 2017). To avoid an excess of free parameters, we follow the convention of β = 1 (see Appendix A). This has the advantage of direct comparability with the majority of other studies (e.g., Crowther & Smith 1997, H14). An underestimation of β, especially for winds that are very optically thick, generally results in an underestimation of T* and v∞, both of which are not expected to alter our main conclusions.
Besides the velocity law and chemical composition, four fundamental input parameters are needed to define a model atmosphere: the effective temperature T* of the hydrostatic star, its surface gravity g*, the mass-loss rate Ṁ, and the stellar luminosity L. The effective temperature relates to R* and L via the Stefan–Boltzmann law 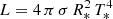 . We stress that, for WR stars, T* may significantly differ from the photospheric effective temperature T2/3, defined relative to R2/3 at τRoss = 2/3. When comparing to evolution tracks, which generally do not account for stellar winds, the parameters T*, g*, and R* rather than T2/3, g2/3, and R2/3 should be used (see, e.g., Groh et al. 2014). Gravity g* relates to radius R* and mass M* via the usual definition
  . For the vast majority of WR models, the value of g* bears no significant effects on the synthetic spectrum, which originates primarily in the wind and is therefore not included in the fitting procedure. The outer boundary is taken to be Rmax = 100 R* for O models and 1000 R* for WR models, which were tested to be sufficiently large.
During the iterative solution, the line opacity and emissivity profiles at each radial layer are Gaussians with a constant Doppler width vDop. This parameter is set to 30 and 100 km s−1 for O and WR models, respectively. In the formal integration, the Doppler velocity is decomposed to depth-dependent thermal motion and microturbulence ξ(r). We assume ξ(r) grows with the wind velocity up to ξ(Rmax)=0.1 v∞, and set ξ(R*)=20 and 100 km s−1 for OB and WR models, respectively (e.g., Hamann et al. 2006; Shenar et al. 2015). We assume a macroturbulent velocity of 30 km s−1 for all O components (e.g., Markova & Puls 2008; Simón-Díaz et al. 2010; Bouret et al. 2012), accounted for by convolving the profiles with radial-tangential profiles (e.g., Gray 1975). Rotational broadening is typically accounted for via convolution with rotation profiles (see Sect. 4.1.2). The synthetic spectra are further convolved with Gaussians that mimic the instrumental profiles.
There is a consensus that winds of hot massive stars are not smooth, but rather clumped (Moffat et al. 1988; Lépine & Moffat 1999; Prinja & Massa 2010; Šurlan et al. 2013). An approximate treatment of optically thin clumps using the so-called microclumping approach was introduced by Hillier (1984) and systematically implemented by Hamann & Koesterke (1998), where the population numbers of the atomic levels are calculated in clumps that are a factor of D denser than the equivalent smooth wind (D = 1/f, where f is the filling factor). Unless otherwise stated in the individual comments (Appendix A), we fix D to 10 for both WR and O-type stars: this value generally agrees well with the observations and is consistent with previous studies (Shenar et al. 2015; Hainich et al. 2015). To first order, the mass-loss rates can be scaled as Ṁ ∝ D−1/2 if other clumping parameters are found to be more adequate in the future. To avoid further free parameters that cannot be constrained with our dataset, optically thick clumps, or macroclumping (Oskinova et al. 2007; Sundqvist et al. 2011; Šurlan et al. 2013), is not accounted for in this work and may result in an underestimation of mass-loss rates by up to a factor of ≈2.
Because optical WR spectra are dominated by recombination lines, it is customary to parametrize their atmospheric models using the so-called transformed radius (Schmutz et al. 1989),
![Mathematical equation: $$ \begin{aligned} R_\text{ t} = R_* \left[ \frac{v_\infty }{2500\,\mathrm{km}\,\mathrm{s}^{-1}\,} / \frac{\dot{M} \sqrt{D}}{10^{-4}\,M_\odot \,\mathrm{yr}^{-1}} \right]^{2/3}, \end{aligned} $$](/articles/aa/full_html/2019/07/aa35684-19/aa35684-19-eq5.gif) (2)
(2)
defined such that equivalent widths of recombination lines of models with given Rt and T* are approximately preserved, independently of L, Ṁ, D, and v∞. Rt is thus a proxy for the mass-loss rate, normalized to the surface area of the star.
X-rays can alter the ionization structure in the wind via Auger ionization. We account for X-rays in a few targets in which we found evidence for this effect (e.g., the presence of the N V resonance line in the UV for late-type OB stars). X-rays are accounted for by assuming a spherical distribution of an optically thin plasma (Baum et al. 1992). The onset radius was always fixed to 1.1 R*, and the X-ray temperature and filling factor are chosen so that a luminosity comparable to that observed is obtained.
Our models include complex model atoms for H, He, C, N, O, Mg, Si, P, S, and the iron group elements (dominated by Fe). In this study, we fit the hydrogen and nitrogen mass fractions XH, XN (from which XHe follows) for WN stars; the remaining abundances are kept fixed (with a few exceptions; see Appendix A). For OB-type stars, all abundances are kept fixed to base LMC values unless stated otherwise in Appendix A. Following H14, the base values for C, N, O, Mg, Si, and Fe and are adopted from studies for by Korn et al. (2005), Hunter et al. (2007), and Trundle et al. (2007), and the remainder are fixed by a scaling of 1/2 solar, resulting in XH = 0.74, XC = 4.75 × 10⁻⁴, XN = 7.83 × 10⁻⁵, XO = 2.64 × 10⁻³, XMg = 2.06 × 10⁻⁴, XSi = 3.21 × 10⁻⁴, XP = 2.91 × 10⁻⁶, XS = 1.55 × 10⁻⁴, and XFe = 7.02 × 10⁻⁴. For WN-type stars, the CNO abundances are fixed by assuming a CNO-cycle equilibrium, in which most of the carbon and oxygen were converted to nitrogen, i.e., XN = 4 × 10⁻³, XC = 7 × 10⁻⁵ (see detailed discussion in H14). Oxygen is usually not included in the calculation of WN models because no corresponding lines are observed in spectra of WN stars.
4.1.2. Spectroscopy of single stars
For single stars, T* is derived from the ionization balance (primarily He lines for OB-type stars and N lines for WN stars). The surface gravity log g*, which usually cannot be derived for WR stars, is inferred from the strength and shape of pressure broadened lines, primarily belonging to the hydrogen Balmer series. The wind parameters Ṁ and v∞ are derived from the strength and widths (respectively) of resonance and recombination wind lines in the spectra. Abundances are derived from the overall strength of the corresponding spectral lines. For OB-type stars, v sin i is derived by convolving the synthetic spectra with rotational profiles and fitting these to the observations. In cases in which the WR star exhibits lines that form relatively close to the hydrostatic core, its v sin i can also be constrained. For this, we utilize a 3D integration routine in the formal integration that assumes corotation up to τRoss = 2/3 and angular momentum conservation beyond (see Shenar et al. 2014).
The luminosity L and reddening EB − V are derived by fitting the SED of the model spectra to observed photometry or flux-calibrated spectra. For the reddening, we assume two contributions. The first follows a Seaton reddening law (Seaton 1979) with RV = 3.1 and a constant  mag, mimicking the Galactic absorption in the direction of the LMC. The second contribution follows reddening laws published for the LMC by Howarth (1983) with a fixed RV = 3.1, where
  is fit individually for each target. In the results, we give the total extinction
  .
.
4.1.3. Binary spectral analysis
The PoWR code is a tool designed for the analysis of single stars. However, in this work, we need to cope with the analysis of composite spectra originating in binary or multiple systems. In some cases, given sufficient data, the spectroscopy of binaries can be reduced to the analysis of single stars. The analysis procedure of binaries using PoWR was thoroughly described in Shenar et al. (2016). In this section, we only repeat the essentials.
The first challenge of binary analysis is that the number of free parameters is essentially multiplied by the number of components. This problem can be overcome if the components can be unambiguously identified in the spectrum. For some of our targets, we could not identify any signature from a binary companion (see “composite” column in Table 1). There are various reasons for this: the companion cannot be seen at the S/N level of the data, the companion is a compact object, or a companion is not present at all. For such targets, the parameters derived are expected to be similar to those obtained by H14 in their single-star analyses, and they were therefore not reanalyzed in this work.
Ideally, it would be best to possess a time series of the spectra with good phase coverage. In this case, it is possible to disentangle the composite spectrum into its constituent spectra (see Sect. 4.3), significantly simplifying the analysis procedure. This was only possible for five systems, i.e., BAT99 19, 32, 77, 103, and 113 (Sect. 4.3). In cases where only co-added spectra were available, or when phase-resolved spectra did not yield plausible disentangled spectra (e.g., BAT99 95), the spectra were analyzed by adding up model spectra that represent the components of the system.
Another challenge is introduced by the unknown light ratio of the stars, for example, in the visual band. A dedicated photometric analysis is only possible for a few targets and will be the focus of future studies. However, the light ratio can also be estimated spectroscopically. Specific spectral features that do not change significantly in the relevant parameter domain can help to assess the true light ratio of the system (see Sect. 4.3 in Shenar et al. 2016). Another method to constrain the light ratios is by comparing the observed equivalent widths of specific spectral features with those expected for the spectral type of the star. The applicability of these methods for each target is discussed in Appendix A.
Once the two components are unambiguously identified in the spectrum and their relative light contribution is constrained, the analysis of the multiple system in principle reduces to the analysis of single stars. The individual model spectra calculated for the components of the system are added together to reproduce the observed SED and normalized spectra.
For an efficient analysis procedure and a reliable error estimate, we utilized dense grids calculated for WN stars (Todt et al. 2015) and OB-type (Hainich et al. 2019) stars at LMC metallicity, which are available on the PoWR homepage5. The grids are 2D and span the T* − Rt plane for WR stars and the T* − log g plane for OB-type stars. This enables us to obtain a first good guess for the parameters of the system and an impression of the errors (see error discussion in Sect. 5.1.2). However, in all cases, tailored models were calculated to improve the quality of the fit and to better constrain the errors. An example for a spectral fit of the binary BAT99 6 is shown in Fig. 3.
 |
Fig. 3. Spectral analysis of the system BAT99 6. The observed photometry and spectra (archival IUE, FEROS) of BAT99 6 are shown in blue. The composite synthetic spectrum (red dotted line) is the sum of the WR (black solid line) and O (green dashed line) models. The relative offsets of the model continua correspond to the light ratio between the two stars. |
The PoWR models are limited to spherical symmetry, which may break in the case of binaries. Firstly, the stellar surface of components of tight binaries may deviate from spherical-symmetry due to tidal forces or rapid rotation. Such deformations may be important especially for OB-type companions in binaries with periods on the order of a few days, and may result in pole-to-equator temperature and gravity differences on the order of up to a few kK and 0.2 dex, respectively, amounting to an overall error of ≈1 kK in T* and ≈0.1 dex in log g (von Zeipel 1924). Reflection effects may be present in the case of binary components with large temperature differences, but usually amount to errors on the order ΔT* ≈ 100 K, which are much smaller than our reported errors (Wilson 1990; Palate 2014). If both components possess significant stellar winds, WWCs may occur and result in excess emission (e.g., Luehrs 1997; Moffat 1998). While such phenomena may be significant or even dominant in the case of specific lines (e.g., Bartzakos et al. 2001), they typically amount to flux variations on the order a few percent (Hill et al. 2000). Given the number of analyzed objects and the conservative errors we report, we expect that neglecting these effects would not impact our main results and conclusions.
4.2. Orbital analysis
With the hydrostatic layers of WR stars typically hidden behind thick winds, masses of WR stars are notoriously difficult to measure via spectroscopy. One of the most important advantages of WR binaries is that they enable a derivation of the mass via orbital analyses. If the orbital inclination i and both RV curves can be obtained, the masses of the companions can be calculated from Newtonian dynamics. This method is indispensable in the case of WR stars. Knowledge of these masses provides a critical test not only of stellar evolution models, but also of mass-luminosity relations that exist for WR stars (Langer 1989; Gräfener et al. 2011).
The orbital analysis follows a similar pattern to that outlined by Shenar et al. (2017). The first step in determining an orbit is the measurement of RVs. For single-lined targets, which always have WR-like spectra in our case, the RVs were measured by cross-correlating specific spectral lines or whole regions of lines (see below) with a template and fitting a parabola to the maximum region of the cross-correlation function (e.g., Zucker 2003). The template in this case was always chosen initially to be one of the observations, from which preliminary RVs were determined. A big advantage of using an observation as a template is that it is not affected by the fact that different spectral lines of WR stars may imply different RVs owing to their varying formation regions and asymmetric profiles. The spectra are then co-added in the frame of reference of the WR star using these RVs to create a high S/N template, which is then used to iterate on the RV measurement, thereby reducing the statistical measuring errors. The absolute values of the RVs are obtained by cross-correlating the template with a suitable PoWR model. The absolute values are therefore less certain (σ ≈ 30 km s−1) than the relative RVs, but this has no bearing on the orbit determination and binary identification.
For SB2 binaries, two different approaches are used. If unique spectral lines can be identified that originate only in one component, these lines are used to measure the RVs of the individual components. For the WR component, we repeat exactly the same procedure as done for single-lined binaries. For an OB-type component, we use suitable PoWR models as templates. If all spectral lines of high enough S/N show contributions of both components, we implement a 2D cross-correlation technique following Zucker & Mazeh (1994). In this case, the template is constructed from two templates, one for each component, each shifted across the velocity space. Since an observation cannot be used as a template for the WR star (because it is entangled with the companion), suitable PoWR models to derive the preliminary RVs are used instead. If the spectra could be disentangled, the RVs are derived again using the disentangled spectra as templates (see Sect. 4.3). In all cases, errors are calculated as in Zucker (2003).
The choice of lines or spectral regions to cross-correlate with depend on the target. Generally, the He IIλ4686 line, despite typically being the strongest spectral lines for WR stars, should be avoided for RV measurements if possible because it is very susceptible to wind variability and WWCs and is generally not a good tracer for the RVs of the star (see, e.g., Fig. 5 in Shenar et al. 2018). For SB1 or apparently single WR stars (BAT99 12, 31, 102), we use a large spectral region covering ≈4000−4600 Å, which includes Balmer lines, the He Iλ4388 and λ4471, He IIλ4200 and λ4542, N IVλ4060 lines, and the Si IVλλ4089, 4116 doublet (depending on the target). This enabled us to boost the measurement accuracy. No significant differences were obtained by exploring specific lines instead.
For the SB2 systems BAT99 19, 103, and 107, the RVs of both components are derived using a 2D cross-correlation technique on the whole available spectral region (≈4000−4600 Å). The initial templates were chosen to be suitable PoWR models, and after disentanglement (Sect. 4.3), they are replaced with the disentangled spectra. Similarly, the RVs of the companions in BAT99 95 were measured through a 2D cross-correlation, but this time using the sharp N IVλ4060 line alone, since no reliable template spectra could be established for other lines.
Because of the limited quality and small number of spectra available, the RVs of the SB2 systems BAT99 32 and 77 could only be established for the primary WR star using the N IVλ4060 line. The RVs of the WR primary in the SB2 system BAT99 113 is measured from standard cross-correlation of the whole spectrum, since the secondary contributes only ≈10% to the total light. The RVs of the secondary are measured by performing standard cross-correlation with the He Iλ4471 line. The same technique is used for the potential SB2 system BAT99 92, although this time, the He IIλ4686 is used for the WR primary, while the region 4000−4600 Å is used for the secondary. The He IIλ4686 line is used in this work because the WR primary is strongly diluted by the secondary, and is the only line clearly visible for the WR star. A compilation of the final measured RVs for each spectrum and the lines and spectral regions used are given in Tables C.1–C.3.
Once the RVs have been established, an SB2 orbit is then fit to the derived RVs of both components simultaneously, constraining the orbital period P, eccentricity e, RV amplitudes K1 ≡ KWR and K2, periastron time T0, and argument of periapsis ω (for non-circular orbits). The fitting is done using a self-written Python tool that relies on the minimization package lmfit6. The tool finds the best-fitting RV curves for both sets of RVs simultaneously through the Levenberg-Marquardt algorithm, which is a damped least-squares minimization technique. For the RVs of the WR component, we allow for a constant velocity shift, which is fixed by the relative offset of the O-star RVs, since the O star is much more reliable for absolute RV measurements.
4.3. Spectral disentanglement
Spectral disentanglement is a powerful mathematical tool that separates composite spectra to their constituent spectra7 (e.g., Bagnuolo & Gies 1991; Hadrava 1995; Marchenko & Moffat 1998). For this to work, spectra with a sufficient phase coverage (typically ≈5–10 spread roughly homogeneously in RV) are necessary. This condition is met for eight of our targets: BAT99 12, 19, 32, 77, 92, 95, 103, and 113. However, disentanglement attempts of BAT99 12, 92, and 95 did not yield plausible results. BAT99 12 and 92 are not found to show significant RV variation in the few CTIO spectra at hand. BAT99 95 is clearly a binary, but the FLAMES data at hand imply that it potentially consists of two WR stars and requires a better phase coverage to disentangle.
BAT99 19, 103, and 113 were disentangled using a self-written Python tool that applies the “shift-and-add” algorithm described in detail in Marchenko & Moffat (1998). This method already assumes knowledge of the RV orbits (Sect. 4.2). The shift-and-add technique relies on an iterative co-adding of all composite spectra in the frame of reference of star A, subtracting this (Doppler-shifted) template of star A from all composite spectra, and then co-adding the residual spectra in the frame of reference of star B. This results in two templates, one for star A and one for B. This iteration is performed until no further difference can be seen in the solution, which typically takes three to four iterations.
Since the RVs of BAT99 32 and 77 could not be derived, we attempted their disentanglement using the code Spectangular, which is based on singular value decomposition in the wavelength domain (Sablowski & Weber 2017), first applied to WR stars in Shenar et al. (2017). This procedure needs spectra spread over the orbital period and optimizes the orbital parameters or the RVs to minimize the residuals between the disentangled spectra and the observations. Simultaneously to the disentanglement, the code optimizes for the orbital parameters of the system. The relative light ratios are assumed to be constant throughout the orbit and are fixed to those derived from the spectral analysis (Sect. 4.1). To determine the orbital elements, we used an initial orbit from S08. Since S08 had a much better phase coverage of the orbit, we adopt their derived orbital parameters, with the exception of the amplitude K2 of the secondary, which is determined in our study.
5. Results
5.1. Spectral analysis
The derived stellar parameters for the WR binaries analyzed in this work are given in Table 2 and include the spectral type, effective temperature T* and T2/3 (effective temperature at τRoss = 2/3), surface gravity log g*, luminosity log L, radius (R* and R2/3), transformed radius log Rt, terminal velocity v∞, mass-loss rate Ṁ, Smith visual absolute magnitude Mv, Sm, fractional light ratio in the visual fV, surface hydrogen and nitrogen mass fractions XH and XN, projected rotation velocity v sin i, spectroscopic mass Mspec (see below), and reddening EB − V.
Derived parameters for LMC WN binaries with composite spectra.
For OB-type stars, Mspec is calculated via  . For WR stars, Mspec is calculated via mass-luminosity relations calculated for homogeneous stars by Gräfener et al. (2011). If XH ≥ 0.4, we specify the mass for a homogeneous star with the same XH and log L, since the star is presumably young and on the main sequence. Otherwise, we give the mass for a pure He star with the same log L, since it is expected that the H layer would be negligible in mass.
In cases in which the wind parameters for the OB-type stars could not be derived, we adopted mass-loss rates from Vink et al. (2001) and terminal velocities that scale as v∞ = 2.6 vesc (Lamers et al. 1995). When only upper or lower limits could be derived, the final models were calculated using these limits.
In the left panel of Fig. 4, we plot the HRD positions of the 31 WR components analyzed in our study. BAT99 72 is omitted because of its uncertain nature, and BAT99 92 is omitted since it is found to be a WC star (see Sect. A). In the right panel, we also include the positions of the putatively single WR stars in the LMC, as derived by H14 and Neugent et al. (2017). In Fig. 4, we also show evolution tracks calculated with the BPASS code. The left panel shows evolution tracks for primaries of various masses in binaries with an initial mass ratio of qi = 0.9 and Pi = 25 d. The right panel shows evolution tracks for the same initial masses, but for single stars.
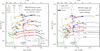 |
Fig. 4. Left panel: HRD positions of the LMC WR components. Labels correspond to the BAT99 catalog. A selection of binary evolution tracks (Eldridge et al. 2008; Eldridge & Stanway 2016) calculated with the BPASS code for Z = 0.008 are plotted. The tracks show the evolution of the primary star for several initial masses M1, i and initial mass ratio and period of qi = 0.9 and Pi = 25 d, respectively. The colors and symbols code the hydrogen abundance and WR type, as described in the legend. The WR phase is defined for T* > 20 kK. Right panel: as left panel, but showing BPASS tracks calculated for non-rotating single stars, and including the putatively single LMC WN stars (gray symbols, adopted from H14), and the WN/O3 stars (gray triangles, adopted from Neugent et al. 2017). Little arrows imply lower bounds on T* (degeneracy domain or insufficient S/N). |
In Fig. 5, we also show evolution tracks calculated with the Geneva code for single stars that rotate at 40% their critical rotation (Eggenberger et al., in prep.), kindly provided by C. Georgy (priv. comm.). The tracks were calculated at Z = 0.006 (close to the BPASS value of 0.008) and first presented in Georgy et al. (2015). These tracks behave very differently from the BPASS tracks, also compared to previous generations of the Geneva tracks published by Meynet & Maeder (2005). While a detailed comparison between the tracks is beyond the scope of this paper, the main difference likely originates in different mass-loss prescriptions between the codes. The Geneva tracks fail to reproduce even the most luminous cWR stars in the sample. We discuss the comparison between our results and the tracks in more detail in Sect. 6.
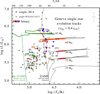 |
Fig. 5. Same as right panel of Fig. 4, but this time showing tracks calculated with the Geneva code for single stars rotating (initially) at 40% the critical rotation velocity at Z = 0.006 (C. Georgy, priv. comm.). |
5.1.1. Spectral classification
For the spectral classification of OB-type stars, we used quantitative schemes by Sana et al. (in prep.), which are extensions of schemes published by Mathys (1988, 1989), Walborn & Fitzpatrick (1990), and Walborn et al. (2002) for OB-type stars. For WR stars, we adopt previous classifications by Neugent et al. (2018) unless noted otherwise. The classifications are generally similar to those given by FMG03 and S08, with the exception that several WN4b stars in the latter studies became WN3 in Neugent et al. (2018). For /WN stars, we used morphological classification schemes by Crowther & Walborn (2011) and Massey et al. (2009). If an empirical spectral disentanglement was possible, we classified the disentangled spectra. Otherwise, we classified the individual model spectra, which should supply a good representation to the observed spectrum of the star. In many cases, however, better data quality and a better phase coverage would be necessary to confirm the spectral types.
5.1.2. Errors from the spectral analysis
Owing to the high computational cost of full non-LTE model calculations, a rigorous χ2-fitting that covers all parameters is not feasible. However, given that the study relied on grids of models, we can estimate realistic statistical errors on the parameters. Regardless, the true error is dominated by systematic errors, which originate, among other things, in the uncertain wind velocity field (Gräfener & Hamann 2005; Sander et al. 2017), clumping (Feldmeier 1995; Oskinova et al. 2007; Sundqvist & Owocki 2013), atmosphere inflation (Gräfener et al. 2012; Sanyal et al. 2015; Grassitelli et al. 2018; Ro 2019), and binary effects such as WWCs, mutual irradiation, and tidal deformations (Moffat et al. 1988; Shenar et al. 2017). It is our belief that the large number of analyzed systems compensates for these uncertainties.
For WR stars, the typical statistical errors on T* correspond to half a grid spacing, or  . Larger errors are possible for the hottest stars in our sample, or stars with very thick winds, which are found in a so-called degeneracy domain (see discussion in Todt et al. 2015). In this domain, T* and Rt cannot be derived independently. Errors of 0.05 dex in Rt are typical for single stars, but are somewhat larger for WR binaries owing to degeneracy with the relative light ratios. Depending on how well the latter could be constrained, errors Depending on how well the latter could be constrained, errors on Rt are conservatively estimated to be
  , except for stars in the degeneracy domain, where Rt values could be arbitrarily smaller. Terminal velocities of WR stars are derived to a typical accuracy of
  . Hydrogen mass fractions are determined with an accuracy of
  .
.
For OB-type stars, the temperature can typically be derived to an accuracy of 2−3 kK, which is roughly twice the spacing of our grid. The main reason for this relatively large error is contamination with WR features, which are often hard to disentangle, as well as degeneracies with log g. The log g* value could be poorly constrained because the Balmer absorption lines of the OB-type components are often filled with emission stemming from the WR star. Nevertheless, this parameter could be constrained to a certain degree since larger log g* values result in larger equivalent widths for the Balmer lines. A typical uncertainty on log g* amounts to 0.3 dex.
Transformed radii are not a helpful quantity for OB-type stars, for which the mass-loss rate is derived directly. The mass-loss rates and terminal velocities could only be constrained for OB-type stars in some cases, depending on the data (see Appendix A for a detailed account.). The errors on Ṁ for OB-type stars, when a value is given, are typically on the order of 0.3 dex. Errors on their terminal velocities, when such were derived, are about 200 km s−1. Finally, the light ratios could typically be derived at a ≈20% level.
The total luminosity and reddening could be well constrained from the data, especially when flux-calibrated UV spectra are available. Despite the T* − Rt degeneracy mentioned above, the errors on log L are typically modest. This is because “degenerate” models, that is, models with different T* − Rt values but virtually identical spectra, produce almost identical SEDs; therefore these models require almost identical luminosities. Models with larger T* would therefore have correspondingly smaller radii R* to preserve log L. The errors on the luminosities are primarily dominated by errors on the light ratios. Together with the error from the SED fitting, this amounts to 0.1–0.15 in log L, depending on how well constrained the light ratios are. The reddening EB − V can be derived to an accuracy of 0.02 mag in cases where UV spectra are present, and to 0.05 mag otherwise. Similarly, errors on the absolute visual magnitudes MV are affected by errors on the light ratios, and typically correspond to 0.15 mag.
The remaining errors follow from error propagation. For R*, this amounts typically to 0.5 R⊙ for R* < 10 R⊙ and 1 R⊙ otherwise. Since the mass-loss rate of WR stars scales with  , errors on WR mass-loss rates are on the order of 0.15–0.2 dex. While Ṁ also depends on R* and v∞ and is thus subject to further errors, a change in R* tends to result in a corresponding change in Rt in a way that conserves the value of Ṁ. We therefore only account for errors on Rt in this work.
Errors on Mspec for OB-type stars arise from errors on R* and log g*, the latter being especially large. This easily corresponds to a factor two uncertainty in the mass. As for WR stars, the errors can be estimated from the mass-luminosity relations used (see Sect. 5.1) by considering the errors on log L and XH. Rotation velocities are determined to an accuracy of ≈30−50 km s−1, depending on the resolution of our data. For co-added spectra, typically only upper limits could be derived (see Sect. 3).
5.1.3. Disentangled spectra
The results of our disentanglement of BAT99 19, 32, 77, 103, and 113 are shown in Figs. 6–10. In all cases, the observed composite spectra are corrected for the systematic velocities (see Table 3). We note that the disentangled spectra are intrinsic to the components, i.e., they are corrected for line dilution.
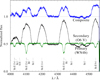 |
Fig. 6. Disentanglement of BAT99 19 using the shift-and-add technique. One of the observed composite FLAMES spectra (blue line) and the disentangled spectra for the WR primary (black line) and O-type secondary (green line) are shown. The levels of the spectra of the components reflect their fractional contribution to the total continuum flux. |
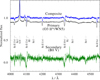 |
Fig. 10. Same as Fig. 6, but for BAT99 113. The disentangled spectrum of the secondary is binned at 1 Å to increase the S/N. |
Orbital parameters of LMC WN binaries with constrained orbits.
The disentangled spectra of BAT99 19 (WN4b + O6 V, P = 18 d) imply a very large v sin i value for the secondary in excess of 550 km s−1 (Fig. 6). This is by far the largest rotational velocity observed in our sample (Sect. 6.3). Together with its period, this may imply that BAT99 19 recently experienced a mass-transfer event. Interestingly, the spectral lines of the WR star are also peculiarly round and broad (Fig. A.4). Such profiles were attempted to be reproduced by assuming rotation of the WR star in Shenar et al. (2014), requiring large corotation radii. It is not certain whether these line profiles are indeed related to rotation or not, but their shape is rare among WNE stars. Given that BAT99 19 is an eclipsing system with such unique properties, we encourage its future study.
The disentangled spectra of the binary BAT99 32 (WN5 + WN6(h) (+abs), P = 1.9 d) – the shortest-period WR binary in our sample – appear to suggest that both components exhibit WR-like spectra (Fig. 7). However, the disentangled spectrum of the secondary (green spectrum) is also suggestive of an additional absorption component, i.e., the system may be a triple. If BAT99 32 is indeed a WR+WR binary, it would be an extremely important system to study. Given its short period, it could be a promising candidate for a BH merger progenitor experiencing chemically homogeneous evolution (CHE). Alternatively, it could be a rare, short-period ms-WR + ms-WR system such as the 3.7 d period Galactic WR binary WR20a (Rauw et al. 2004). Either way, these findings warrant additional studies of BAT99 32. Whether this result is real or a spurious effect from the limited number of spectra should be verified in future studies.
With only four phase-dependent spectra available, the results for BAT99 77 (WN7h + O7 III, P = 3.0 d) are peculiar (Fig. 8): The spectrum of the primary WR star seems reasonable (albeit likely contaminated by the secondary’s spectrum), but the spectrum of the secondary is almost featureless. Some features, such as the He IIλ4686 emission, are clearly biased owing to contamination with the WR star. While some weak He I lines are present, He II lines are almost completely absent, and the Balmer lines are extremely weak. In contrast, He II absorption lines are clearly seen in the co-added spectrum at hand. It is therefore likely that our results for this system, especially for the secondary, do not represent the component spectra well. Clearly, better data will be needed to properly disentangle this system.
The disentangled spectra of BAT99 103 (WN5h + O3.5 V, P = 2.8 d) seem plausible, but significant deviations are seen in the residual spectra. These are most likely caused primarily by WWC, which is not accounted for in the disentanglement procedure. However, these features are not expected to interfere with the classification and analysis of the object.
The disentangling of BAT99 113 (O3 If*/WN5 + B0 V) was especially challenging because of the faintness of the secondary, which contributes only 10% to the total light in the visual. Because of this, the S/N of the spectrum of the secondary is relatively low. Nevertheless, clear signatures of He I absorption can be seen in its spectrum. The Balmer lines are likely contaminated by the WR star; more data will be necessary to improve the disentanglement.
5.2. Orbital analysis
Many constraints on the orbital configurations of our targets are given by by FMG03 and S08. The vast majority of these solutions are SB1, i.e., they do not include the RV amplitude of the secondary. Worse still, the orbital inclination i is in most cases unknown. In this study, we were able to derive SB2 solutions for seven systems: BAT99 19, 32, 77, 95, 103, 107, and 113, where the orbital parameters of BAT99 32 and 77 come from disentanglement (see Sect. 4.3), and those of BAT99 19, 95, 103, 107 and 113 from the orbital analysis. The RVs measured for BAT99 12, 31, and 102 are constant within 3σ, while the nature of BAT99 92 is uncertain (see Appendix A).
The orbital parameters derived in this work and in previous studies are given in Table 3. The orbital solutions derived for BAT99 19, 95, 103, 107, and 113 are shown in Figs. 11–15. To constrain the minimum masses MWR sin 3i and M2 sin 3i from the orbit, knowledge of the period P, eccentricity e, and the RV amplitudes KWR and K2 is needed. To constrain MWR and M2 and the semimajor axes aWR and a2, the inclination i is needed. Unfortunately, the full set of these parameters can only be measured in rare cases, for example, SB2 eclipsing binaries. For the majority of our sample, only P, e, and KWR could be constrained. Thus, Table 3 is divided into five groups of objects, depending on the amount of information available on the system.
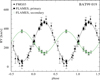 |
Fig. 11. Orbital solution for BAT99 019. |
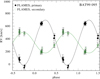 |
Fig. 12. Orbital solution for BAT99 95. |
 |
Fig. 13. Orbital solution for BAT99 103. |
 |
Fig. 14. Orbital solution for BAT99 107. |
 |
Fig. 15. Orbital solution for BAT99 113. |
The first group of objects (BAT99 19, 119, and 129) in Table 3 are SB2 binaries (i.e., KWR and K2 known) with constrained inclinations. The inclination of BAT99 119 is constrained from polarimetry (Shenar et al. 2017). For the eclipsing systems BAT99 19 and 129, a lower bound on i, imin, is derived from the critical angle necessary to obtain eclipses via an iterative solution of tani > (R1 + R2) a(i)−1, using the stellar radii given in Table 2. We then calculate ⟨sin3 i⟩ for imin < i < π/2, from which i is derived. The masses are then derived from ⟨Mj⟩ = Mj sin3 i/⟨sin3 i⟩. This is the only group of objects for which both MWR and M2 can be derived virtually without assumptions.
The second group of objects (BAT99 49, 77, 103, 107, 113, 116) also consists of SB2 binaries, but while M sin3 i is constrained for both components, the inclinations are not. In this case, either M2 or i need to be adopted to retrieve MWR, which is one of the main purposes of this study. We chose to fix M2 to the evolutionary mass predicted for the secondary with the derived physical parameters given in Table 2. For this purpose, we used the BONNSAI8 Bayesian statistics tool (Schneider et al. 2014). Using the input of stellar parameters (T*, log L, log g, v sin i) and their corresponding errors from Table 2, the tool interpolates between evolutionary tracks calculated at LMC metallicity by Brott et al. (2011) and Köhler et al. (2015) for stars with initial masses up to 500 M⊙ and over a wide range of initial rotation velocities. Based on this set of evolution tracks, the BONNSAI tool predicts the most likely current mass of the secondary M2 with corresponding errors. With the orbital parameters and M2 fixed, the inclination i and the mass of the primary MWR can be derived. We caution, however, that the results depend on the evolutionary models and the Bayesian algorithm. Given the potential systematics, we adopt an error on M2 that is twice as large as given by the BONNSAI tool.
The third group consists of WR+WR SB2 binaries: BAT99 32 and 95. Like the objects in the second group, they do not have constrained inclinations, but because both components appear to be WR stars, adopting their mass based on evolutionary models is uncertain. We therefore adopt the inclination in this case, and fix i to its mean statistical value so that sin3 i = ⟨ sin3 i⟩ = 3π/16, or i = 57°. The unconstrained values of MWR and M2 follow. BAT99 116 is not included in this group (but in the previous one) because the components are “ms-WR” stars, for which evolutionary masses should be more reliable.
The fourth group of objects comprises binaries (BAT99 6, 43, 64, 71) with constrained inclinations but unconstrained K2, which in all cases come from reported eclipses in the systems. In this case, we fix M2 using the BONNSAI tool, exactly as done for the second group. The inclination is constrained just as for the first group.
The final group of objects, to which the majority of our sample belongs, contains systems that have neither K2 nor i constrained. In this case, we refrain from giving M1 and M2 since the errors are too large to yield helpful information.
While the majority of masses derived in this work are plausible, the masses derived for the components of BAT99 32 and BAT99 64 are unlikely to be correct. BAT99 32 may have an exceptionally low inclination. For example, i ≈ 20° would increase the masses from 2 M⊙ to about 20 M⊙. As for BAT99 64, it is possible that the mass adopted for the secondary based on calibration with the BONNSAI tool is wrong, perhaps because of a previous mass-transfer event. We further note that the orbital solution of BAT99 64 is based on relatively low resolution data by FMG03, and may therefore require improvement. A more detailed discussion regarding the individual targets can be found in Appendix A.
5.3. Photometric variability
A few of our targets are eclipsing binaries (see Table 1). Light curves retrieved from the MAssive Compact Halo Objects (MACHO) survey for eclipsing binaries have been presented by FMG03 for BAT99 19, BAT99 62, and BAT99 129, as well as for the marginally eclipsing binaries BAT99 43 and BAT99 71, while a light curve for BAT99 6 is presented by Niemela et al. (2001). We present two recently published light curves taken from the Optical Gravitational Lensing Experiment (OGLE) survey of BAT99 19 and BAT99 126 (Graczyk et al. 2011).
In Fig. 16, the light curve of BAT99 19 is folded with the orbital periods given in Table 3. As shown by FMG03, the system shows clear double eclipses. The unique nature of the WR star in this system, the very rapid rotation of the companion (veq = 550−600 km s−1) and the fact that it is an eclipsing binary sets this target as a promising future candidate for focused studies of binary interaction.
In Fig. 17, we show the OGLE light curve of BAT99 126. Graczyk et al. (2011) published a period of P = 1.55 d, which is used to plot the phase-folded light curve in Fig. 17. Interestingly, this period is much shorter than the spectroscopic period of P = 25.5 d reported by FMG03. This either suggests an error on the RV derivation of the components, or the presence of additional companions. A follow-up study of BAT99 126 using newly acquired UVES spectra will soon be executed (Shenar et al., in prep.).
 |
Fig. 17. Light curve of BAT99 126 folded with P = 1.55296 d and T0 = 2100.55. |
6. Discussion
6.1. Evolutionary status
Below, we discuss several aspects involving the evolutionary status of the WR stars in the LMC.
6.1.1. Single versus binary
The HRD positions of putatively single WN stars and the binary WN components, seen in Fig. 4, seem to populate a similar regime on the HRD, with a few notable differences. While a few massive WN components in binaries populate the 5.8 < log L/L⊙ < 6.2 region in the HRD (e.g., BAT99 103, 113, 116), no single stars populate this region. Moreover, apparently single WN stars reach luminosities of up to log L/L⊙ = 6.9 (notably BAT99 108 alias R 136a1), while WN components in binaries reach only log L/L⊙ = 6.4. If not due to low-number statistics, this may imply that the most massive stars are in fact the products of binary mergers (Crowther et al. 2010; de Mink et al. 2014).
All WN components in binaries have T* ≳ 40 kK, while effective temperatures of single WN stars go down to T* ≈ 25 kK. Since cooler WR stars typically occupy a larger volume, it is possible that they are less likely to maintain their large radii in close binaries owing to presence of the secondary star. Such late-type WN stars are therefore more likely to be stripped by a companion and appear hotter.
Perhaps the most surprising result is that the bulk of apparently single and binary WN stars span the same luminosity regime in the HRD, both reaching a minimum luminosity of log L/L⊙ ≈ 5.2−5.3. This means that there is no clear empirical evidence suggesting that the binary channel enables lower mass stars to enter the WR phase. Naively, this also seems to suggest that there is no dividing mechanism operating in the formation of the low-luminosity WR stars of both the apparently single and the binary WN stars. We discuss this question in more detail in Sect. 6.1.3.
6.1.2. Initial masses, ages, and evolutionary path
Evolved massive stars may reach radii > 1000 R* during the red-supergiant phase, and as a consequence, (eccentric) massive binaries with periods of up to 10 000 d may interact during their lives. Given the relatively short periods of our targets (P < 200 d), past binary interaction seems inevitable. The only way the components in our systems may have avoided mass transfer is if the primary retained a small radius throughout its evolution. Generally, the more chemically homogeneous a massive star is, the smaller it is going to be throughout its evolution. The extreme case is described by CHE (Maeder & Meynet 1987; Heger et al. 2000; de Mink et al. 2009; Koenigsberger et al. 2014; Szécsi et al. 2015; Song et al. 2016), in which the star never expands beyond its main-sequence radius. If the primary experiences CHE, mass transfer is always avoided. Usually, CHE is explained by invoking large initial rotation, which can efficiently mix the star. However, CHE can also be thought of as a proxy for increased homogeneity of massive stars, for which evidence is currently accumulating (e.g., Ramachandran et al. 2019; Higgins & Vink 2019). It should be further noted that while evolution tracks always pass through the red-supergiant phase for all progenitor masses, no red supergiants with progenitor masses ≳25 M⊙ have ever been observed (Humphreys-Davidson-limit: Humphreys & Davidson 1979; Davies et al. 2018). Hence, it is important to consider the possibility that the components of the systems have not interacted in the past.
To investigate the evolutionary paths of our targets, we therefore distinguish between three alternatives: (i) the primary expanded enough for mass transfer to have occurred, (ii) the primary experienced CHE and the secondary did not, and (iii) both components experienced CHE. To consider these three alternatives, we follow a similar procedure as described in Shenar et al. (2016). To perform a systematic comparison between these three scenarios, we use a precalculated grid of evolution models calculated with the BPASS code (Eldridge et al. 2008; Eldridge & Stanway 2016) for Z = 0.008 (typical LMC metallicity). We stress that the efficiency and nature of mass transfer is “hard-coded” in the BPASS models (see, e.g., Eldridge & Stanway 2016). There are many uncertainties involving the details of mass transfer whose exploration is beyond the context of the current work. We rather try to investigate whether or not the components interacted in the past, but encourage future studies to construct detailed models for the individual systems.
To explore the scenario in which the binary components did not evolve homogeneously and interacted via mass transfer in the past, we utilize a grid of BPASS binary tracks calculated for nonhomogeneous binaries. Each track is defined by a set of three parameters: the initial mass of the primary Mi, 1, the initial period Pi, and the initial mass ratio qi = Mi,2/Mi,1. The tracks were calculated at intervals of 0.2 on 0.2 ≤ log P [d] ≤ 4, 0.2 on 0.1 ≤ qi ≤ 0.9, and at unequal intervals of 5−30 M⊙ on 10 < Mi,1 < 150 M⊙. We then find the best-fitting binary track and age t for each system by minimizing
 (3)
(3)
where On ∈ log TWR, log LWR, log T2, log L2,Morb,WR,Morb,2 log P,XH, WR} are the measured values for the considered observables, and En(Pi,qi,Mi,1,t) are the corresponding predictions of the evolutionary track defined by Pi, qi, and Mi,1 at time t. The σn account both for measurement errors (Sect. 5.1.2) and the grid spacing (see details in Shenar et al. 2016). We explore this scenario only for systems with constrained periods. Through this minimization procedure, we derive the initial masses (primary and secondary), the initial period for each system, and the age of the system. The best-fitting binary-evolution tracks for BAT99 49 are shown in the leftmost panel of Fig. 18.
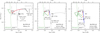 |
Fig. 18. Best-fitting BPASS tracks and ages for BAT99 49 for the case of (i) binary mass transfer, (ii) the primary evolving homogeneously and secondary nonhomogeneously (middle panel), and (iii) both components evolving homogeneously (right panel). Colors and styles are shown as in Fig. 4. The circles correspond to the derived ages. Evidently, only the binary channel offers a consistent fit for BAT99 49. |
Next, we consider the case in which the primary underwent CHE and the secondary did not. For this purpose, we consider a grid of chemically homogeneous BPASS tracks calculated for Z = 0.008, which run over the initial mass of the star at a spacing of 1 M⊙ for Mi ≤ 30 M⊙, and 5−10 M⊙ otherwise. We find the best-fitting initial mass and age for a homogeneously evolving primary by minimizing
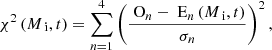 (4)
(4)
where On ∈ {log T*, WR,log LWR,Morb,WR,XH,WR}. The σn have the same meaning as in Eq. (3). We then repeat this procedure for the secondary for a grid of nonhomogeneous single-star BPASS tracks. Assuming that the two components are coeval, we fix t to the age derived for the WR star. A corresponding best-fitting track (at the age of the WR star) is then associated with the secondary. The corresponding best-fitting BPASS tracks for BAT99 49 are shown in the middle panel of Fig. 18. Evidently, this scenario cannot account for the properties of the system.
To explore the final alternative, in which both components undergo CHE, we perform the same minimization procedure as above, but this time scanning a grid of homogeneous models for the secondary. The corresponding best-fitting BPASS tracks for BAT99 49 are shown in the rightmost panel of Fig. 18. This scenario is also ruled out for BAT99 49. Hence, relying on the BPASS tracks and our results, only past mass transfer can explain the properties of BAT99 49. Moreover, according to our solution, the WR primary is of the type b-WR, since it could only form via binary mass transfer. The rough BPASS solution therefore suggests that BAT99 49 started off as a 30 M⊙ + 27 M⊙ binary with an initial period of Pi ≈ 60 d. 6.2 Myr after its formation, the system experienced a highly nonconservative case B mass transfer via RLOF, during which about 10 M⊙ were removed from the primary, which then entered the WR phase. Only ≈1 M⊙ were accreted by the secondary. During this phase, the period of the orbit tightened from P ≈ 60 d to somewhat less than ≈30 d. The period since slowly increased due to wind mass loss to the current observed value (32 d), 6.6 Myr after the formation of the system.
Initial masses, periods, and ages for the binary scenario are given in Table 4 in cases for which a solution could be found. Solutions were rejected if at least one of the observables did not fit with the track within 2σ (“no solution”). If a solution exists for the CHE scenario, we also give the corresponding initial masses and age. In this case, we always choose the best-fitting CHE scenario (i.e., only the primary evolved via CHE, or both components evolved via CHE). In some cases, the CHE solution requires an initial mass that is above the upper limit of the grid of 100 M⊙. In this case, we state that a solution may exist for initial masses larger than 100 M⊙. Additionally, for each WR star, we specify in Table 2 which evolutionary channel (ms-,w-,bw-,or b-WR) is most consistent with the properties derived according to the BPASS tracks. We warn that this classification strongly depends on the evolution tracks being used (see Sect. 6.1.3). An account for this classification for each target, as well as figures in the form of Fig. 18, are given in Appendix A.
Derived initial masses, initial periods, and ages.
About one-third of the WN stars in our sample are classified as ms-WR stars, based on their HRD positions, masses, and hydrogen mass fractions. The rest are identified as cWR stars. For all cWR binaries in the sample but BAT99 32, 95, we can rule out CHE for the secondary. Unlike the SMC, however, we find that it is in most cases impossible to tell, considering the errors of our analysis, whether the primary evolved homogeneously or not. Because of the uncertain evolution channel of the primary, it is hard to accurately assess the incidence of b-WR or wb-WR stars among the cWR binaries that have interacted with a companion, which we estimate to be 45 ± 30%. This very large error is a direct result of the uncertain evolution channel of the WR progenitor (CHE versus standard). However, based on the BPASS tracks, we can estimate that only 12 ± 7% of the cWR stars in binaries formed purely due to binary interaction, i.e., 12% are potentially b-WR stars.
6.1.3. Incidence of binary-stripped WR stars (b-WR)
In Sect. 1, we defined b-WR stars as WR stars that could only form via binary mass transfer, and argued that they are expected to be common, especially at low metallicity. Only a few promising candidates for b-WR stars exist. One prominent example is the so-called quasi-WR (qWR) star HD 45166 (Groh et al. 2008), for which peculiar wind parameters and an exceptionally low inclination (0.7°) were derived. Several low-mass (≈1 M⊙) O-type subdwarfs, which are believed to originate from binary mass transfer, have been discovered near B-type stars (the putative mass-accretors), but their masses are too low to support a strong stellar wind and a corresponding WR star appearance (e.g., Wang et al. 2018). So-called extreme helium stars (e.g., Jeffery & Hamann 2010) also do not fall into the mass/luminosity range that b-WR stars are expected to populate. While other peculiar WR stars have been suggested to originate from binary interaction (Schootemeijer & Langer 2018; Neugent et al. 2017; Smith et al. 2018), there is an apparent disagreement between the predicted abundance of b-WR stars and their observed number. Whether this disagreement points toward strong observational biases or flaws in population syntheses is still not clear.
We can roughly estimate the expected incidence of b-WR stars among a population of cWR stars. Denoting with Mi,w-WR the minimum initial mass a star needs to enter the WR phase as a single star, where Mi,WR is the minimum initial mass for which a stripped star would appear as a WR star, fstrip is the fraction of stars that would be stripped of their H-envelope by a companion, and TcWR the lifetime of the WR phase, we can estimate the expected incidence of purely binary-stripped (b-WR) stars among all cWR stars (single and binary) in a given population for a constant star formation rate as follows:
 (5)
(5)
where the Salpeter (1955) IMF was assumed.
We now need to estimate the values of Mi,w-WR and Mi,WR. Extrapolating mass-loss recipes published by Hainich et al. (2015) and constructing corresponding PoWR models implies that the WR phenomenon ceases below log L ≈ 4.8 [L⊙] at LMC metallicity, corresponding to Mi,WR ≈ 15 M⊙. In contrast, PoWR models calculated following recent recipes published by Vink (2017) for optically thin winds of stripped stars imply that the WR phenomenon stops below ≈5.5 [L⊙], corresponding to Mi, WR ≈ 30 M⊙. Because these results are very discrepant, we choose to estimate the minimum luminosity of WR stars empirically. The HRD positions seen in this work, along with those published by H14 and Neugent et al. (2017), imply that the WR phenomenon stops below log L ≈ 5.2 [L⊙] in the LMC, corresponding roughly to Mi,WR ≈ 20−25 M⊙. Based on the BPASS evolution tracks, stars with Mi ≳ 35 M⊙ can become WR stars as single stars, i.e., Mi,w-WR ≈ 35 M⊙. In stark contrast, the Geneva tracks (Fig. 5) imply Mi,WR ≈ 70 M⊙. To obtain TcWR(m), we assume that it is equal to the lifetime of the core He-burning phase, which should be a good approximation for the order-of-magnitude estimate performed in this work. The value TcWR(m) is estimated from Eq. (79) in Hurley et al. (2002). Finally, we adopt fstrip = 0.33, as estimated by Sana et al. (2012). We note that it is possible that fstrip becomes smaller for larger masses due to, for example, their increased homogeneity. Plugging all of these into Eq. (5), we obtain an expected incidence of 30% b-WR stars among all cWR stars in the LMC for Mi, w-WR = 35 M⊙ (BPASS value), and 70% for Mi, w-WR = 70 M⊙ (Geneva value).
We now turn to estimating the observed incidence of b-WR stars in the LMC. First, we need to consider the fact that the WC stars are not included in this work. However, since WC stars comprise about 18% of the whole WR content in the LMC, we assume for our estimate that WN are representative of the whole population. Let us assume that the apparently single WR stars truly formed as single stars. In this case, assuming the validity of the BPASS tracks (Mi,w-WR = 35 M⊙), the observed incidence of b-WR/cWR stars is merely 4 ± 2% in the LMC, which is a factor ten lower than expected (≈30%). If we take the Geneva value of Mi,w-WR = 70 M⊙ instead, virtually all cWR stars in our sample would be classified as b-WR and we would obtain a total incidence of b-WR/cWR of ≈12%, which is about six times smaller than predicted (≈70%). Both of these reveal a strong discrepancy between observation and theory. The immediate conclusion is that either the expected incidence of b-WR stars was strongly overestimated, or that the number of observed b-WR stars is strongly underestimated. We suggest that one of the following should hold:
-
pre-WR mass-loss is widely underestimated in evolution codes. Taking the small observed incidence of b-WR stars at face value, one way for Eq. (5) to yield similarly small fractions for the predicted incidence is by plugging in a lower value for Mi,w-WR. Values in the vicinity of Mi,w-WR = 25 M⊙ would make the denominator approach zero. For example, the Brussels evolution code predicts that single stars may already reach the WR phase intrinsically for Mi,w-WR ≈ 25 M⊙ in the LMC (Vanbeveren et al. 1998a,b). Thus, enhancing pre-WR mass-loss rates can mitigate the apparent contrast between observation and theory. Porosity, which is often neglected in determinations of the mass-loss rate, can be one cause for a possible underestimation of Ṁ (e.g., Oskinova et al. 2007). Additionally, underestimated mass loss during the red-supergiant phase (van Loon et al. 2005), or the lack of treatment of eruptive mass loss during an luminous blue variable-like phase (Owocki et al. 2017), may be important to consider. However, this does not seem to agree with the multitude of studies suggesting a lowering of mass-loss rates throughout the evolution of massive stars (e.g., Puls et al. 2008; Mauron & Josselin 2011; Vink 2017).
-
Mixing of stars with Mi ≳ 20 M⊙ is much more efficient than assumed in evolution codes. Mixing in massive stars is poorly constrained, especially for Mi ≳ 20 M⊙ (e.g., Higgins & Vink 2019; Schootemeijer et al. 2019). Mixing increases the size of the stellar core and reduces the size of the envelope that needs to be stripped in order for the star to enter the cWR phase. Therefore, it effectively reduces the value of Mi,w-WR, increases the efficiency of single-star evolution in forming cWR stars, and reduces the importance of binary interaction in forming WR stars. While observed distributions of rotational velocities (e.g., Ramírez-Agudelo et al. 2013, 2017; Sabín-Sanjulián et al. 2017) render rotationally induced mixing unlikely for the population as a whole, alternative mixing processes (e.g., gravity waves, Aerts et al. 2018; Bowman et al. 2019) that are usually not included in evolution models may play an important role in the evolution of massive stars.
-
The majority of LMC WR stars – both apparently-single and binary – are products of binary interactions. If mass loss/mixing cannot be further increased to explain the existence of apparently single, low-luminosity WR stars, a solution involving binary mass transfer seems hard to avoid. Vanbeveren et al. (1998a) predicted that ≈80% of the apparently single WR stars were affected by past binary interaction. However, this requires that we explain the apparent lack of companions for putatively single WR stars in the LMC. Several binary channels that produce apparently single WR stars exist. One of these channels may involve envelope stripping by low-mass companions (e.g., Paczynski 1976; Podsiadlowski et al. 1992; Schootemeijer & Langer 2018). Instead of a bright mass-gainer, these stars may host low-mass stars that have stripped the envelopes of the WR progenitors during CEE. Another possibility involves three-body interactions in triple systems, ejecting the stripped WR star from the original binary, and producing a truly single WR star with binary history (e.g., Hut & Bahcall 1983; Toonen et al. 2016). A third alternative is that the WR stars were the original secondaries in binaries. After the primary exploded as a SN (or directly collapsed to form a BH), the secondary would eventually fill its Roche lobe and a second mass-transfer phase would initiate. Such a system may eventually appear as a low-luminosity WR star. However, systems that survive both mass-transfer phases are expected to be very rare (e.g., van den Heuvel et al. 2017). Moreover, for these systems to appear as single stars requires both an inhibition mechanism of the anticipated X-ray emission and orbital RV shifts that fall below the detection threshold. Finally, it is possible that single low-luminosity WR stars may form through the merging of two stars, during which the merger product loses much of its outer H-rich envelope.
6.2. Mass-luminosity relation
In Fig. 19, we show the positions of the WR components in a mass-luminosity diagram. The luminosities are taken from Table 2, while the masses are taken from Table 3. Only measurements with constrained errors are shown. Also plotted are mass-luminosity relations calculated for homogeneous stars with different hydrogen mass fractions by Gräfener et al. (2011) and the Eddington limit for an atmosphere composed of helium.
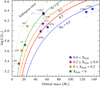 |
Fig. 19. Positions of the WR components on a M − log L diagram (symbols) compared to mass-luminosity relations calculated for homogeneous stars (Gräfener et al. 2011), depicted by solid curves. The colors correspond to the hydrogen content (see legend). The Eddington limit calculated for a fully ionized helium atmosphere is also plotted (gray dashed line). |
It is evident that the observations roughly follow the trends of the mass-luminosity relations. Considering the uncertainties, more data (spectroscopic, photometric, and polarimetric) are necessary to reduce the errors on the orbital masses. However, statistically, it appears that WN stars containing some hydrogen lie above their respective mass-luminosity relation. That is, the stars are overluminous compared to a homogeneous star with the same amount of hydrogen. This suggests that the majority of these stars are not homogeneous and likely core He-burning. A similar result was obtained for the SMC sample (Shenar et al. 2016).
6.3. Rotational velocities of the OB-type companions
When mass transfer in binaries occurs, companions not only accrete mass, but also angular momentum. Mass accretors are expected to reach near-critical rotation (Packet 1981). It is therefore expected that, if the OB companions of the WR binaries in our sample accreted mass in the past, they would exhibit large rotational velocities.
In Fig. 20, we plot a normalized histogram of the projected rotational velocities measured for 26 OB-type companions in our study in bins of 50 km s−1. In cases in which only upper limits v sin iup could be derived, a flat contribution for all bins with v < v sin iup is assumed. Evidently, the distribution peaks around 150 km s−1 and quickly drops beyond 200 km s−1. Similar results were recently obtained by Shara et al. (2017) and Vanbeveren et al. (2018) for several Galactic WR+O binaries. A single outlier, BAT99 19, reaches the very large value of 550 km s−1. While its edge-on geometry (i ≈ 90°) favors a large v sin i value, inclination effects are expected to lead to an overall shift of ≈50 km s−1 for the general distribution, leaving BAT99 19 a clear outlier in terms of its rotational velocity.
 |
Fig. 20. Normalized distribution of v sin i values for the 26 OB-type companions of WN stars measured in this work (blue) compared with v sin i distributions for apparently single and binary OB-type stars in the Tarantula region, adopted from Ramírez-Agudelo et al. (2013, 2015). |
Figure 20 also includes v sin i measurements for 216 apparently single O-type stars and 114 O-type primaries of spectroscopic binaries in the Tarantula region, adopted from Ramírez-Agudelo et al. (2013) and Ramírez-Agudelo et al. (2015), respectively. It is apparent that our sample, which is much smaller than the Tarantula samples, exhibits more rapid rotation on average than the Tarantula single-star distribution, and is comparable to the Tarantula binary distribution. This is compatible with the fact that many companions of WR stars in our sample accreted mass and hence angular momentum from their companions. However, it is also apparent that most companions in our sample are far from being critical rotators, where vcrit is on the order of 600−700 km s−1.
In Fig. 21, we show a histogram of the estimated equatorial rotation velocities veq for 16 OB companions in our sample for which v sin i and i are both constrained, assuming that the orbital inclination is identical to the rotational inclination. Values for v sin i are taken from Table 2 and for i from Table 3. Accounting for projection effects, the following three WR binaries with rapidly rotating companions are revealed: BAT99 19, 49, and 103.
 |
Fig. 21. Histogram of veq for the 16 OB-type companions of WN stars with constrained v sin i (Table 2) and i (Table 3), assuming an alignment of the rotational and orbital axes. Upper limits contribute equally to all lower bins, hence the fractional counts. |
As for the remainder of the sample, if the OB companions accreted mass, their rotations seem to have been slowed down over the course of ≈0.5 Myr (typical half-lifetime of a WR star). For example, BAT99 129 appears to be a post mass-transfer system in which the companion rotates with a moderate speed of veq ≈ 200 km s−1. It has been speculated (e.g., Vanbeveren et al. 2018) that the braking of the rotation occurs as a consequence of strong magnetic fields arising during the accretion process, which slows down the rotation of the mass accretors (Meynet et al. 2011). The fact that the companion of BAT99 19 is still such a rapid rotator may suggest that the mass transfer only occurred recently.
6.4. Prescription for WN mass-loss rates
Combining the results for the single WN stars in the SMC with those obtained for single WN stars in the Milky Way (Hamann et al. 2006), the Andromeda galaxy M 31 (Sander et al. 2014), and the LMC (H14), Hainich et al. (2015) derived an empirical prescription for the mass-loss rates of WN stars as a function of L, T*, XHe, and Z. We repeat this exercise by including the binary WN stars in the SMC (Shenar et al. 2016, 2018) and LMC (this work). Moreover, the parameters of the single Galactic WN stars were recently revised based on the new Gaia distances (Hamann et al. 2019), and are therefore updated in our analysis. We assume Z = 0.018, 0.014, 0.006, 0.0012 for M 31, the MW, LMC, and SMC, respectively (see thorough discussion in Hainich et al. 2015). As Hainich et al. (2015), we utilize a χ2 fitting procedure between the observed parameters and the following linear relation with the five unknowns Ci, i ∈ 1, 2, 3, 4, 5:
 (6)
(6)
The resulting coefficient and their formal standard deviations are listed in Table 5, along with the total sample size. In Fig. 22, we show the relation projected to the LMC metallicity and different ranges of hydrogen mass fractions. The temperatures, which are of secondary importance for the mass-loss rates, are fixed to typical values per subtype for this illustration (see legend). We also plot the commonly used prescriptions by Nugis & Lamers (2000) for hydrogen rich/free WR stars, projected onto the LMC metallicity. Finally, we plot the relation recently published by Vink (2017) for stripped He stars at Z = ZLMC, which applies for optically thin winds.
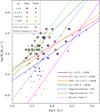 |
Fig. 22. Positions of the single (adopted from H14) and binary (this work) LMC WN sample on the log L − log Ṁ plane. The meaning of the colors and symbols are indicated as in Fig. 4; the binaries are denoted with a circle (see legend). Also shown are the WN3/O3 stars analyzed by Neugent et al. (2017). The projection of Eq. (6) onto the LMC metallicity and different hydrogen content, where there temperature is fixed to typical values per subtype, are plotted. We also plot the commonly used relations published by Nugis & Lamers (2000) for the LMC and for H-rich/free stars and the theoretical relation published by Vink (2017). |
The (almost linear) dependence of Ṁ on Z (Ṁ ∝ Z0.8) is in very good agreement with Vink & de Koter (2005), and slightly shallower than the value reported by Hainich et al. (2015). The remainder of the parameters broadly agree with those published by Hainich et al. (2015).
The relation derived has a standard deviation of about 0.3 dex (factor 2). Including systematics, this scatter σ is compatible with typical analysis errors and therefore probably reflects these errors. In Fig. 22, we also include the so-called WN3/O3 stars, analyzed by Neugent et al. (2017). It is immediately clear from Fig. 22 that these stars are outliers. Relative to their reported luminosities, they have very weak mass-loss rates, almost comparable to those of early O-type stars. It is likely that the winds of these stars obey a different relation because their winds are optically thin. Indeed, the magnitudes of their mass-loss rates agree much better with prescriptions by Vink (2017). Notably, however, the slope of the relation as a function of log L seems to be shallower empirically compared to the predicted relation.
7. Summary
This study focused on the population of WN binaries in the LMC. Through spectroscopy of these objects, our aim was to provide an unprecedented test for our understanding of the evolution and formation of WR stars at low metallicity, focusing on the role of binary nature and CHE. We conclude the following:
-
Of the 44 binary candidates investigated (out of ≈130 WN stars in the LMC), the spectra of 28 are recognized as composite and the status of BAT99 72 is uncertain. Five systems are potential SB1s (BAT99 12, 99, 105, 112, and 114), but their binary status is not certain. The binary nature of the remaining 11 binary candidates cannot be confirmed.
-
About one-third of the our sample are on, or close to, the main sequence (ms-WR), and the remainder are He-burning WR stars (cWR).
-
Notable systems include: (1) the 18 d period eclipsing WN4 + O6 V system BAT99 19, with the most rapidly rotating secondary (550 km s−1); (2) BAT99 32 and 95, which may host two WR stars in short orbit and are therefore potential evolved GW progenitors; (3) BAT99 126 (WR+O), whose light curve suggests a contact configuration in a 1.5 d orbit together with a spectroscopic period of 25 d, implying a triple configuration; and (4) BAT99 12 and 99, which appear to be X-ray bright SB1 WR binaries and may therefore be candidates for WR + compact object systems.
-
We can reject CHE for almost all OB-type companions of the WN stars, but the status of the primaries is less certain.
-
Based on our results and the BPASS grid of evolution models, 45 ± 30% of the cWR stars in binaries transferred mass to their companion (i.e., 45 ± 30% are b-WR or wb-WR stars). The very large uncertainty follows from the uncertain expansion of the WR progenitor (CHE or quasi-CHE versus standard evolution) However, only 12 ± 7% of the cWR components in binaries can be explained through binary interaction alone (12% are b-WR). Assuming that the apparently single WR stars truly formed as single stars, this amounts to an observed fraction of 4 ± 2% b-WR stars of the whole WN content in the LMC, compared to the theoretical prediction of 30−40%. A similar contradiction between the observation and theory is obtained when comparing to the Geneva evolution models (see Sect. 6.1.3).
-
Projected rotational velocities of the OB-type secondaries are found to be larger than observed for single O-type stars (typically 150−200 km s−1), but usually far from breakup (with BAT99 19, 49, and 103 as exceptions to the rule). This potentially suggests the presence of a braking mechanism of rotation, for example, through stellar winds or magnetic fields,
-
The upper end of the HRD is populated by apparently single WR stars reaching estimated current masses of ≈300 M⊙, while orbital and evolutionary masses derived for WR stars in binaries reach ≈130 M⊙, possibly implying that the most massive stars observed in the LMC are mergers.
-
Otherwise, the single WN stars and binary WN components span a similar regime on the HRD. Both the apparently single and binary WN stars down to a minimum luminosity of ≈5.2−5.3 L⊙ that is not reached by standard single-star tracks. The WN stars in binaries are not observed at lower luminosities than single WN stars on average. We conclude that either pre-WR mass loss (mainly during the red supergiant phase) or mixing are strongly underestimated in evolution codes, or that the majority of cWR stars in the LMC, which are both apparently single and binary, are products of binary interaction.
The few detailed studies performed on specific WR systems suggest that, in the long run, we will have to push for high data quality to further reduce measurement uncertainties and possible biases. Moreover, deeper multiplicity surveys will be required to determine the bias-corrected binary fraction of WR stars, and to determine whether the apparently single WR stars are truly single.
If mass loss is the primary agent that leads to the formation of WR stars in the LMC, then mass-loss rates or mixing prior to the WR phase in the mass-range 20−60 M⊙ in evolution codes such as the Geneva code, MESA, and even BPASS, are strongly underestimated. This, however, counteracts the trend of the recent decades, where mass-loss rates have been reported to be systemically lower than originally thought. If an increase of mass loss or mixing is not supported by future studies, the consequence would be that the bulk of cWR stars in the LMC would be located below the threshold for forming WR stars through self-stripping (cf. Fig. 4, right panel, and Fig. 5). It would then be difficult to imagine a solution to this problem that does not involve some sort of binary interaction. That is, we would be forced to conclude that the majority of cWR stars (apparently-single and binary) were formed through binary interaction. With evidence continuing to grow that binary interaction dominates the evolution of massive stars, this is an exciting prospect. However, extraordinary claims require extraordinary evidence, and no such evidence could be established in this work.
For example, ≈90% of the WR stars in the Galaxy are cWR stars, as can be estimated from the number of WC stars and hydrogen free/depleted WN stars – see Crowther (2007) and Hamann et al. (2019).
At low metallicity, the radiation force exerted on the stellar layers is smaller, and thus so are the stellar radii for a given initial mass and age, which in turn reduces the likelihood of binary interaction. However, this effect is negligible compared to the sensitivity of Ṁ to Z.
PoWR models of WR stars can be downloaded at www.astro.physik.uni-potsdam.de/PoWR
We use the terms disentangling and spectral separation interchangeably, regardless of whether prior knowledge of RV measurements is required.
The BONNSAI web-service is available at www.astro.uni-bonn.de/stars/bonnsai
Acknowledgments
We thank the anonymous referee for help in improving our manuscript. T.S. acknowledges support from the German Verbunsforschung (DLR) grant 50 OR 1612 and from the European Research Council (ERC) under the European Union’s DLV-772225-MULTIPLES Horizon 2020 research and innovation programme. A.A.C.S. is supported by the Deutsche Forschungsgemeinschaft (DFG) under grant HA 1455/26 and would like to thank STFC for funding under grant number ST/R000565/1. V.R. is grateful for financial support from Deutscher Akademischer Austauschdienst (DAAD), as a part of Graduate School Scholarship Program. A.M. is grateful for financial aid from NSERC (Canada) and FQRNT (Quebec). LMO acknowledges support by the DLR grant 50 OR 1508. Some of the data presented in this paper were obtained from the Mikulski Archive for Space Telescopes (MAST). STScI is operated by the Association of Universities for Research in Astronomy, Inc., under NASA contract NAS5-26555 This research made use of the VizieR catalogue access tool, CDS, Strasbourg, France. The original description of the VizieR service was published in A&AS 143, 23.
References
- Aerts, C., Bowman, D. M., Símon-Díaz, S., et al. 2018, MNRAS, 476, 1234 [NASA ADS] [CrossRef] [Google Scholar]
- Allen, C. W. 1973, Astrophysical Quantities (London: University of London, Athlone Press) [Google Scholar]
- Bagnuolo, Jr., W. G., & Gies, D. R. 1991, ApJ, 376, 266 [NASA ADS] [CrossRef] [Google Scholar]
- Bartzakos, P., Moffat, A. F. J., & Niemela, V. S. 2001, MNRAS, 324, 18 [NASA ADS] [CrossRef] [Google Scholar]
- Baum, E., Hamann, W.-R., Koesterke, L., & Wessolowski, U. 1992, A&A, 266, 402 [NASA ADS] [Google Scholar]
- Bestenlehner, J. M., Vink, J. S., Gräfener, G., et al. 2011, A&A, 530, L14 [NASA ADS] [CrossRef] [EDP Sciences] [Google Scholar]
- Bestenlehner, J. M., Gräfener, G., Vink, J. S., et al. 2014, A&A, 570, A38 [NASA ADS] [CrossRef] [EDP Sciences] [Google Scholar]
- Bonanos, A. Z., Massa, D. L., Sewilo, M., et al. 2009, AJ, 138, 1003 [NASA ADS] [CrossRef] [Google Scholar]
- Bouret, J.-C., Hillier, D. J., Lanz, T., & Fullerton, A. W. 2012, A&A, 544, A67 [NASA ADS] [CrossRef] [EDP Sciences] [Google Scholar]
- Bowman, D. M., Burssens, S., Pedersen, M. G., et al. 2019, Nat. Astron., in press, https://doi.org/10.1038/s41550-019-0768-1 [Google Scholar]
- Breysacher, J. 1981, A&AS, 43, 203 [NASA ADS] [Google Scholar]
- Breysacher, J., Azzopardi, M., & Testor, G. 1999, A&AS, 137, 117 [NASA ADS] [CrossRef] [EDP Sciences] [Google Scholar]
- Brott, I., Evans, C. J., Hunter, I., et al. 2011, A&A, 530, A116 [NASA ADS] [CrossRef] [EDP Sciences] [Google Scholar]
- Castor, J. I., Abbott, D. C., & Klein, R. I. 1975, ApJ, 195, 157 [NASA ADS] [CrossRef] [Google Scholar]
- Chené, A. N., Moffat, A. F. J., & Crowther, P. A. 2008, in Clumping in Hot-Star Winds, eds. W. R. Hamann, A. Feldmeier, & L. M. Oskinova, 163 [Google Scholar]
- Chené, A.-N., St-Louis, N., Moffat, A. F. J., et al. 2019, MNRAS, 484, 5834 [NASA ADS] [CrossRef] [Google Scholar]
- Conti, P. S. 1976, in Proc. 20th Colloq. Int. Ap. (Liége: University of Liége), 132, 193 [Google Scholar]
- Conti, P. S., & Massey, P. 1989, ApJ, 337, 251 [NASA ADS] [CrossRef] [Google Scholar]
- Cranmer, S. R., & Owocki, S. P. 1996, ApJ, 462, 469 [NASA ADS] [CrossRef] [Google Scholar]
- Crowther, P. A. 2007, ARA&A, 45, 177 [NASA ADS] [CrossRef] [Google Scholar]
- Crowther, P. A., & Dessart, L. 1998, MNRAS, 296, 622 [NASA ADS] [CrossRef] [Google Scholar]
- Crowther, P. A., & Hadfield, L. J. 2006, A&A, 449, 711 [NASA ADS] [CrossRef] [EDP Sciences] [Google Scholar]
- Crowther, P. A., & Smith, L. J. 1997, A&A, 320, 500 [NASA ADS] [Google Scholar]
- Crowther, P. A., & Walborn, N. R. 2011, MNRAS, 416, 1311 [NASA ADS] [CrossRef] [MathSciNet] [Google Scholar]
- Crowther, P. A., Smith, L. J., & Willis, A. J. 1995, A&A, 304, 269 [NASA ADS] [Google Scholar]
- Crowther, P. A., Schnurr, O., Hirschi, R., et al. 2010, MNRAS, 408, 731 [NASA ADS] [CrossRef] [Google Scholar]
- Crowther, P. A., Caballero-Nieves, S. M., Bostroem, K. A., et al. 2016, MNRAS, 458, 624 [NASA ADS] [CrossRef] [Google Scholar]
- Cutri, R. M., et al. 2012, VizieR Online Data Catalog, II/311 [Google Scholar]
- Cutri, R. M., et al. 2013, VizieR Online Data Catalog, II/328 [Google Scholar]
- Davies, B., Crowther, P. A., & Beasor, E. R. 2018, MNRAS, 478, 3138 [NASA ADS] [CrossRef] [Google Scholar]
- de Koter, A., Heap, S. R., & Hubeny, I. 1997, ApJ, 477, 792 [Google Scholar]
- de la Chevrotière, A., St-Louis, N., Moffat, A. F. J., & the MiMeS Collaboration. 2013, ApJ, 764, 171 [NASA ADS] [CrossRef] [Google Scholar]
- de la Chevrotière, A., St-Louis, N., Moffat, A. F. J., & the MiMeS Collaboration. 2014, ApJ, 781, 73 [NASA ADS] [CrossRef] [Google Scholar]
- de Mink, S. E., Cantiello, M., Langer, N., et al. 2009, A&A, 497, 243 [NASA ADS] [CrossRef] [EDP Sciences] [Google Scholar]
- de Mink, S. E., Sana, H., Langer, N., Izzard, R. G., & Schneider, F. R. N. 2014, ApJ, 782, 7 [NASA ADS] [CrossRef] [Google Scholar]
- Delmotte, N., Loup, C., Egret, D., Cioni, M.-R., & Pierfederici, F. 2002, A&A, 396, 143 [NASA ADS] [CrossRef] [EDP Sciences] [Google Scholar]
- Dessart, L., & Owocki, S. P. 2005, A&A, 432, 281 [NASA ADS] [CrossRef] [EDP Sciences] [Google Scholar]
- Doran, E. I., Crowther, P. A., de Koter, A., et al. 2013, A&A, 558, A134 [NASA ADS] [CrossRef] [EDP Sciences] [Google Scholar]
- Dufour, R. J., Shields, G. A., & Talbot, Jr., R. J. 1982, ApJ, 252, 461 [NASA ADS] [CrossRef] [Google Scholar]
- Eldridge, J. J., & Stanway, E. R. 2016, MNRAS, 462, 3302 [NASA ADS] [CrossRef] [Google Scholar]
- Eldridge, J. J., Izzard, R. G., & Tout, C. A. 2008, MNRAS, 384, 1109 [NASA ADS] [CrossRef] [Google Scholar]
- Evans, C. J., Taylor, W. D., Hénault-Brunet, V., et al. 2011, A&A, 530, A108 [NASA ADS] [CrossRef] [EDP Sciences] [Google Scholar]
- Feldmeier, A. 1995, A&A, 299, 523 [NASA ADS] [Google Scholar]
- Foellmi, C., Moffat, A. F. J., & Guerrero, M. A. 2003a, MNRAS, 338, 360 [NASA ADS] [CrossRef] [Google Scholar]
- Foellmi, C., Moffat, A. F. J., & Guerrero, M. A. 2003b, MNRAS, 338, 1025 [NASA ADS] [CrossRef] [Google Scholar]
- Foellmi, C., Moffat, A. F. J., & Marchenko, S. V. 2006, A&A, 447, 667 [NASA ADS] [CrossRef] [EDP Sciences] [Google Scholar]
- Georgy, C., Ekström, S., Hirschi, R., et al. 2015, ArXiv e-prints [arXiv:1508.04650] [Google Scholar]
- Götberg, Y., de Mink, S. E., & Groh, J. H. 2017, A&A, 608, A11 [NASA ADS] [CrossRef] [EDP Sciences] [Google Scholar]
- Graczyk, D., Soszyński, I., Poleski, R., et al. 2011, Acta Astron., 61, 103 [Google Scholar]
- Gräfener, G., & Hamann, W.-R. 2005, A&A, 432, 633 [NASA ADS] [CrossRef] [EDP Sciences] [Google Scholar]
- Gräfener, G., & Hamann, W.-R. 2008, A&A, 482, 945 [NASA ADS] [CrossRef] [EDP Sciences] [Google Scholar]
- Gräfener, G., Koesterke, L., & Hamann, W.-R. 2002, A&A, 387, 244 [NASA ADS] [CrossRef] [EDP Sciences] [Google Scholar]
- Gräfener, G., Vink, J. S., de Koter, A., & Langer, N. 2011, A&A, 535, A56 [NASA ADS] [CrossRef] [EDP Sciences] [Google Scholar]
- Gräfener, G., Owocki, S. P., & Vink, J. S. 2012, A&A, 538, A40 [NASA ADS] [CrossRef] [EDP Sciences] [Google Scholar]
- Grassitelli, L., Langer, N., Grin, N. J., et al. 2018, A&A, 614, A86 [NASA ADS] [CrossRef] [EDP Sciences] [Google Scholar]
- Gray, D. F. 1975, ApJ, 202, 148 [NASA ADS] [CrossRef] [Google Scholar]
- Groh, J. H., Oliveira, A. S., & Steiner, J. E. 2008, A&A, 485, 245 [NASA ADS] [CrossRef] [EDP Sciences] [Google Scholar]
- Groh, J. H., Meynet, G., Ekström, S., & Georgy, C. 2014, A&A, 564, A30 [NASA ADS] [CrossRef] [EDP Sciences] [Google Scholar]
- Guerrero, M. A., & Chu, Y.-H. 2008a, ApJS, 177, 216 [NASA ADS] [CrossRef] [Google Scholar]
- Guerrero, M. A., & Chu, Y.-H. 2008b, ApJS, 177, 238 [NASA ADS] [CrossRef] [Google Scholar]
- Gustafsson, B., Edvardsson, B., Eriksson, K., et al. 2008, A&A, 486, 951 [NASA ADS] [CrossRef] [EDP Sciences] [Google Scholar]
- Hadrava, P. 1995, A&AS, 114, 393 [NASA ADS] [Google Scholar]
- Hainich, R., Rühling, U., Todt, H., et al. 2014, A&A, 565, A27 [NASA ADS] [CrossRef] [EDP Sciences] [Google Scholar]
- Hainich, R., Pasemann, D., Todt, H., et al. 2015, A&A, 581, A21 [Google Scholar]
- Hainich, R., Oskinova, L. M., Shenar, T., et al. 2018, A&A, 609, A94 [NASA ADS] [CrossRef] [EDP Sciences] [Google Scholar]
- Hainich, R., Ramachandran, V., Shenar, T., et al. 2019, A&A, 621, A85 [NASA ADS] [CrossRef] [EDP Sciences] [Google Scholar]
- Hamann, W.-R., & Gräfener, G. 2004, A&A, 427, 697 [NASA ADS] [CrossRef] [EDP Sciences] [Google Scholar]
- Hamann, W.-R., & Koesterke, L. 1998, A&A, 335, 1003 [NASA ADS] [Google Scholar]
- Hamann, W.-R., Gräfener, G., & Liermann, A. 2006, A&A, 457, 1015 [NASA ADS] [CrossRef] [EDP Sciences] [Google Scholar]
- Hamann, W.-R., Gräfener, G., Liermann, A., et al. 2019, A&A, 625, A57 [NASA ADS] [CrossRef] [EDP Sciences] [Google Scholar]
- Heger, A., Langer, N., & Woosley, S. E. 2000, ApJ, 528, 368 [NASA ADS] [CrossRef] [Google Scholar]
- Higgins, E. R., & Vink, J. S. 2019, A&A, 622, A50 [NASA ADS] [CrossRef] [EDP Sciences] [Google Scholar]
- Hill, G. M., Moffat, A. F. J., St-Louis, N., & Bartzakos, P. 2000, MNRAS, 318, 402 [NASA ADS] [CrossRef] [Google Scholar]
- Hillier, D. J. 1984, ApJ, 280, 744 [NASA ADS] [CrossRef] [Google Scholar]
- Howarth, I. D. 1983, MNRAS, 203, 301 [NASA ADS] [CrossRef] [Google Scholar]
- Huenemoerder, D. P., Gayley, K. G., Hamann, W.-R., et al. 2015, ApJ, 815, 29 [NASA ADS] [CrossRef] [Google Scholar]
- Humphreys, R. M., & Davidson, K. 1979, ApJ, 232, 409 [NASA ADS] [CrossRef] [Google Scholar]
- Hunter, I., Dufton, P. L., Smartt, S. J., et al. 2007, A&A, 466, 277 [NASA ADS] [CrossRef] [EDP Sciences] [Google Scholar]
- Hurley, J. R., Tout, C. A., & Pols, O. R. 2002, MNRAS, 329, 897 [NASA ADS] [CrossRef] [Google Scholar]
- Hut, P., & Bahcall, J. N. 1983, ApJ, 268, 319 [NASA ADS] [CrossRef] [Google Scholar]
- Ignace, R., Oskinova, L. M., & Foullon, C. 2000, MNRAS, 318, 214 [NASA ADS] [CrossRef] [Google Scholar]
- Jeffery, C. S., & Hamann, W.-R. 2010, MNRAS, 404, 1698 [NASA ADS] [Google Scholar]
- Kaper, L., Henrichs, H. F., Nichols, J. S., & Telting, J. H. 1999, A&A, 344, 231 [NASA ADS] [Google Scholar]
- Kato, D., Nagashima, C., Nagayama, T., et al. 2007, PASJ, 59, 615 [NASA ADS] [Google Scholar]
- Koenigsberger, G., Moffat, A. F. J., & Auer, L. H. 2003, Rev. Mex. Astron. Astrofis., 39, 213 [NASA ADS] [Google Scholar]
- Koenigsberger, G., Morrell, N., Hillier, D. J., et al. 2014, AJ, 148, 62 [NASA ADS] [CrossRef] [Google Scholar]
- Köhler, K., Langer, N., de Koter, A., et al. 2015, A&A, 573, A71 [NASA ADS] [CrossRef] [EDP Sciences] [Google Scholar]
- Korn, A. J., Nieva, M. F., Daflon, S., & Cunha, K. 2005, ApJ, 633, 899 [Google Scholar]
- Kudritzki, R. P., Pauldrach, A., & Puls, J. 1987, A&A, 173, 293 [NASA ADS] [Google Scholar]
- Kudritzki, R. P., Pauldrach, A., Puls, J., & Abbott, D. C. 1989, A&A, 219, 205 [NASA ADS] [Google Scholar]
- Lamers, H. J. G. L. M., Snow, T. P., & Lindholm, D. M. 1995, ApJ, 455, 269 [NASA ADS] [CrossRef] [Google Scholar]
- Langer, N. 1989, A&A, 210, 93 [NASA ADS] [Google Scholar]
- Langer, N. 2012, ARA&A, 50, 107 [NASA ADS] [CrossRef] [Google Scholar]
- Larsen, S. S., Clausen, J. V., & Storm, J. 2000, A&A, 364, 455 [NASA ADS] [Google Scholar]
- Lee, J. C., Gil de Paz, A., Kennicutt, R. C., Jr., et al. 2011, ApJS, 192, 6 [NASA ADS] [CrossRef] [Google Scholar]
- Lépine, S., & Moffat, A. F. J. 1999, ApJ, 514, 909 [NASA ADS] [CrossRef] [Google Scholar]
- Lommen, D., Yungelson, L., van den Heuvel, E., Nelemans, G., & Portegies Zwart, S. 2005, A&A, 443, 231 [NASA ADS] [CrossRef] [EDP Sciences] [Google Scholar]
- Luehrs, S. 1997, PASP, 109, 504 [NASA ADS] [CrossRef] [Google Scholar]
- Maeder, A. 2002, A&A, 392, 575 [NASA ADS] [CrossRef] [EDP Sciences] [Google Scholar]
- Maeder, A., & Meynet, G. 1987, A&A, 182, 243 [NASA ADS] [Google Scholar]
- Maíz Apellániz, J., Evans, C. J., Barbá, R. H., et al. 2014, A&A, 564, A63 [NASA ADS] [CrossRef] [EDP Sciences] [Google Scholar]
- Marchant, P., Langer, N., Podsiadlowski, P., Tauris, T., & Moriya, T. 2016, A&A, 588, A50 [NASA ADS] [CrossRef] [EDP Sciences] [Google Scholar]
- Marchenko, S. V., & Moffat, A. F. J. 1998, ApJ, 499, L195 [NASA ADS] [CrossRef] [Google Scholar]
- Markova, N., & Puls, J. 2008, A&A, 478, 823 [NASA ADS] [CrossRef] [EDP Sciences] [Google Scholar]
- Martins, F., Schaerer, D., & Hillier, D. J. 2005, A&A, 436, 1049 [NASA ADS] [CrossRef] [EDP Sciences] [Google Scholar]
- Massey, P., & Hunter, D. A. 1998, ApJ, 493, 180 [NASA ADS] [CrossRef] [Google Scholar]
- Massey, P., Waterhouse, E., & DeGioia-Eastwood, K. 2000, AJ, 119, 2214 [NASA ADS] [CrossRef] [Google Scholar]
- Massey, P., Zangari, A. M., Morrell, N. I., et al. 2009, ApJ, 692, 618 [NASA ADS] [CrossRef] [Google Scholar]
- Massey, P., Neugent, K. F., Morrell, N., & Hillier, D. J. 2014, ApJ, 788, 83 [NASA ADS] [CrossRef] [Google Scholar]
- Mathys, G. 1988, A&AS, 76, 427 [NASA ADS] [Google Scholar]
- Mathys, G. 1989, A&AS, 81, 237 [NASA ADS] [Google Scholar]
- Mauron, N., & Josselin, E. 2011, A&A, 526, A156 [NASA ADS] [CrossRef] [EDP Sciences] [Google Scholar]
- Meynet, G., & Maeder, A. 2005, A&A, 429, 581 [NASA ADS] [CrossRef] [EDP Sciences] [Google Scholar]
- Meynet, G., Eggenberger, P., & Maeder, A. 2011, A&A, 525, L11 [NASA ADS] [CrossRef] [EDP Sciences] [Google Scholar]
- Moffat, A. F. J. 1989, ApJ, 347, 373 [NASA ADS] [CrossRef] [Google Scholar]
- Moffat, A. F. J. 1998, Ap&SS, 260, 225 [NASA ADS] [CrossRef] [Google Scholar]
- Moffat, A. F. J., Drissen, L., Lamontagne, R., & Robert, C. 1988, ApJ, 334, 1038 [NASA ADS] [CrossRef] [Google Scholar]
- Mokiem, M. R., de Koter, A., Vink, J. S., et al. 2007, A&A, 473, 603 [NASA ADS] [CrossRef] [EDP Sciences] [Google Scholar]
- Nascimbeni, V., Piotto, G., Ortolani, S., et al. 2016, MNRAS, 463, 4210 [Google Scholar]
- Neugent, K. F., & Massey, P. 2014, ApJ, 789, 10 [NASA ADS] [CrossRef] [EDP Sciences] [Google Scholar]
- Neugent, K. F., Massey, P., Hillier, D. J., & Morrell, N. 2017, ApJ, 841, 20 [NASA ADS] [CrossRef] [Google Scholar]
- Neugent, K. F., Massey, P., & Morrell, N. 2018, ApJ, 863, 181 [NASA ADS] [CrossRef] [Google Scholar]
- Niemela, V. S. 1991, in Wolf-Rayet Stars and Interrelations with Other Massive Stars in Galaxies, eds. K. A. van der Hucht, & B. Hidayat, IAU Symp., 143, 201 [NASA ADS] [CrossRef] [Google Scholar]
- Niemela, V. S., Seggewiss, W., & Moffat, A. F. J. 2001, A&A, 369, 544 [NASA ADS] [CrossRef] [EDP Sciences] [Google Scholar]
- Nugis, T., & Lamers, H. J. G. L. M. 2000, A&A, 360, 227 [NASA ADS] [Google Scholar]
- Nugis, T., Annuk, K., & Hirv, A. 2007, Balt. Astron., 16, 227 [NASA ADS] [Google Scholar]
- Oskinova, L. M. 2005, MNRAS, 361, 679 [NASA ADS] [CrossRef] [Google Scholar]
- Oskinova, L. M., Hamann, W.-R., & Feldmeier, A. 2007, A&A, 476, 1331 [NASA ADS] [CrossRef] [EDP Sciences] [Google Scholar]
- Oskinova, L. M., Gayley, K. G., Hamann, W.-R., et al. 2012, ApJ, 747, L25 [NASA ADS] [CrossRef] [Google Scholar]
- Owocki, S. P., Townsend, R. H. D., & Quataert, E. 2017, MNRAS, 472, 3749 [Google Scholar]
- Packet, W. 1981, A&A, 102, 17 [NASA ADS] [Google Scholar]
- Paczynski, B. 1973, in Wolf-Rayet and High-Temperature Stars, eds. M. K. V. Bappu, & J. Sahade, IAU Symp., 49, 143 [NASA ADS] [CrossRef] [Google Scholar]
- Paczynski, B. 1976, in Structure and Evolution of Close Binary Systems, eds. P. Eggleton, S. Mitton, & J. Whelan, IAU Symp., 73, 75 [NASA ADS] [CrossRef] [EDP Sciences] [Google Scholar]
- Palacios, A., Gebran, M., Josselin, E., et al. 2010, A&A, 516, A13 [NASA ADS] [CrossRef] [EDP Sciences] [Google Scholar]
- Palate, M. 2014, Ph.D. Thesis, University of Liége, Belgium [Google Scholar]
- Parker, J. W. 1992, Ph.D. Thesis, Colorado Univ., Boulder [Google Scholar]
- Pietrzyński, G., Graczyk, D., Gieren, W., et al. 2013, Nature, 495, 76 [NASA ADS] [CrossRef] [PubMed] [Google Scholar]
- Podsiadlowski, P., Joss, P. C., & Hsu, J. J. L. 1992, ApJ, 391, 246 [NASA ADS] [CrossRef] [Google Scholar]
- Pollock, A. M. T. 1995, in Wolf-Rayet Stars: Binaries; Colliding Winds; Evolution, eds. K. A. van der Hucht, & P. M. Williams, IAU Symp., 163, 429 [NASA ADS] [CrossRef] [Google Scholar]
- Pollock, A. M. T., Crowther, P. A., Tehrani, K., Broos, P. S., & Townsley, L. K. 2018, MNRAS, 474, 3228 [NASA ADS] [CrossRef] [Google Scholar]
- Popescu, B., Hanson, M. M., & Elmegreen, B. G. 2012, ApJ, 751, 122 [NASA ADS] [CrossRef] [Google Scholar]
- Prinja, R. K., & Massa, D. L. 2010, A&A, 521, L55 [Google Scholar]
- Puls, J., Vink, J. S., & Najarro, F. 2008, A&A Rev., 16, 209 [Google Scholar]
- Ramachandran, V., Hainich, R., Hamann, W.-R., et al. 2018, A&A, 609, A7 [NASA ADS] [CrossRef] [EDP Sciences] [Google Scholar]
- Ramachandran, V., Hamann, W.-R., Oskinova, L. M., et al. 2019, A&A, 625, A104 [NASA ADS] [CrossRef] [EDP Sciences] [Google Scholar]
- Ramírez-Agudelo, O. H., Simón-Díaz, S., Sana, H., et al. 2013, A&A, 560, A29 [NASA ADS] [CrossRef] [EDP Sciences] [Google Scholar]
- Ramírez-Agudelo, O. H., Sana, H., de Mink, S. E., et al. 2015, A&A, 580, A92 [NASA ADS] [CrossRef] [EDP Sciences] [Google Scholar]
- Ramírez-Agudelo, O. H., Sana, H., de Koter, A., et al. 2017, A&A, 600, A81 [NASA ADS] [CrossRef] [EDP Sciences] [Google Scholar]
- Rauw, G., De Becker, M., Nazé, Y., et al. 2004, A&A, 420, L9 [NASA ADS] [CrossRef] [EDP Sciences] [Google Scholar]
- Richardson, N. D., Gies, D. R., & Williams, S. J. 2011, AJ, 142, 201 [NASA ADS] [CrossRef] [Google Scholar]
- Ro, S. 2019, ApJ, 873, 76 [NASA ADS] [CrossRef] [Google Scholar]
- Röser, S., Schilbach, E., Schwan, H., et al. 2008, A&A, 488, 401 [NASA ADS] [CrossRef] [EDP Sciences] [Google Scholar]
- Sabín-Sanjulián, C., Simón-Díaz, S., Herrero, A., et al. 2017, A&A, 601, A79 [NASA ADS] [CrossRef] [EDP Sciences] [Google Scholar]
- Sablowski, D. P., & Weber, M. 2017, A&A, 597, A125 [NASA ADS] [CrossRef] [EDP Sciences] [Google Scholar]
- Salpeter, E. E. 1955, ApJ, 121, 161 [Google Scholar]
- Sana, H., de Mink, S. E., de Koter, A., et al. 2012, Science, 337, 444 [Google Scholar]
- Sana, H., de Koter, A., de Mink, S. E., et al. 2013, A&A, 550, A107 [NASA ADS] [CrossRef] [EDP Sciences] [Google Scholar]
- Sander, A., Todt, H., Hainich, R., & Hamann, W.-R. 2014, A&A, 563, A89 [NASA ADS] [CrossRef] [EDP Sciences] [Google Scholar]
- Sander, A., Shenar, T., Hainich, R., et al. 2015, A&A, 577, A13 [NASA ADS] [CrossRef] [EDP Sciences] [Google Scholar]
- Sander, A. A. C., Hamann, W.-R., Todt, H., Hainich, R., & Shenar, T. 2017, A&A, 603, A86 [NASA ADS] [CrossRef] [EDP Sciences] [Google Scholar]
- Sander, A. A. C., Hamann, W.-R., Todt, H., et al. 2019, A&A, 621, A92 [NASA ADS] [CrossRef] [EDP Sciences] [Google Scholar]
- Sanyal, D., Grassitelli, L., Langer, N., & Bestenlehner, J. M. 2015, A&A, 580, A20 [NASA ADS] [CrossRef] [EDP Sciences] [Google Scholar]
- Schmutz, W., Hamann, W.-R., & Wessolowski, U. 1989, A&A, 210, 236 [NASA ADS] [Google Scholar]
- Schneider, F. R. N., Langer, N., de Koter, A., et al. 2014, A&A, 570, A66 [NASA ADS] [CrossRef] [EDP Sciences] [Google Scholar]
- Schnurr, O., Moffat, A. F. J., St-Louis, N., Morrell, N. I., & Guerrero, M. A. 2008, MNRAS, 389, 806 [NASA ADS] [CrossRef] [Google Scholar]
- Schnurr, O., Chené, A.-N., Casoli, J., Moffat, A. F. J., & St-Louis, N. 2009, MNRAS, 397, 2049 [NASA ADS] [CrossRef] [Google Scholar]
- Schootemeijer, A., & Langer, N. 2018, A&A, 611, A75 [NASA ADS] [CrossRef] [EDP Sciences] [Google Scholar]
- Schootemeijer, A., Langer, N., Grin, N. J., & Wang, C. 2019, A&A, 625, A132 [NASA ADS] [CrossRef] [EDP Sciences] [Google Scholar]
- Seaton, M. J. 1979, MNRAS, 187, 73P [NASA ADS] [CrossRef] [Google Scholar]
- Seggewiss, W., Moffat, A. F. J., & Lamontagne, R. 1991, A&AS, 89, 105 [NASA ADS] [Google Scholar]
- Shara, M. M., Crawford, S. M., Vanbeveren, D., et al. 2017, MNRAS, 464, 2066 [NASA ADS] [CrossRef] [Google Scholar]
- Shenar, T., Hamann, W.-R., & Todt, H. 2014, A&A, 562, A118 [NASA ADS] [CrossRef] [EDP Sciences] [Google Scholar]
- Shenar, T., Oskinova, L., Hamann, W.-R., et al. 2015, ApJ, 809, 135 [NASA ADS] [CrossRef] [Google Scholar]
- Shenar, T., Hainich, R., Todt, H., et al. 2016, A&A, 591, A22 [NASA ADS] [CrossRef] [EDP Sciences] [Google Scholar]
- Shenar, T., Richardson, N. D., Sablowski, D. P., et al. 2017, A&A, 598, A85 [NASA ADS] [CrossRef] [EDP Sciences] [Google Scholar]
- Shenar, T., Hainich, R., Todt, H., et al. 2018, A&A, 616, A103 [NASA ADS] [CrossRef] [EDP Sciences] [Google Scholar]
- Simón-Díaz, S., Herrero, A., Uytterhoeven, K., et al. 2010, ApJ, 720, L174 [NASA ADS] [CrossRef] [Google Scholar]
- Skinner, S. L., Zhekov, S. A., Güdel, M., Schmutz, W., & Sokal, K. R. 2012, AJ, 143, 116 [NASA ADS] [CrossRef] [Google Scholar]
- Smith, N. 2014, ARA&A, 52, 487 [NASA ADS] [CrossRef] [MathSciNet] [Google Scholar]
- Smith, L. F., Shara, M. M., & Moffat, A. F. J. 1996, MNRAS, 281, 163 [NASA ADS] [CrossRef] [Google Scholar]
- Smith, R. C., Points, S., Chu, Y. H., et al. 2005, in American Astronomical Society Meeting Abstracts, Bull. Am. Astron. Soc., 37, 145.01 [Google Scholar]
- Smith, N., Götberg, Y., & de Mink, S. E. 2018, MNRAS, 475, 772 [NASA ADS] [CrossRef] [Google Scholar]
- Song, H. F., Meynet, G., Maeder, A., Ekström, S., & Eggenberger, P. 2016, A&A, 585, A120 [NASA ADS] [CrossRef] [EDP Sciences] [Google Scholar]
- St-Louis, N., Chené, A.-N., Schnurr, O., & Nicol, M.-H. 2009, ApJ, 698, 1951 [NASA ADS] [CrossRef] [Google Scholar]
- Steiner, J. E., & Oliveira, A. S. 2005, A&A, 444, 895 [NASA ADS] [CrossRef] [EDP Sciences] [Google Scholar]
- Sundqvist, J. O., & Owocki, S. P. 2013, MNRAS, 428, 1837 [NASA ADS] [CrossRef] [Google Scholar]
- Sundqvist, J. O., Puls, J., Feldmeier, A., & Owocki, S. P. 2011, A&A, 528, A64 [NASA ADS] [CrossRef] [EDP Sciences] [Google Scholar]
- Šurlan, B., Hamann, W.-R., Aret, A., et al. 2013, A&A, 559, A130 [NASA ADS] [CrossRef] [EDP Sciences] [Google Scholar]
- Szécsi, D., Langer, N., Yoon, S.-C., et al. 2015, A&A, 581, A15 [NASA ADS] [CrossRef] [EDP Sciences] [Google Scholar]
- Taylor, W. D., Evans, C. J., Sana, H., et al. 2011, A&A, 530, L10 [NASA ADS] [CrossRef] [EDP Sciences] [Google Scholar]
- Tehrani, K. A., Crowther, P. A., Bestenlehner, J. M., et al. 2019, MNRAS, 484, 2692 [NASA ADS] [CrossRef] [Google Scholar]
- Testor, G., & Niemela, V. 1998, A&AS, 130, 527 [NASA ADS] [CrossRef] [EDP Sciences] [Google Scholar]
- Todt, H., Sander, A., Hainich, R., et al. 2015, A&A, 579, A75 [NASA ADS] [CrossRef] [EDP Sciences] [Google Scholar]
- Toonen, S., Hamers, A., & Portegies Zwart, S. 2016, Comput. Astrophys. Cosmol., 3, 6 [CrossRef] [Google Scholar]
- Torres-Dodgen, A. V., & Massey, P. 1988, AJ, 96, 1076 [NASA ADS] [CrossRef] [Google Scholar]
- Townsley, L. K., Broos, P. S., Feigelson, E. D., Garmire, G. P., & Getman, K. V. 2006, AJ, 131, 2164 [NASA ADS] [CrossRef] [Google Scholar]
- Tramper, F., Straal, S. M., Sanyal, D., et al. 2015, A&A, 581, A110 [NASA ADS] [CrossRef] [EDP Sciences] [Google Scholar]
- Trundle, C., Dufton, P. L., Hunter, I., et al. 2007, A&A, 471, 625 [NASA ADS] [CrossRef] [EDP Sciences] [Google Scholar]
- Ulaczyk, K., Szymański, M. K., Udalski, A., et al. 2012, Acta Astron., 62, 247 [NASA ADS] [Google Scholar]
- van den Heuvel, E. P. J., Portegies Zwart, S. F., & de Mink, S. E. 2017, MNRAS, 471, 4256 [NASA ADS] [CrossRef] [Google Scholar]
- van der Hucht, K. A. 2001, New A Rev., 45, 135 [CrossRef] [Google Scholar]
- van Loon, J. T., Cioni, M.-R. L., Zijlstra, A. A., & Loup, C. 2005, A&A, 438, 273 [NASA ADS] [CrossRef] [EDP Sciences] [Google Scholar]
- Vanbeveren, D., De Donder, E., Van Bever, J., Van Rensbergen, W., & De Loore, C. 1998a, New A, 3, 443 [NASA ADS] [CrossRef] [Google Scholar]
- Vanbeveren, D., De Loore, C., & Van Rensbergen, W. 1998b, A&A Rev., 9, 63 [NASA ADS] [CrossRef] [Google Scholar]
- Vanbeveren, D., Mennekens, N., Shara, M. M., & Moffat, A. F. J. 2018, A&A, 615, A65 [NASA ADS] [CrossRef] [EDP Sciences] [Google Scholar]
- Vink, J. S. 2017, A&A, 607, L8 [NASA ADS] [CrossRef] [EDP Sciences] [Google Scholar]
- Vink, J. S., & de Koter, A. 2005, A&A, 442, 587 [NASA ADS] [CrossRef] [EDP Sciences] [Google Scholar]
- Vink, J. S., de Koter, A., & Lamers, H. J. G. L. M. 2001, A&A, 369, 574 [NASA ADS] [CrossRef] [EDP Sciences] [Google Scholar]
- von Zeipel, H. 1924, MNRAS, 84, 665 [NASA ADS] [CrossRef] [Google Scholar]
- Walborn, N. R. 1977, ApJ, 215, 53 [NASA ADS] [CrossRef] [Google Scholar]
- Walborn, N. R., & Fitzpatrick, E. L. 1990, PASP, 102, 379 [NASA ADS] [CrossRef] [Google Scholar]
- Walborn, N. R., Drissen, L., Parker, J. W., et al. 1999, AJ, 118, 1684 [NASA ADS] [CrossRef] [Google Scholar]
- Walborn, N. R., Howarth, I. D., Lennon, D. J., et al. 2002, AJ, 123, 2754 [NASA ADS] [CrossRef] [Google Scholar]
- Wang, L., Gies, D. R., & Peters, G. J. 2018, ApJ, 853, 156 [NASA ADS] [CrossRef] [Google Scholar]
- Wilson, R. E. 1990, ApJ, 356, 613 [NASA ADS] [CrossRef] [Google Scholar]
- Woosley, S. E., Heger, A., & Weaver, T. A. 2002, Rev. Mod. Phys., 74, 1015 [NASA ADS] [CrossRef] [Google Scholar]
- Wyrzykowski, L., Udalski, A., Kubiak, M., et al. 2003, Acta Astron., 53, 1 [NASA ADS] [CrossRef] [Google Scholar]
- Zacharias, N., Monet, D. G., Levine, S. E., et al. 2005, VizieR Online Data Catalog, I/297 [Google Scholar]
- Zaritsky, D., Harris, J., Thompson, I. B., & Grebel, E. K. 2004, AJ, 128, 1606 [NASA ADS] [CrossRef] [Google Scholar]
- Zasche, P., Wolf, M., Vraštil, J., Pilarčík, L., & Juryšek, J. 2016, A&A, 590, A85 [NASA ADS] [CrossRef] [EDP Sciences] [Google Scholar]
- Zucker, S. 2003, MNRAS, 342, 1291 [Google Scholar]
- Zucker, S., & Mazeh, T. 1994, ApJ, 420, 806 [NASA ADS] [CrossRef] [EDP Sciences] [MathSciNet] [Google Scholar]
Appendix A: Comments on individual targets
In the few paragraphs below, we give a short overview on each system, and discuss specific issues related to their analysis.
BAT99 6 was originally classified as O6-7 + WN5-6 by Walborn (1977). This ≈2.0 d period binary system (Sk −67° 18) was reclassified as O3 f*+O by Niemela et al. (2001). The latter authors suggested that the system is composed of four stars owing to the presence of a second period of 19 d in the RVs of the He I absorption lines. In contrast, Koenigsberger et al. (2003) showed that the flux level of the available IUE spectra is not consistent with more than two luminous massive stars in the system. Moreover, the light curve published by Niemela et al. (2001) is suggestive of a contact configuration, making BAT99 6 a potential candidate for a GW progenitor. This is in line with the relatively high projected rotational velocity measured for the primary (250 km s−1).
While the available FEROS spectra are indeed indicative of more than two sources contributing to the spectra, they do not enable us to conclude this unambiguously, let alone to derive their parameters. Therefore, we analyzed the system as a binary. The results for the primary (WR) component should be reliable, while the results for the secondary should be taken with caution, since it might be representative of further sources in the spectrum. For example, to avoid a saturated P-Cygni C IV profile in the UV, the mass-loss rate of the secondary was fixed to a value that is much smaller than expected for its spectral type. This is possibly due to further sources present in the system.
Since the primary exhibits a P Cygni Hβ profile, and given the slight dominance of the N IV over the N III emission, we reclassified the primary as O3 If*/WN7, following morphological scheme by Crowther & Walborn (2011). A classification of the model spectrum for the secondary implies the spectral class O7 V. Motivated by Niemela et al. (2001), we classified the system therefore as (O3 If*/WN7 + OB) + (O7 V + ?).
The source was observed and detected by the XMM-Newton X-ray observatory. According to the XMM-Newton Serendipitous Source Catalog (3XMM DR8 Version), the observed flux in 0.2–12 keV band is FX ≈ 7 × 10⁻¹⁵ erg cm−2 s−1. At the LMC distance, the X-ray luminosity corrected for the ISM reddening is LX ≈ 3 × 1033 erg s−1. We suggest that BAT99 6 is a colliding wind binary, where the copious X-rays are produced by the collision of the winds of the two components. The X-ray luminosity of BAT99 6 is rather high compared to other colliding wind binaries (e.g., Oskinova 2005), but still not as high as expected in the case of accreting compact objects.
Our results suggest that the primary in the system is on (or close to) the main sequence, i.e., it is a ms-WR star. The HRD position of the secondary does not support its CHE (see rightmost panel of Fig. A.1). However, we cannot rule out CHE for the primary. We caution that our results may be biased by the presence of further components in the system, which are not accounted for in this work. Because of the complexity of this system (potentially high-order multiplicity, contact configuration), it is very likely that the BPASS models are too simplistic. We encourage further dedicated studies of this important system.
BAT99 12 was classified as O2 If*/WN5 (Crowther & Walborn 2011). This star was reported by S08 to exhibit a period of ≈3.2 d, where K1 = 80 km s−1 and e = 0.34, and was thus considered a confirmed binary by H14. However, upon careful examination of the high quality UVES (see Fig. A.2) and HST spectra at hand, no spectral features are found which can be associated with a companion. The observed spectra are very well reproduced by a single component (Doran et al. 2013; Hainich et al. 2014).
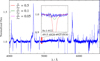 |
Fig. A.2. UVES observation of BAT99 12 (blue line). A zoom-in on a promd He I also includes models for T = 20 kK dwarfs (log g = 4.0 [cgs]), which are diluted to 50%, 10%, and 5% (red, green, and pink lines, respectively). The models assume a typical rotation of 100 km s−1. No features corresponding to a late-type massive secondary can be spotted. |
The RVs derive in this study from the CTIO spectra are consistent within 3σ with constant RV, and we cannot confirm the marginal period derived by S08. If this object truly is a binary with a period of P = 3.2 d, it must be seen at a very low inclination or exhibit a mass ratio far from unity. If there is a companion in this system, it either exhibits a very similar spectrum or contributes weakly to the total light. The mass function of the system (f = 0.17 M⊙) implies that, for a primary mass ≳40 M⊙, as is expected for its spectral type, the secondary would need to be massive (M2 ≳ 6 M⊙). However, we can rule out the presence of a late-type massive star contributing more than ≈5% to the total light, as illustrated in Fig. A.2. This results in implausible low luminosities for a secondary.
We conclude that this object is likely a single star, and that the RV scatter observed for it in the He IIλ4686 may be a result of periodic activity intrinsic to the star, for example, via corotating interaction regions (CIRs; Cranmer & Owocki 1996; Kaper et al. 1999; St-Louis et al. 2009). We cannot reject the possibility that the object is a WR binary hosting a compact object, presumably a BH.
BAT99 14 was classified by FMG03 as WN4o(+OB) because of the presence of absorption lines in its spectrum. Despite the binary appearance, these authors could not measure significant RV shifts, and associated the OB-type component in the spectrum with a visual companion situated roughly 6″ from the WR star. However, photometry obtained for BAT99 14 suggests it is contaminated by the presence of a cool and luminous K-type supergiant, (see Fig B.2). This is clearly the visual companion referred to by FMG03, which is seen as a very bright source in photos taken in optical surveys such as DSS2. Moreover, in images obtained through the GALEX UV survey (Lee et al. 2011), the dominant visual companion is no longer seen in the UV, as is expected for a K-type star. Instead, the presence of another source becomes evident that is only vaguely seen in visual images. This could potentially be the OB-type companion that contaminates the spectrum, which would suggest BAT99 14 is a not a close binary system. Future spectroscopy campaigns involving BAT99 14 should attempt to resolve this system.
We fit the photometry of the system using three components: a WR model, an O-type model, and a K-type model. For the K star, we used a synthetic MARCS spectrum calculated for MK-type stars (Gustafsson et al. 2008), retrieved from the POLLUX archive (Palacios et al. 2010). The best fit to the SED is obtained for T3 = 4200 K, and, at the distance of the LMC, log L3 = 5.4 [L⊙] and an absolute visual magnitude of MV, 3 = −7.9 mag. Based on calibrations by Allen (1973) 9, this magnitude is potentially too bright for a K-type star. We therefore suggest that the tertiary K star is in fact a line-of-sight contamination with a Galactic K star.
The spectra at hand are not contaminated by the bright K-type star, as we carefully checked. Without a spectrum for this star, we cannot classify it, but calibrations of T* and log L by Allen (1973) suggested it is a K4 I star. In the spectra, clear He I,II absorption features can be seen, which enable an approximate derivation of the temperature (T2 = 33 kK) and light ratio of the secondary. The gravity cannot be accurately determined from the spectra, but log g = 4.0 ± 0.3 [cgs] provides a satisfactory fit and is consistent with the derived luminosity of the secondary. Based on the UV data, some constraints for the wind parameters of the secondary were derived. Classification of the synthetic spectrum of the secondary gives a spectral type of O9 V.
The HRD position of the WR primary is not reached by the single-star BPASS tracks. Since no period could be derived for this system by FMG03, we cannot derive a binary evolution model from the BPASS grid. However, given its HRD position, we classified the primary as a b-WR star. More observations will be necessary to conclude whether the components of BAT99 14 are close enough to have interacted in the past.
BAT99 17 was never before reported as a binary candidate and the RVs derived by FMG03 were reported to be consistent with a single star. However, the spectrum of this object shows clear He I absorption lines that cannot originate from the hot WR primary. We believe that this is strong evidence for the presence of a cooler companion star in the spectrum. With the spectra at hand, only an estimation of the parameters of the secondary are possible. No He II lines can be seen, suggesting that the secondary is a late-type massive star with T* ≤ 30 kK. Lower temperatures give rise to N II and other low-ionization lines that are not observed. The relative faintness of the secondary suggests that it is a main-sequence star. More data will be necessary to determine whether this system forms a spectroscopic binary, and whether it has undergone interaction in the past. Based on our results, we classified it as w/wb-WR.
BAT99 19 is an eclipsing binary system with a period of P = 18.0 d, originally classified as WN4b + OB? by Smith et al. (1996), later revised to WN4b + O5: by FMG03. Very recently, Zasche et al. (2016) performed a light curve analysis of the system to derive several physical and orbital parameters. However, their derived temperature for the secondary (T2 ≈ 26 kK) is not compatible at all with the spectral type of the secondary, and their implausible results, as they admit themselves, are very likely biased by the simplistic assumptions made in their work. However, their work confirmed that the inclination of the system must be very close to i = 90°.
In this study, we profited strongly from available FLAMES spectra, which offer phase coverage of the system. These spectra enabled us to derive an SB2 orbital solution for the system and disentangle the composite spectra in the spectral range 3960−4550 Å. The results are shown in Sects. 4.2 and 4.3. A classification of the disentangled spectrum implies a spectral type of O6 V for the secondary, which is consistent with its derived stellar parameters (T* = 40 kK, log g = 4.0 [cgs]). Its luminosity is found to be lower than expected for an O6 V type by about 0.2 dex (Martins et al. 2005).
Peculiarly, the emission lines of the primary WR star are unusually round, which has led previous studies to suggest that such WR stars may be rapid rotators themselves (Hamann et al. 2006; Shenar et al. 2014). Retaining the round profiles in the models is only possible when adopting substantial surface rotation velocities comparable to that of the secondary (≈600 km s−1), and more importantly, large corotation radii that reach up to r ≈ 5 R*. Either way, the spectrum implies a terminal velocity of at least 2300 km s−1. The possibility of strong magnetic fields supporting such corotation was thoroughly discussed by Shenar et al. (2014). These fields were not yet measured in WR stars (de la Chevrotière et al. 2013, 2014; Chené et al. 2019). The question as to the potential rotation of the WR component remains open until more data are available. At any rate, the assumption of rapid rotation of the WR star does not alter our main results regarding this system, which should be subject to more studies in the future.
The best evolutionary fit to all parameters, including the orbital masses, is obtained when assuming nonhomogeneous evolution and hence past mass transfer (Fig. A.3). However, as for BAT99 6, we cannot rule out CHE (Fig. A.3). The rapid rotation of the secondary strongly suggests that it accreted mass in the past, but it may also support its homogeneous evolution. The HRD position of the primary suggests that it was massive enough to have been formed as a single star, and we therefore classified it as w/wb-WR.
A particularly interesting fact in this system is the very rapid rotation measured for the secondary, i.e., v sin i ≈ 550 km s−1, which is much larger than the orbitally synchronized rotation of ≈20 km s−1. This could be a very strong indication that mass transfer had occurred in this system in the recent past (e.g., Shara et al. 2017).
BAT99 21. This object was classified as WN4 + OB by Breysacher (1981), and later reclassified as WN4o + OB by FMG03. While FMG03 detected marginal RV variations, they could not infer a period. Since BAT99 21 has a known visual companion located at an angular separation of 2″ the latter authors concluded that BAT99 21 is likely not a short period binary but rather a visual one. However, the visual OB companion dominates in the optical and therefore biased previous derivations of the WR component’s parameters.
The FMG03 study suggested that the atmosphere of the primary is hydrogen free. This is confirmed by our modelling efforts. The absorption features of the secondary are clearly apparent in the co-added optical spectrum. Because H14 neglected the dominant companion in their analysis, the WR primary was found to be significantly more luminous (by ≈0.6 dex) than reported in this study. A classification of the model spectrum suggests the secondary is an O9 III star.
Similar to BAT99 14, although the presence of two components in its spectrum is clear, no period could be derived by FMG03, with only marginal σRV reported. Therefore, it is not known whether BAT99 21 is an interacting binary. Since the HRD position of the primary is covered by the Mi = 35 M⊙ single-star BPASS tracks, we classified it as w/wb-WR.
BAT99 27 was reported by FMG03 to be a visual binary, with the WR primary strongly diluted by its B supergiant companion. FMG03 classified this system as WN5b(+B1 Ia) and argued that the two stars likely do not form a close binary. Neugent et al. (2018) reclassified the system to WN4 + B I. While some evidence for sinusoidal RV variations was found in the system, no strict periodicity could be inferred. The relative contribution of the B component was estimated from the relative strengths of the N Vλλ1239, 1243 resonance doublet and He I lines in the optical, as well as from an estimation of the amount of dilution compared to single WR stars of similar physical parameters. In this work, we find that the composite spectrum of the system can be well reproduced assuming a WR and a B-supergiant component. Our tests also show that it could be easy for an O-type spectrum to “hide” in the low resolution optical spectrum at hand. Although the WR companion was suggested to have peculiarly round emission lines, which may imply wind corotation (H14 Shenar et al. 2014), we did not find a notable discrepancy between our standard nonrotating models and the observations. Accounting for the B supergiant reduces the luminosity of the WR star to log L = 5.8 [L⊙], more than 1 dex compared to H14.
If the WR primary has interacted with a companion in the past, the companion is very unlikely to be the B1 Ia star observed in the spectrum. Given the lack of additional confirmed components, the HRD position of the WR primary, and the lack of evidence for additional stripping (other than wind-stripping), we classified the primary as w-WR.
BAT99 29 is a confirmed WN4b + OB binary with a 2.2 d period (FMG03), later reclassified to WN3 + OB by Neugent et al. (2018). As already argued by H14, the secondary is much fainter than the primary in the optical. The secondary is clearly seen in a few He I lines, primarily λ4471. Judging by the amount of dilution and the strengths of its He I lines, it contributes roughly 20% to the total light of the system. Our synthetic spectrum suggests a spectral type of B1 V for the secondary.
Adopting a typical mass for the secondary (9 M⊙) and an inclination of 57° (Table 3) implies a peculiarly large mass for the primary (90 M⊙), which in turn suggests that the adopted mass for the secondary is wrong. Therefore, deriving an evolutionary channel for this system is somewhat speculative. Nevertheless, given the proximity of the companions, it is very likely that they interacted. The best-fitting BPASS binary track is shown in Fig. A.5. Based on its HRD position, we classified the WR primary as wb-WR.
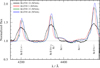 |
Fig. A.4. Comparison between the disentangled spectrum of BAT99 19 and observed spectra of BAT99 3, 15, and 48 (see legend). Despite their identical spectral type (WN4b), BAT99 19 shows peculiarly broad and round lines. |
BAT99 31 was classified as WN3b by Smith et al. (1996), was later reclassified WN4b by FMG03, and later reclassified yet again to WN3 (Neugent et al. 2018). The phase coverage of this system in the latter study was poor and, except for one data point, the RVs are consistent with BAT99 31 being a single WR star. This is supported by the FLAMES spectra at hand, which show no sign for RV shifts. Moreover, no traces of a second companion can be seen in the spectrum of the star. Some diffuse X-ray emission in the system was reported by FMG03, but the origin of this emission does not seem to be related to a binary companion, which cannot be confirmed in this study. We therefore omitted it from our analysis.
BAT99 32 was classified as WN6(h) in the original BAT99 catalog, later confirmed by S08. S08 were able to confirm a period of P = 1.9 d, making it the WN binary with the shortest period in the LMC. However, S08 were not able to infer the spectral type of the secondary from their spectra.
The CTIO spectra at hand allowed us to disentangle the optical spectrum of BAT99 32 (see Fig. 7). However, the small number of spectra do not allow us to perform the disentanglement unambiguously. Moreover, our results suggest that the system comprises three components: two emission-line stars and one absorption-line star. With only five spectra at hand, the disentangled spectra should be taken with caution. In this study, we analyzed the object as a WR + WR binary.
Since FMG03 have a much better phase coverage of the system, we adopted their orbital parameters. However, the secondary semi-amplitude K2 could not be derived by FMG03, and is therefore adopted from the disentanglement procedure. This results in very low minimum masses of 2.4 M⊙ for both components. This could only be compensated for by an inclination of i ≈ 20° or smaller. However, better data would be necessary to constrain better the orbital parameters of the system.
From the disentangled spectra, we can derive approximate temperatures for the primary and secondary, of which the latter are some 15kK hotter than the former. The light ratio in this system was very difficult to derive because unique features that belong to the primary (e.g., N IVλ4060) or to the secondary (e.g., N IIIλλ4634, 4641) are sensitive to the mass-loss rates. Moreover, the possible presence of a “step” in the saturated resonance P-Cygni line C IV in the UV is ambiguous owing to neighboring iron lines. Therefore, the light ratios were determined primarily by calibrating the combined models with lines that typically show a global EW, such as the N IVλ4060 line. Clear emission excess in lines such as Hδ and He Iλ5875 stemming from WWC can be seen (cf., Shenar et al. 2017). Based on our models, we reclassified the system to WN5(h) + WN6(h):(+abs).
Given that BAT99 32 is not only the shortest period WR binary in the LMC, but also potentially contains two WR stars as companions, we suggest that this system should be carefully observed and studied in the future. The system may be a promising candidate for an evolved GW progenitor undergoing CHE. Only a scenario in which both components evolve via CHE can provide a consistent fit to the derived parameters (Fig. A.6). However, considering the contradictory results found in this study (e.g., implausibly low orbital masses), we prefer to not overspeculate until the necessary data becomes available, and we therefore do not give an evolutionary solution to this system.
BAT99 36 was classified as WN4b/WCE by Smith et al. (1996), confirmed by FMG03. Recently, it was reclassified again to WN4b/WCE+OB by Neugent et al. (2018). Crowther et al. (1995) already argued that faint traces of a secondary companion may be seen on top of the Balmer lines in the optical spectrum of the object. However, the lack of observed RV variation make BAT99 36 consistent with being a single star (FMG03). While very faint traces for a companion are potentially seen in the spectrum, the quality of the data do not enable us to analyze the system unambiguously. We therefore omit it from our analysis.
BAT99 40 was originally classified as WN4o + O in the BAT99 catalog because of seemingly strong absorption features in the spectrum. The FMG03 study later reported a rather high X-ray luminosity of LX ≈ 5 × 1033 erg s−1, which could suggest the presence of colliding winds. However, the RV scatter reported for the object is consistent with it being a single star. Moreover, FMG03 reclassified the object to WN4(h)a, suggesting that the absorption features are blueshifted (P-Cygni like) and thus intrinsic to the WR star. This claim can be confirmed by our study. The object is therefore omitted from our sample.
BAT99 42 is a known visual binary classified as WN5b(h) + B3 I (e.g., Smith et al. 1996). A quick inspection of the spectrum of this system reveals very weak emission lines, which implies a strong dilution of the WR star. Seggewiss et al. (1991) reported a photometric variability of the system with a period of P ≈ 30 d, but no spectroscopic counterpart at this period is reported by FMG03. A high X-ray luminosity of LX ≈ 5 × 1034 erg s−1 was reported for the system by FMG03, which could potentially arise from the presence of colliding winds. Based on more recent HST images, H14 showed that the slit FMG03 used to acquire their spectra, which are used in this study, included at least three dominant sources. However, the spectra at hand do not allow for a disentanglement of these three sources. Instead, we treated the system as a WR+B-supergiant binary for the spectral analysis. Since the WR star is accompanied by more than one close OB companion on the sky and it is not obvious which one of these participates in a close orbit with the WR star, the parameters derived for the companion, especially its luminosity, should be taken with caution.
The relative contribution of the WR star was derived based on the strength of the Balmer lines and on diagnostic He I lines in the spectrum. The N V resonance line in the UV, stemming solely from the WR star, also helped to constrain the relative light ratio of the components. The lack of apparent He II lines and the SED of the system implies that the secondary is cool. The temperature derived in this work for the WR component is comparable to that derived by H14. In contrast, when accounting for the secondary companion, the luminosity of the WR star drops by about 2 dex compared to the very high luminosity of log L ≈ 8 [L⊙] reported by H14. While still high, the luminosity derived in this study is in line with other hydrogen rich stars of similar spectral types. Because H14 neglected the dilution caused by the B supergiant, the transformed radius is almost an order of magnitude smaller in this study. The discrepancy in the mass-loss rate compared to H14 is less extreme owing to the counteracting correlations Ṁ ∝ L1/3 and  .
.
The WR component in the system has a unique round-shaped emission profile that is reminiscent of rotation profiles. Therefore, H14 adopted v sin i ≈ 2000 km s−1 to reproduce it. Since such a high value implies very large corotation radii (see Shenar et al. 2014), we do not assume this rotation, hence the larger terminal velocity derived in this study. However, we note that the models cannot fully reproduce the round shape of the He IIλ4686 line using the standard β-law.
More data would be needed to derive a consistent evolutionary model for the system. Given the high luminosity of the primary and the current lack of evidence pointing toward a close, interacting companion, we classified the WR primary as w-WR.
BAT99 43 was classified as WN4o + OB by FMG03, who detected a very short period of P = 2.8 d for this binary, and later to WN3 + OB by Neugent et al. (2018). We can confirm the presence of an O-type star in the spectrum, which is most clearly apparent in faint He I lines. The temperature and light ratios were roughly estimated from the overall strength of these lines compared to that of He II lines. As reported by H14, the companion does not dominate in the optical, although it does contribute a non-negligible amount of flux, with an estimated ratio of FV, O/FV, WR = 0.7. As a result, the luminosity derived in this study for the WR star is ≈0.15 dex lower, while the effective temperature is ≈10 kK higher than derived by H14.
We cannot conclusively derive an evolutionary channel for the system. Since the binary fit fails to reach a hydrogen-free phase at the observed position, and given the short period of the system, it is possible that both components experience CHE. Since the primary is massive enough to become a WR star as a single star, we classified it as w-WR.
BAT99 47 was originally classified as WN3 in the Brey81 catalog, later updated to WN3b by FMG03. A substantial X-ray luminosity (log LX ≈ 33.6 [erg s−1]) was reported by Guerrero & Chu (2008b), which led H14 to treat BAT99 47 as a binary candidate. However, the object’s RVs are fully consistent with being single, and no traces for a companion can be seen in the available spectra. We thus omitted BAT99 47 from our analysis sample.
BAT99 49 was first confirmed as a binary by Niemela (1991), who reported a period of P = 33.9 d for the system. It was later classified by FMG03 as WN4:b + O8 V. Clear He I absorption features are apparent in the spectrum. With only N V emission features apparent in the optical spectrum, a high temperature (≈100 kK) is implied for the WR star, suggesting that the companion is responsible for the He I absorption features. Several He II absorption features can also be unambiguously attributed to the secondary, constraining its temperature. The light ratio was determined from the overall strength of the He I, II, and Balmer lines.
The UV observations do not reveal a significant P-Cygni signature of the C IV resonance line. To suppress this line in the O-star model, a rather low mass-loss rate and standard X-ray emission were needed. This results in an absorption in the Balmer lines that is too strong, especially in Hα. We suspect that these lines are contaminated by nebular emission, hence the apparent discrepancy. A classification of the model spectrum results results in the spectral type O8 V.
As illustrated in Fig. 18, the BPASS tracks strongly suggest that the system experienced mass transfer in the past. The CHE tracks (both for the primary alone and for both components) completely fail to reproduce the properties of the system (middle and right panels of Fig. 18). According to our solution, the WR primary could only form through binary interaction, and we classified it as b-WR.
BAT99 59 was classified as a binary (WN4 + OB) in the original Brey81 catalog, based on clear absorption features apparent on top of the combined Balmer+Pickering emission lines. The companion was presumed to be a B-type star by Smith et al. (1996). The FMG03 work reclassified the system to WN4b + O8 and reported marginal evidence for a periodic RV signal with a period of P ≈ 4.7 d, with the RV amplitude of the WR star comparable to their detection limit (≈30 km s−1). Finally, the system was classified as WN3 + OB by Neugent et al. (2018).
The light ratio can be estimated from the relative strengths of the Balmer absorption lines and temperature-insensitive lines such as the C III line complex at λ ≈ 1170 Å. The temperature of the WR star is well constrained by the presence of the N IVλ4060 and N Vλλ4604, 4620 doublet. The temperature of the secondary is constrained from the presence of He I absorption lines, and He II absorption features overlaid on the He II emission. The low resolution of the spectra only allow for a rough estimate of the surface gravity and rotation velocity of the secondary. Based on its synthetic spectrum, we classified the secondary as O6.5 III.
Evolution-wise, we cannot statistically discern between past mass transfer and the primary undergoing CHE (Fig. A.8), although we can rule out that the secondary evolved via CHE, making the CHE channel less likely overall. Given our solution, we classified the WR star as wb-WR.
BAT99 60 was classified by Breysacher (1981) as WN3 + OB based on absorption features in the spectrum, but this classification was rejected by FMG03; these authors reclassified it as WN4(h)a, claiming that the absorption originated in the WR star. Furthermore, the RVs derived by FMG03 are consistent with a single star. Therefore, this object was not considered a binary candidate by H14. However, upon inspection of the spectrum, it is obvious that absorption lines belonging to He I cannot originate in the hot WR star. This is supported by the recent assignment of the spectral type WN3 + OB by Neugent et al. (2018). The presence of a second, cooler star is thus evident from the spectrum, and we therefore include this target in our sample. With only one epoch, the analysis can only be done in a rough manner from the ratio of the He lines and their overall strength. The low RV scatter implies either that the inclination of the system is low or that it is not a spectroscopic binary. Without knowledge of the configuration of the system, we cannot derive an evolutionary scenario for the system. However, the luminosity of the WR star puts it in the regime of b-WR stars, which motivates our tentative formation channel classification.
BAT99 64 was originally classified WN4 + OB? in the Brey81 catalog owing to the presence of He I absorption lines in the spectrum of a seemingly early-type WR star. The star was later reclassified by FMG03 to WN4o + O9, who detected periodic RV variations in the system with a period of P = 37.6 d, and later revised again to WN3 + O by Neugent et al. (2018). Furthermore, the system portrays a single eclipse, presumably occurring when the O companion occults the WR companion, with the photometric and spectroscopic periods in agreement (see Fig. 10 in FMG03). Assuming the WR star is fully occulted by its companion during eclipse, the magnitude difference of ΔV ≈ 0.4 mag implies a flux ratio in the optical of roughly FV,O/FV, WR ≈ 2. This ratio agrees very well with the ratio derived spectroscopically. This stands in contrast to the claims of H14, who argued that the companion does not contribute substantially to the optical spectrum.
The temperature of the WR star can be constrained well by the presence of strong N V and weak N IV emissions. With only faint traces of He II absorption, the O companion is confirmed to be a late O-type star. As a result of accounting for binarity, the luminosity of the WR star is found to be ≈0.7 dex smaller in this study compared to the single-star analysis performed by H14. A classification of the synthetic spectrum of the secondary implies it is an O9 V star.
We cannot be confident of the evolutionary path of BAT99 64 (Fig. A.9). Both the binary channel and the CHE channel for the primary yield statistically acceptable results (within 2σ). However, the HRD position of the primary implies that, in the likely case that it did not undergo CHE, this source entered the WR phase via binary interaction, and we therefore classified it as w/b-WR.
BAT99 67 was classified as WN5o + OB by Smith et al. (1996) owing to absorption features superposed with the WR emission in Balmer lines. However, FMG03 reclassified the object to WN5ha, arguing that the absorption is strongly blueshifted and thus forms intrinsically in the wind of the WR star. Moreover, despite having reported an X-ray luminosity of log LX = 33.3 [erg s−1], which potentially implies the presence of WWC, FMG03 did not detect significant periodic RV variability, concluding that BAT99 67 is likely not a close binary. By inspecting the spectra at hand, we could find no clear spectroscopic traces for a secondary companion. We therefore omitted BAT99 67 from our analysis.
BAT99 71 was detected by FMG03 to be a binary on the basis of the system’s large RV variations and was classified as WN4 + O8, later revised to WN3+abs by Neugent et al. (2018). While a spectroscopic period of P = 2.3 d was originally found, a very faint eclipse is visible in their photometric dataset when folding the data with a P = 5.2 d period. This period was shown by FMG03 to be consistent with the RV variability as well, and therefore likely represents the true period of the system (see discussion in FMG03).
In our study, we derive a higher temperature for the secondary than expected for an O8 star, owing to the absence of several weak He I absorption lines. A classification of the model spectrum implies an O6.5 V star. The light ratio can only be roughly constrained based on the overall strength of the features of the companion. The temperature derived in this study for the WR companion is significantly higher than derived by H14, which is likely a consequence of accounting for the binary nature of the system in this study. Likewise, with the O6.5 V component contributing ≈80% in the optical, the luminosity derived for the WR star is 0.6 dex smaller than derived by H14. We confirm that the WR primary is hydrogen free.
As for BAT99 64, both the binary channel and the CHE channel for the primary yield statistically acceptable results (Fig. A.10). From our results, we concluded that the primary is either a w-WR star or a wb-WR star.
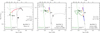 |
Fig. A.10. As Fig. 18, but for BAT99 71. |
BAT99 72 was suggested to be a medium-period (P ≈ 100−1000 d) binary by FMG03, who designated it as a WN4h + O3: binary on the basis of absorption features they detected in their dataset. The optical spectra at hand are indeed suggestive of absorption features, but it is hard to tell whether they belong to the WR star itself or to a companion. No He I features can be seen, which immediately implies that the putative companion must be of an early type. It is not obvious that the WR component suffers from line dilution: some putatively single WN4h stars (e.g., BAT99 25) show comparable line strengths, while others (e.g., BAT99 40) may suggest some dilution.
With our data, we cannot discern between the quality of fit when including a model spectrum for an O3 V star. However, when accounting for binarity, the resulting luminosities of both components end up being very low, ≈5.1 dex for both. This is especially puzzling for an O3 V star, which is expected to be significantly more luminous. Moreover, this makes the WR component in BAT99 72 the least luminous WR star in our sample. While this could make it a promising candidate for a WR star stripped in a binary, we warn that these results should be taken with caution and verified in future work.
BAT99 77 was classified as WN7ha by S08, who detected a clear periodic RV variability with P = 3.0 d. The system is found in a very crowded region containing several massive stars, causing a strong contamination of several IUE datasets, as well as photometric data. Unlike H14, in this study we chose archival IUE spectra and photometry that correspond to the lowest flux level measured. This yields much more realistic parameters for the WR star.
The temperature of the WR star can be well constrained based on the strong N III emission lines and the weak N IVλ4060 emission. Because of the relatively low temperature of the WR component, absorption features belonging solely to the secondary star are very hard to identify unambiguously, leaving its parameters virtually unconstrained. Compared to other WN7h stars, the He II and Balmer emission lines are about five times weaker in the spectrum of BAT99 77. Therefore, we assume the companion contributes 80% to the optical spectrum. A satisfactory fit is obtained for a temperature of T = 35 kK for the secondary, but this should be seen as a very rough estimate. The implied luminosity of the secondary is very high (5.7 dex), suggesting that it is an O7 III star. The gravity was fixed based on calibrations by Martins et al. (2005). Finally, the hydrogen content in the WR star is found to be very high, XH = 0.7, as reported by H14. Most importantly, the luminosity of the WR star is reduced in this study by more than 1 dex compared to that reported by H14. However, more data will be necessary to analyze this system unambiguously.
None of the evolutionary scenarios we explore in this work provide a good fit to the parameters of the system, as is evident from Fig. A.11. In fact, all binary tracks at the relevant parameter regime of short periods and large masses end up merging, hence the rise in luminosity for the best-fitting binary track in the leftmost panel of Fig. A.11. The O companion appears to be evolved, but none of the tracks manage to reproduce its evolved state simultaneously with the non-evolved appearance of the WR star. This may suggest that more components are present in the system. Given the high hydrogen content of the WR primary (XH ≈ 0.7), we classified it as a ms-WR star, although the luminosity is somewhat lower than for other ms-WR stars in our sample (log L = 5.8 [L⊙])
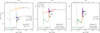 |
Fig. A.11. As Fig. 18, but for BAT99 77. |
BAT99 78 is situated in a very tight region of massive stars situated in the cluster HDE 269828, classified as WN6 by FMG03 and as WN4 by Neugent et al. (2018). The spectra obtained by FMG03 were, according to these authors, contaminated by several sources. However, Walborn et al. (1999) extracted an uncontaminated HST spectrum of the WR component. The spectrum does not reveal any immediate evidence for binarity. Furthermore, FMG03 were not able to detect a periodic RV variability in BAT99 78. The N IV features, especially N IVλ4060, are potentially suggestive of a double peak profile, which could imply that a second WR-like star is hidden in the spectrum. However, more data will be necessary to confirm or reject this hypothesis. We therefore omitted this object from our analysis.
BAT99 79 was classified as WN7h + OB in the original BAT99 catalog owing to clear absorption features in the spectrum. However, no significant RV variability was reported by S08. Crowther & Smith (1997) estimated that significant contribution stems from the secondary star, although this statement was not confirmed by H14.
Our analysis, however, implies that the companion contributes ≈60% to the spectrum in the optical, causing clear absorption features in the Balmer lines and several strong He I lines. The primary WR star is in itself a rather cool star, exhibiting He I lines with blueshifted absorption. The presence of N IV and N III emission lines enabled us to assess its temperature. The light ratio is constrained from the overall strength of the O-type features. The temperature of the secondary can be constrained from the presence of strong He I absorption features and very weak He II absorption, however, its log g can only be roughly constrained. Based on the strength of absorption in the Balmer lines, low values log g ≲ 3.4 [cgs] provide a better fit to the data. Based on a classification of the synthetic spectrum of the secondary, we tentatively classified it as O9 I. The HRD position of the WR primary, along with its very large hydrogen content (70%), is consistent with being a ms-WR star.
BAT99 80 was classified as O4 If/WN6 in the BAT99 catalog, suggesting that the clear He I absorption lines in its spectrum are intrinsic to the WR star. In contrast, S08, who reclassified the target to WN5h:a, suggested that the spectrum of the WR star is diluted by a secondary star, causing the apparent absorption. However, S08 were not able to detect significant RV variability. On the other hand, a substantial X-ray luminosity of log LX ≈ 33.9 [erg s−1] was reported by Guerrero & Chu (2008a), potentially related to the presence of WWC in the system.
Inspection of the optical spectrum leads us to believe that the object is indeed a binary. The WR star is hot enough to show a strong N IVλ4060 emission and a faint N Vλλ4604, 4620 emission. At this temperature (≈50 kK), it does not seem possible to reproduce the multitude of He I absorptions. The companion is therefore cool. The N III feature may be partially attributed to the O companion. Although the solution found in this study provides a better fit to the spectrum, we cannot fully exclude the fact that BAT99 80 may be a single star. Our solution should be regarded as an alternative solution to that presented by H14, who do not assume a secondary star, and therefore derive a significantly higher luminosity. A classification of the synthetic spectrum of the secondary implies an O9.5 V spectral class. The HRD position of the primary, compared to the BPASS tracks, led us to classify it as w/wb-WR.
BAT99 82 was classified as WN3b in the BAT99 catalog. This spectral type was later confirmed by FMG03, who did not detect a periodic RV variation for this object. A rather high X-ray luminosity of log LX ≈ 33.2 [erg s−1] was reported by Guerrero & Chu (2008a), which motivated H14 to mark this object as a binary candidate. However, no feature in the spectrum implies the presence of an additional companion. We therefore omitted this object from our analysis.
BAT99 92 was originally classified as WN3 + B1 I in the original Breysacher (1981) catalog, later revised to WN6 + B1 I in the BAT99 catalog. The S08 authors reclassified the primary yet again to WN3. The latter authors reported a period of P = 4.3 d for the system, which is consistent with the period given in the BAT99 catalog. Since the absorption features of the B1 I component seem to maintain a constant RV, it was suggested that the system contains an additional companion orbiting the WR star at a short orbit, motivating S08 to classify the system as WN3:b (+ O) + B1 Ia. The very high brightness of the system is consistent with this conjecture. Moreover, as noted in the BAT99 catalog, the object portrays a very strong emission of the C IV resonance doublet in the UV, which suggests that it might be a rare transition-type WN/C star (Conti & Massey 1989). Alternatively, this could imply that a WC star is also present in the system. Lastly, the optical recombination emission lines are extremely broad and round, a fact which motivated H14 to assume a significant rotation of the WR star.
We strongly believe that BAT99 92 is, in fact, a WC binary. The reason for the previous assignment of the spectral class WN is the presence of a feature that resembles the N IIIλλ4634, 4641 emission line, which is characteristic for cooler WN stars. However, as we illustrate in Fig. A.12, this feature belongs to the He IIλ4686 complex, and only appears to be a separate line owing to the absorption of the B-type companion. This, together with the strong C IVλ5812 optical line and C IV resonance line in the UV, gives strong support that the primary is a WC star, which we classified as WC4.
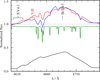 |
Fig. A.12. Comparison between the observed CTIO spectrum of BAT99 92 (blue) and the synthetic composite spectrum (red), comprising the WC model (black) and B-type model (green). The wide WR features and absorption originating in the B-type companion give rise to a feature that resembles the N III doublet, which is likely erroneous. |
The limited resolution of the data only allow for an approximate solution to the system. The temperature of the primary is estimated primarily from the lack of C III spectral features, setting a low bound of roughly 90 kK at this parameter regime. The temperature of the second component is estimated to 23 kK from the plethora of metal lines that are observed, albeit in low resolution. The light ratio of the components is estimated from the overall strength of the spectral features of the secondary. The strong Hα emission, which is seen in the spectrum taken by Torres-Dodgen & Massey (1988) implies that the B1 Ia secondary has a very high mass-loss rate of log Ṁ = −5.1[M⊙ yr−1]. The luminosities of both components are found to be very large – log L ≈ 6.0 [L⊙]. This could indicate that further components are present in the spectra. However, higher resolution data will be necessary to establish this. Since BAT99 92 appears not to host a WN component, we did not investigate its evolutionary path in this study, but will include this object in future studies of the WC content of the LMC.
BAT99 93 was classified as O3 If/WN6 in the BAT99 catalog, later revised to O3 If* by Evans et al. (2011). Although S08 could not detect a periodic RV variability, it was considered a binary candidate by H14 owing to the X-ray emission detected from the object by Guerrero & Chu (2008a). The optical spectrum at hand, however, shows no features that can be attributed to a secondary star. We therefore omitted this object from our analysis.
BAT99 95 (VFTS 402) was first classified as a spectroscopic binary by S08, who inferred a period of P = 2.1 d for the system, and classified it as WN7h. The companion in the system was believed to be an OB-type star (Evans et al. 2011; Bestenlehner et al. 2014), but no concrete evidence for this was found. In fact, based on archival FLAMES spectra, we found evidence that this system is composed of two WR stars: a cooler, more massive WN star, which we refer to as the secondary, and a hotter, less massive WN star, which we refer to as the primary. We chose this nomenclature because evolutionary-wise, the hotter star was likely the more massive component originally. Another reason for this choice is that the RV curve derived by S08 corresponds to the motion of the hotter component.
To explain why the companion is most likely a WR star, Fig. A.13 shows the N IVλ4060 line together with the He Iλ4471 line in four archival FLAMES observations. The N IV line traces the same velocities as the He II lines, and therefore traces the RV curve derived by S08. The profile variations of the N IVλ4060 line are suggestive of two emission components that move in anti-phase. The He I lines show a less-pronounced anti-phased behavior, and generally do not follow the same behavior of the He II lines. The origin of the He I is, we believe, primarily the secondary star. A non-negligible contribution from a WWC region is likely in this line. It may also be responsible for the strong N III emission seen in the optical spectrum, although we can only speculate that this is the case without phase coverage beyond 5500 Å. Another argument against an OB-type companion is that, if assumed to be present, a typical OB-type companion would strongly dilute the emission lines of the WR star. To reproduce the emission lines in their observed strengths, we would need to assume extremely large mass-loss rates in the excess of log Ṁ = −4[M⊙ yr−1], which is hard to motivate physically. Lastly, the combination of faint N V, strong N IV, and very strong N III in the optical spectrum is very hard to reproduce using just one WR model.
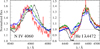 |
Fig. A.13. Four FLAMES observations of BAT99 95 at phases ϕ = 0.18, 0.57, 0.65, 0.88. The motion of the primary, hotter WR star can be seen in the N IVλ4060 line, following the motion in other He II lines. He I lines such as He Iλ4471 do not follow this motion and even depict a slight anti-phase behavior (see trough of black and red emission wing in the right panel). |
We derived the RVs of both companions based on a 2D cross-correlation with the N IV line using a PoWR model as a template for both stars. However, we caution that the fit quality was not satisfactory for all phases and significant systematic errors may be present. The motion of the cooler secondary should be best monitored with the N IIIλλ4634, 4641 doublet. Unfortunately, only one phase of FLAMES observations is available that covers this doublet, so a careful derivation of the RV curves of both components is currently not possible. We encourage deeper observations of BAT99 95 in future studies.
The stellar parameters derived from our analysis are generally very uncertain and the fit quality is poor. The temperatures could be fairly well constrained based on the nitrogen and helium balance, but the light ratios, and therefore the mass-loss rates, are strongly degenerate. A classification of the model spectra suggests the spectral classes WN5(h) and WN7(h) for the primary and secondary, respectively (Smith et al. 1996). The light ratio was primarily based on the observed strength of the N IV line compared to its strength in single WR stars of a similar spectral type (WN5h). However, we caution that this may be wrong because of a potential contribution of the primary to this line.
It is possible that our results are affected by the presence of a strong WWC signature, especially at lines belonging to low ionization stages (e.g., He I). More data will be necessary to obtain an adequate disentanglement of this system.
Given the large hydrogen mass fractions of the components, we classified these as ms-WR stars. However, it should be noted that our analysis suffers from large uncertainties because of the uncertain nature of the components and the lack of spectral coverage.
BAT99 99 This star was classified as O2.5 If*/WN6 in the original BAT99 catalog. A relatively high X-ray luminosity of LX ≈ 1034 erg s−1 was derived for this object by Guerrero & Chu (2008a), potentially implying the presence of either WWCs or an accreting object. The S08 authors derived a rather long period of 93 d for the system. From the available spectra, we cannot find any evidence for a companion, either in the optical or in the UV. A low-mass star is virtually excluded from the mass function (see orbital parameters by S08). Considering the X-ray luminosity, the most likely companion is either a very hot OB-type star with a similar absorption spectrum as the primary (e.g., O3 V star) or an accreting BH. However, more data are necessary to test this hypothesis.
BAT99 100 (VFTS 1001) is situated in a very crowded region in the Tarantula nebula and was classified as WN6h by S08. The object was detected in X-rays, although the source is rather faint (Guerrero & Chu 2008a). Furthermore, no RV variations were found by S08. In the available spectra, we cannot detect features that can be attributed to a secondary star. We therefore omit this star from our sample.
BAT99 102 (VFTS 507) is another star found in a crowded region in the Tarantula nebula, situated about 1″ away from the stars BAT99 101 and BAT99 103. The target was classified as WN6 by S08. The latter authors cannot recover the 2.76 d binary period reported for the system by Moffat (1989). In fact, they recover this period for BAT99 103, implying that the two sources were confused by Moffat (1989).
We retrieved archival FLAMES spectra for the object. The spectra cover a database of about a year, but no RV variability can be detected. We therefore conclude that BAT99 102 is likely a single star.
BAT99 103 (VFTS 509, RMC 140b) is located in the immediate vicinity of BAT99 101 and 102. It was classified as WN6 by S08 and later as WN5(h) + O by Evans et al. (2011). The S08 study inferred a 2.76 d period for this object from RV variations (see also notes for BAT99 102), and a mild detection of X-rays was reported by Guerrero & Chu (2008b). Bestenlehner et al. (2014) performed a spectral analysis of the WR component, but did not account for the secondary.
Several phase-dependent FLAMES spectra were available for our study and enabled the disentanglement and orbital analysis of the system (cf. Figs. 9 and 13). Unfortunately, the spectra do not provide a good coverage of the orbit in RV space. The disentangled spectra are plausible, but some artifacts appear to contaminate the disentangled spectrum of the secondary. These are most likely from nebular line contamination and WWC signatures. Nevertheless, the disentangled spectrum enables the classification of the secondary and implies the spectral type O3.5 V. This agrees with the classification of our model spectrum.
The effective temperature of the WR component could be well constrained from the presence of all three nitrogen ionization stages N III-V. The light ratio was determined from the overall strength of the O features. Since all the features of the O companion are entangled with the primary, we caution that the value of the light ratio is subject to a large error, as is the mass-loss rate of the WR component. The wind parameters of the primary follow from the strength and shape of the emission lines.
We cannot find a binary-evolution track that reproduces the parameters of the system (Fig. A.15). The best-fitting binary track reaches a current period of P ≈ 10 d, which is four times longer than observed. Tracks with shorter initial periods end up merging and fail to reproduce the observables of the system. Based on BPASS, only a channel in which the primary avoided interaction provides a consistent fit to the observations. The estimated equatorial rotation velocity of the secondary (v sin i = 200 km s−1 and veq ≈ 450 km s−1) is consistent with a past mass-accretion phase, but at the short 2.7 d period may also suggest a homogeneous evolution history. Given the uncertainties involved in the evolution of such short-period binaries, we classified the primary as w-WR.
 |
Fig. A.14. As Fig. 18, but for BAT99 95. |
 |
Fig. A.15. As Fig. 18, but for BAT99 103. |
BAT99 105 was classified as a transition type O3 If*/WN6 in the original BAT99 catalog, later revised to WN7 by S08, and finally to O2 If* by Neugent et al. (2018). The S08 study could not infer a periodic RV variability despite the mild RV scatter (σRV ≈ 35 km s−1). The H14 authors considered this object a binary candidate based on its rather high X-ray luminosity for the object of log LX = 33.4 [erg s−1] (Guerrero & Chu 2008a). After a careful inspection of the available spectra (UVES and HST), we could not detect any clear signs for a companion in the spectrum. More data will be needed to reject the presence of a massive companion in the spectrum, however. We therefore omitted this object from our sample.
BAT99 107 (VFTS 527, RMC 139) was classified by S08 as WNL/Of, i.e., a transition-type star. Moffat (1989) reported a 52.7 d period for this object, but this could not be confirmed by S08. Recently, Taylor et al. (2011) analyzed high quality FLAMES spectra and derived a spectral and orbital solution for the system. These authors concluded that the system comprises two massive O-type stars (O6.5 Iafc + O6 Iaf) with a period of P = 153.9 d. The long period explains why S08 could not infer this because their survey is sensitive to periods up to 100 d.
The analysis of this system is fairly straightforward, since the motion of the components is easily seen in the spectra. The parameters derived in this study agree well with those reported by Taylor et al. (2011). The latter authors do not state their derived mass-loss rates. The N III and He II emission lines are narrow and originate in both stars; this can be easily seen from their Doppler motion (see Fig. A.16, left panel). To reproduce this narrow emission profile, β values of 2 or higher were necessary for the power index of the velocity law. Here, we adopted β = 2 for both stars. These lines form very close to the stellar photosphere and therefore contain little information regarding the actual wind velocity. Fortunately, the H α line is much broader and probes the outer velocity field (Fig. A.16, right panel). Without UV observations, however, the terminal velocity is subject to a large error. The mass-loss rates derived for both stars are on the order of log Ṁ ≈ −5[M⊙ yr−1]; the mass-loss of the primary is slightly larger. Importantly, no hydrogen depletion (or helium enrichment) can be deduced from the observations, but clear signs for a strong nitrogen enrichment are present (by a factor of about 50) along with strong oxygen depletion. Since this object was originally considered to be a WR star, it was kept in our sample. If the components were a WR star, it would clearly belong to the ms-WR class and we therefore classified them accordingly.
 |
Fig. A.16. Zoom-in of the main emission features observed in the optical spectra of BAT99 107, showing an averaged X-SHOOTER observation (blue line) at phase ϕ = 0.05 (maximum Doppler separation), compared to our composite binary PoWR fit (red line). The narrow emission lines in the left panel probe the inner wind velocity field, while Hα shown in the right panel probes the outer velocity field. |
BAT99 111 (RMC 136b) was classified as WN9ha in the original BAT99 catalog, later updated to O4 If+ by Massey & Hunter (1998), and finally to O4If/WN8 by Crowther et al. (2016). The H14 study considered this system a binary candidate based on supposed X-ray detection by Townsley et al. (2006). However, the source identified as BAT99 111 by Townsley et al. (2006) is separated by 0.3–0.5″ from BAT99 111, depending on whether the coordinates from the BAT99 catalog or HST images are assumed. In the dense region of R 136, this separation is highly significant. Guerrero & Chu (2008a) confirmed that BAT99 111 is not associated with an X-ray point source. Interestingly, a comparison between two UV HST spectra taken on the 01-02-1996 (PI:Heap) and the 07-4-2012 (PI:Crowther) are suggestive of a RV shift of ≈40 km s−1, which could imply Doppler motion. More observations will be needed to confirm this, however. For now, we omitted this star from our sample.
BAT99 112 (RMC 136c) is another object situated close to the core of the R136 cluster, classified as WN5h by Crowther & Dessart (1998) and recently to WN4.5h by Neugent et al. (2018). Schnurr et al. (2009) reported a marginal detection of periodic RV variations with P = 8.2 d with an amplitude of ≈40 km s−1. Moreover, the object portrays a very high X-ray luminosity of log LX ≈ 34.8 [erg s−1] (Townsley et al. 2006; Guerrero & Chu 2008a), suggesting the possible presence of WWC (Schnurr et al. 2009). Despite these indications toward binarity, we cannot confirm the presence of a secondary star from the single HST spectrum at hand. More optical observations are needed to uncover possible features of the secondary. We therefore omitted this star from our sample.
BAT99 113 (VFTS 542, MK 30) is a transition type star classified by Crowther & Walborn (2011) as O2 If*/WN5. The S08 authors inferred periodic RV variations with P = 4.7 d. H14 and later Bestenlehner et al. (2014) provided a single-star analysis of the object and suggested that the contribution of the secondary to the spectrum is likely low.
We carefully inspected the FLAMES spectra at hand, mostly covering the binary’s conjunction phases, i.e., highest Doppler shifts. We identified very weak spectral signatures moving in anti-phase to the WR primary in the lines He Iλ4388 and λ4471. Using these lines, we were able to measure the RVs of the secondary and disentangle the spectrum. The orbital solution is shown in Fig. 15, and the disentangled spectra are shown in Fig. 10. The spectrum of the secondary shows clear signatures of He I lines and potentially very weak He II lines. We tentatively classified it as B0 V, but better data will be necessary to validate this. From calibration of the disentangled spectrum with the intrinsic strength of He I lines for B0 V stars, we could derive a light ratio of fV, 2/ftot = 0.1. The parameters found for the secondary agree with its tentative spectral type.
Figure A.17 illustrates the best-fitting BPASS tracks of BAT99 113 for the three scenarios considered here. All relevant binary tracks end up merging shortly after the currently observed evolutionary phase. In contrast, a merger is avoided in the CHE scenario. It is not possible to determine which of these two fit the data better. Given its HRD position, however, we classified the WR primary as w/wb-WR.
 |
Fig. A.17. As Fig. 18, but for BAT99 113. |
BAT99 114 (VFTS 545, MK 35) is another transition type star with an identical spectral type to BAT99 113 (Crowther & Walborn 2011; Evans et al. 2011). The object is a binary candidate on the basis of its X-ray luminosity of log LX = 33.4 [erg s−1] (Guerrero & Chu 2008a). However, while S08 could find an RV variability which exceeds their cutoff of 20 km s−1 (σRV = 23 km s−1), they could not infer a period. Bestenlehner et al. (2014) and H14 provided a single-star fit to the object. Based on the single HST spectrum we possess for this object, we could not find any clear indications for the presence of a binary companion in the system. We therefore omitted this object from our sample.
BAT99 116 was classified as WN5h:a by S08, who detected nonperiodic RV variability (σRV = 33 km s−1) for the object. This is one of the strongest X-ray sources among the WR stars in the LMC, with log LX = 35.3 [erg s−1], and was hence considered a binary candidate by H14. Pollock et al. (2018) performed an analysis of a Chandra X-ray light curve and derived a period of P = 155.1 d for the system. The X-ray light curve is very suggestive of a WWC binary, implying that both components exhibit significant stellar winds.
Recently, Tehrani et al. (2019) published an orbital and spectroscopic analysis of BAT99 116, finding it to be potentially the most massive binary weighed. Since these authors had much better spectra and a better phase coverage, we decided to adopt their parameters. In Fig. B.23, we show the PoWR models calculated with those parameters, indicating that the agreement is good. Their orbital parameters, as well as the light ratio of the two components, were adopted in Table 3. However, with the reddening law used in this work, we are led to lower luminosities of log L1 = 6.31 [L⊙] and log L2 = 6.20 [L⊙], which has some consequence on the mass. Tehrani et al. (2019) used a reddening law specifically derived for the cluster 30 Dorados by Maíz Apellániz et al. (2014). In this study, we chose to work with a homogeneous reddening law for the whole LMC, which may introduce some systematic differences between our study and that of Tehrani et al. (2019). It is likely that the values derived by Tehrani et al. (2019) are more accurate and are therefore adopted in this study, but it is important to keep in mind that a systematic difference is possible, and hence lower luminosities (and masses). Since BAT99 116 is reportedly the most massive binary ever weighed (Tehrani et al. 2019), it would be very important to attempt to derive its inclination independently, for example, through polarimetric studies.
The two WR components clearly belong to the ms-WR class. The future evolution of the system is thoroughly discussed by Tehrani et al. (2019).
BAT99 119 (RMC 145, VFTS 695) is a WWC binary consisting of two massive ms-WR stars (WN6h + O3.5 If/WN7) that are members of an eccentric 158.7 d period binary. The system was thoroughly analyzed by Shenar et al. (2017), to which we refer for details.
BAT99 126 was classified as WN4b + OB by FMG03 and more recently to WN3 + O7 by Neugent et al. (2018). Testor & Niemela (1998) suggested the object is a binary based on its spectral appearance. Later FMG03 detected a periodic RV variability with P = 25.5 d, although the RV scatter is comparable to their detection threshold. Moreover, the object portrays significant X-rays (log LX ≈ 33 [erg s−1], Guerrero & Chu 2008a), which is further suggestive of a binary nature. Interestingly, the OGLE light curve of the system reveals that this object comprises a contact binary with a period of P = 1.5 d. Whether or not the members of this contact system coincide with the WR binary is unclear. However, newly acquired UVES data should help uncover the true configuration of this important system in future work (Shenar et al., in prep.).
In the only spectrum at hand, we indeed found clear spectral signatures belonging to a secondary star in He I lines, as well as He II lines, which are entangled with those of the WR primary. From the ionization balance, we derive a temperature of 37 kK for the secondary. The model spectrum of the secondary gives the spectral type O6.5 V. However, since this system may be a triple, we caution that these results may be subject to systematic errors. Based on our comparisons with the BPASS tracks (Fig. A.18), we classified the WR primary as w/wb-WR.
 |
Fig. A.18. As Fig. 18, but for BAT99 126. |
BAT99 129 is an eclipsing WR binary with a period of 2.8 d (Wyrzykowski et al. 2003). It was most recently classified as WN3(h)a + O5 V by Foellmi et al. (2006), who derived an orbital solution for the system and disentangled its spectrum. Thanks to these past efforts, the task of analyzing the system was rather straight forward, and we found a good agreement with the light ratio reported by Foellmi et al. (2006), and our derived stellar parameters agree well with their reported spectral types.
Only tracks that account for past mass transfer can account for the properties of the system (Fig. A.19). Because of this, and since the WR primary is found to have had a large enough initial mass to enter the WR phase intrinsically, we classified this source as wb-WR.
 |
Fig. A.19. As Fig. 18, but for BAT99 129. |
Appendix B: Spectral fits
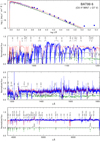 |
Fig. B.1. Spectral fit for BAT99 006. |
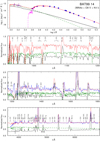 |
Fig. B.2. Spectral fit for BAT99 014. |
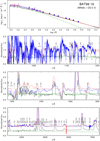 |
Fig. B.3. Spectral fit for BAT99 019. |
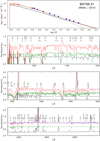 |
Fig. B.4. Spectral fit for BAT99 021. |
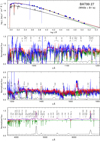 |
Fig. B.5. Spectral fit for BAT99 027. |
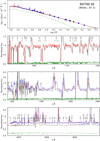 |
Fig. B.6. Spectral fit for BAT99 029. |
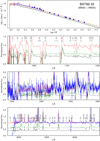 |
Fig. B.7. Spectral fit for BAT99 032. |
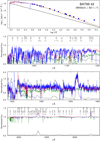 |
Fig. B.8. Spectral fit for BAT99 042. |
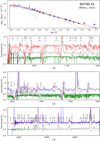 |
Fig. B.9. Spectral fit for BAT99 043. |
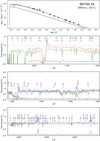 |
Fig. B.10. Spectral fit for BAT99 049. |
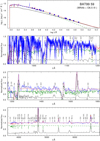 |
Fig. B.11. Spectral fit for BAT99 059. |
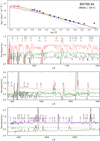 |
Fig. B.12. Spectral fit for BAT99 064. |
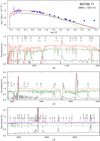 |
Fig. B.13. Spectral fit for BAT99 071. |
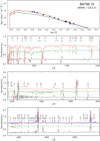 |
Fig. B.14. Spectral fit for BAT99 072. |
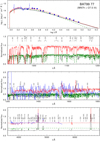 |
Fig. B.15. Spectral fit for BAT99 077. |
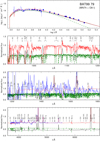 |
Fig. B.16. Spectral fit for BAT99 079. |
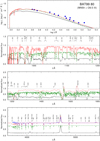 |
Fig. B.17. Spectral fit for BAT99 080. |
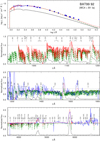 |
Fig. B.18. Spectral fit for BAT99 092. |
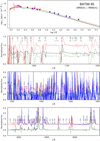 |
Fig. B.19. Spectral fit for BAT99 095. |
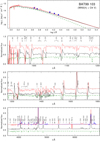 |
Fig. B.20. Spectral fit for BAT99 103. |
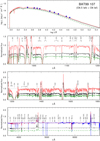 |
Fig. B.21. Spectral fit for BAT99 107. |
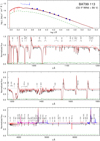 |
Fig. B.22. Spectral fit for BAT99 113. |
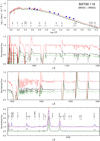 |
Fig. B.23. Spectral fit for BAT99 116. |
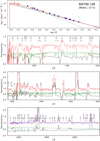 |
Fig. B.24. Spectral fit for BAT99 126. |
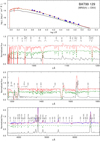 |
Fig. B.25. Spectral fit for BAT99 129. |
Appendix C: Observation log
Observation log for far UV.
Observation log for UV.
Observation log for optical.
Summary of CTIO observations for BAT99 12 taken in the framework of this study.
As Table C.4 but for BAT99 32.
As Table C.4 but for BAT99 77.
As Table C.4 but for BAT99 92.
As Table C.4 but for BAT99 95.
As Table C.4 but for BAT99 103.
As Table C.4 but for BAT99 113.
All Tables
Summary of CTIO observations for BAT99 12 taken in the framework of this study.
All Figures
|
Fig. 1. Illustration of the ms-WR, w-WR, wb-WR, and w-WR formation channels of WR stars. Shown are evolution tracks calculated at a metallicity Z = 0.008 (≈ZLMC) with the BPASS code for single stars with initial masses Mi = 100, 50, and 25 M⊙ (upper, middle, and dashed lower tracks, respectively). Also plotted are BPASS binary evolution tracks with Mi = 50 M⊙, Pi = 25 d, qi = 0.7 (upper), and Mi = 25 M⊙, Pi = 25 d, qi = 0.7 (lower). The colors correspond to surface hydrogen mass fractions (blue: 0.4 < XH < 0.74, red: 0.2 < XH < 0.4, orange: 0.05 < XH < 0.2, green: XH < 0.05). Empirically, stars found in the dashed region are not expected to show a WR spectrum (see Sect. 6.1.3). |
| In the text | |
|
Fig. 2. Hα image of the LMC (Smith et al. 2005). The locations of all putatively single (red circles) and binary-candidate (yellow stars and labels) WN stars in the LMC BAT99 catalog are denoted. The WN binaries constitute our sample. |
| In the text | |
|
Fig. 3. Spectral analysis of the system BAT99 6. The observed photometry and spectra (archival IUE, FEROS) of BAT99 6 are shown in blue. The composite synthetic spectrum (red dotted line) is the sum of the WR (black solid line) and O (green dashed line) models. The relative offsets of the model continua correspond to the light ratio between the two stars. |
| In the text | |
|
Fig. 4. Left panel: HRD positions of the LMC WR components. Labels correspond to the BAT99 catalog. A selection of binary evolution tracks (Eldridge et al. 2008; Eldridge & Stanway 2016) calculated with the BPASS code for Z = 0.008 are plotted. The tracks show the evolution of the primary star for several initial masses M1, i and initial mass ratio and period of qi = 0.9 and Pi = 25 d, respectively. The colors and symbols code the hydrogen abundance and WR type, as described in the legend. The WR phase is defined for T* > 20 kK. Right panel: as left panel, but showing BPASS tracks calculated for non-rotating single stars, and including the putatively single LMC WN stars (gray symbols, adopted from H14), and the WN/O3 stars (gray triangles, adopted from Neugent et al. 2017). Little arrows imply lower bounds on T* (degeneracy domain or insufficient S/N). |
| In the text | |
|
Fig. 5. Same as right panel of Fig. 4, but this time showing tracks calculated with the Geneva code for single stars rotating (initially) at 40% the critical rotation velocity at Z = 0.006 (C. Georgy, priv. comm.). |
| In the text | |
|
Fig. 6. Disentanglement of BAT99 19 using the shift-and-add technique. One of the observed composite FLAMES spectra (blue line) and the disentangled spectra for the WR primary (black line) and O-type secondary (green line) are shown. The levels of the spectra of the components reflect their fractional contribution to the total continuum flux. |
| In the text | |
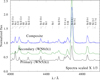 |
Fig. 7. Same as Fig. 6, but for BAT99 32 and using the code Spectangular (see text for details). |
| In the text | |
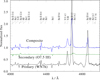 |
Fig. 8. Same as Fig. 6, but for BAT99 77 and using the code Spectangular (see text for details). |
| In the text | |
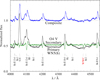 |
Fig. 9. Same as Fig. 6, but for BAT99 103. |
| In the text | |
|
Fig. 10. Same as Fig. 6, but for BAT99 113. The disentangled spectrum of the secondary is binned at 1 Å to increase the S/N. |
| In the text | |
|
Fig. 11. Orbital solution for BAT99 019. |
| In the text | |
|
Fig. 12. Orbital solution for BAT99 95. |
| In the text | |
|
Fig. 13. Orbital solution for BAT99 103. |
| In the text | |
|
Fig. 14. Orbital solution for BAT99 107. |
| In the text | |
|
Fig. 15. Orbital solution for BAT99 113. |
| In the text | |
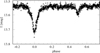 |
Fig. 16. Light curve of BAT99 19 folded with the parameters given in Table 3. |
| In the text | |
|
Fig. 17. Light curve of BAT99 126 folded with P = 1.55296 d and T0 = 2100.55. |
| In the text | |
|
Fig. 18. Best-fitting BPASS tracks and ages for BAT99 49 for the case of (i) binary mass transfer, (ii) the primary evolving homogeneously and secondary nonhomogeneously (middle panel), and (iii) both components evolving homogeneously (right panel). Colors and styles are shown as in Fig. 4. The circles correspond to the derived ages. Evidently, only the binary channel offers a consistent fit for BAT99 49. |
| In the text | |
|
Fig. 19. Positions of the WR components on a M − log L diagram (symbols) compared to mass-luminosity relations calculated for homogeneous stars (Gräfener et al. 2011), depicted by solid curves. The colors correspond to the hydrogen content (see legend). The Eddington limit calculated for a fully ionized helium atmosphere is also plotted (gray dashed line). |
| In the text | |
|
Fig. 20. Normalized distribution of v sin i values for the 26 OB-type companions of WN stars measured in this work (blue) compared with v sin i distributions for apparently single and binary OB-type stars in the Tarantula region, adopted from Ramírez-Agudelo et al. (2013, 2015). |
| In the text | |
|
Fig. 21. Histogram of veq for the 16 OB-type companions of WN stars with constrained v sin i (Table 2) and i (Table 3), assuming an alignment of the rotational and orbital axes. Upper limits contribute equally to all lower bins, hence the fractional counts. |
| In the text | |
|
Fig. 22. Positions of the single (adopted from H14) and binary (this work) LMC WN sample on the log L − log Ṁ plane. The meaning of the colors and symbols are indicated as in Fig. 4; the binaries are denoted with a circle (see legend). Also shown are the WN3/O3 stars analyzed by Neugent et al. (2017). The projection of Eq. (6) onto the LMC metallicity and different hydrogen content, where there temperature is fixed to typical values per subtype, are plotted. We also plot the commonly used relations published by Nugis & Lamers (2000) for the LMC and for H-rich/free stars and the theoretical relation published by Vink (2017). |
| In the text | |
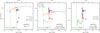 |
Fig. A.1. As Fig. 18, but for BAT99 6. |
| In the text | |
|
Fig. A.2. UVES observation of BAT99 12 (blue line). A zoom-in on a promd He I also includes models for T = 20 kK dwarfs (log g = 4.0 [cgs]), which are diluted to 50%, 10%, and 5% (red, green, and pink lines, respectively). The models assume a typical rotation of 100 km s−1. No features corresponding to a late-type massive secondary can be spotted. |
| In the text | |
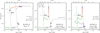 |
Fig. A.3. As Fig. 18, but for BAT99 19. |
| In the text | |
|
Fig. A.4. Comparison between the disentangled spectrum of BAT99 19 and observed spectra of BAT99 3, 15, and 48 (see legend). Despite their identical spectral type (WN4b), BAT99 19 shows peculiarly broad and round lines. |
| In the text | |
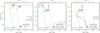 |
Fig. A.5. As Fig. 18, but for BAT99 29. |
| In the text | |
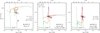 |
Fig. A.6. As Fig. 18, but for BAT99 32. |
| In the text | |
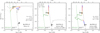 |
Fig. A.7. As Fig. 18, but for BAT99 43. |
| In the text | |
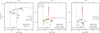 |
Fig. A.8. As Fig. 18, but for BAT99 59. |
| In the text | |
 |
Fig. A.9. As Fig. 18, but for BAT99 64. |
| In the text | |
|
Fig. A.10. As Fig. 18, but for BAT99 71. |
| In the text | |
|
Fig. A.11. As Fig. 18, but for BAT99 77. |
| In the text | |
|
Fig. A.12. Comparison between the observed CTIO spectrum of BAT99 92 (blue) and the synthetic composite spectrum (red), comprising the WC model (black) and B-type model (green). The wide WR features and absorption originating in the B-type companion give rise to a feature that resembles the N III doublet, which is likely erroneous. |
| In the text | |
|
Fig. A.13. Four FLAMES observations of BAT99 95 at phases ϕ = 0.18, 0.57, 0.65, 0.88. The motion of the primary, hotter WR star can be seen in the N IVλ4060 line, following the motion in other He II lines. He I lines such as He Iλ4471 do not follow this motion and even depict a slight anti-phase behavior (see trough of black and red emission wing in the right panel). |
| In the text | |
|
Fig. A.14. As Fig. 18, but for BAT99 95. |
| In the text | |
|
Fig. A.15. As Fig. 18, but for BAT99 103. |
| In the text | |
|
Fig. A.16. Zoom-in of the main emission features observed in the optical spectra of BAT99 107, showing an averaged X-SHOOTER observation (blue line) at phase ϕ = 0.05 (maximum Doppler separation), compared to our composite binary PoWR fit (red line). The narrow emission lines in the left panel probe the inner wind velocity field, while Hα shown in the right panel probes the outer velocity field. |
| In the text | |
|
Fig. A.17. As Fig. 18, but for BAT99 113. |
| In the text | |
|
Fig. A.18. As Fig. 18, but for BAT99 126. |
| In the text | |
|
Fig. A.19. As Fig. 18, but for BAT99 129. |
| In the text | |
|
Fig. B.1. Spectral fit for BAT99 006. |
| In the text | |
|
Fig. B.2. Spectral fit for BAT99 014. |
| In the text | |
|
Fig. B.3. Spectral fit for BAT99 019. |
| In the text | |
|
Fig. B.4. Spectral fit for BAT99 021. |
| In the text | |
|
Fig. B.5. Spectral fit for BAT99 027. |
| In the text | |
|
Fig. B.6. Spectral fit for BAT99 029. |
| In the text | |
|
Fig. B.7. Spectral fit for BAT99 032. |
| In the text | |
|
Fig. B.8. Spectral fit for BAT99 042. |
| In the text | |
|
Fig. B.9. Spectral fit for BAT99 043. |
| In the text | |
|
Fig. B.10. Spectral fit for BAT99 049. |
| In the text | |
|
Fig. B.11. Spectral fit for BAT99 059. |
| In the text | |
|
Fig. B.12. Spectral fit for BAT99 064. |
| In the text | |
|
Fig. B.13. Spectral fit for BAT99 071. |
| In the text | |
|
Fig. B.14. Spectral fit for BAT99 072. |
| In the text | |
|
Fig. B.15. Spectral fit for BAT99 077. |
| In the text | |
|
Fig. B.16. Spectral fit for BAT99 079. |
| In the text | |
|
Fig. B.17. Spectral fit for BAT99 080. |
| In the text | |
|
Fig. B.18. Spectral fit for BAT99 092. |
| In the text | |
|
Fig. B.19. Spectral fit for BAT99 095. |
| In the text | |
|
Fig. B.20. Spectral fit for BAT99 103. |
| In the text | |
|
Fig. B.21. Spectral fit for BAT99 107. |
| In the text | |
|
Fig. B.22. Spectral fit for BAT99 113. |
| In the text | |
|
Fig. B.23. Spectral fit for BAT99 116. |
| In the text | |
|
Fig. B.24. Spectral fit for BAT99 126. |
| In the text | |
|
Fig. B.25. Spectral fit for BAT99 129. |
| In the text | |
Current usage metrics show cumulative count of Article Views (full-text article views including HTML views, PDF and ePub downloads, according to the available data) and Abstracts Views on Vision4Press platform.
Data correspond to usage on the plateform after 2015. The current usage metrics is available 48-96 hours after online publication and is updated daily on week days.
Initial download of the metrics may take a while.