Fig. 4.
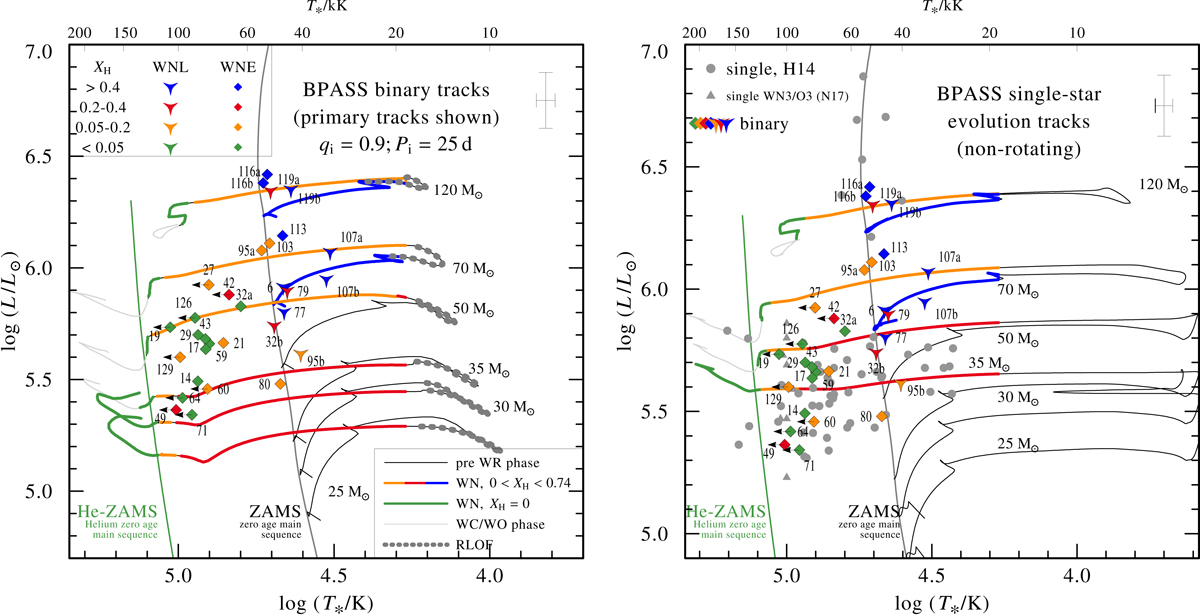
Left panel: HRD positions of the LMC WR components. Labels correspond to the BAT99 catalog. A selection of binary evolution tracks (Eldridge et al. 2008; Eldridge & Stanway 2016) calculated with the BPASS code for Z = 0.008 are plotted. The tracks show the evolution of the primary star for several initial masses M1, i and initial mass ratio and period of qi = 0.9 and Pi = 25 d, respectively. The colors and symbols code the hydrogen abundance and WR type, as described in the legend. The WR phase is defined for T* > 20 kK. Right panel: as left panel, but showing BPASS tracks calculated for non-rotating single stars, and including the putatively single LMC WN stars (gray symbols, adopted from H14), and the WN/O3 stars (gray triangles, adopted from Neugent et al. 2017). Little arrows imply lower bounds on T* (degeneracy domain or insufficient S/N).
Current usage metrics show cumulative count of Article Views (full-text article views including HTML views, PDF and ePub downloads, according to the available data) and Abstracts Views on Vision4Press platform.
Data correspond to usage on the plateform after 2015. The current usage metrics is available 48-96 hours after online publication and is updated daily on week days.
Initial download of the metrics may take a while.