Fig. 3.
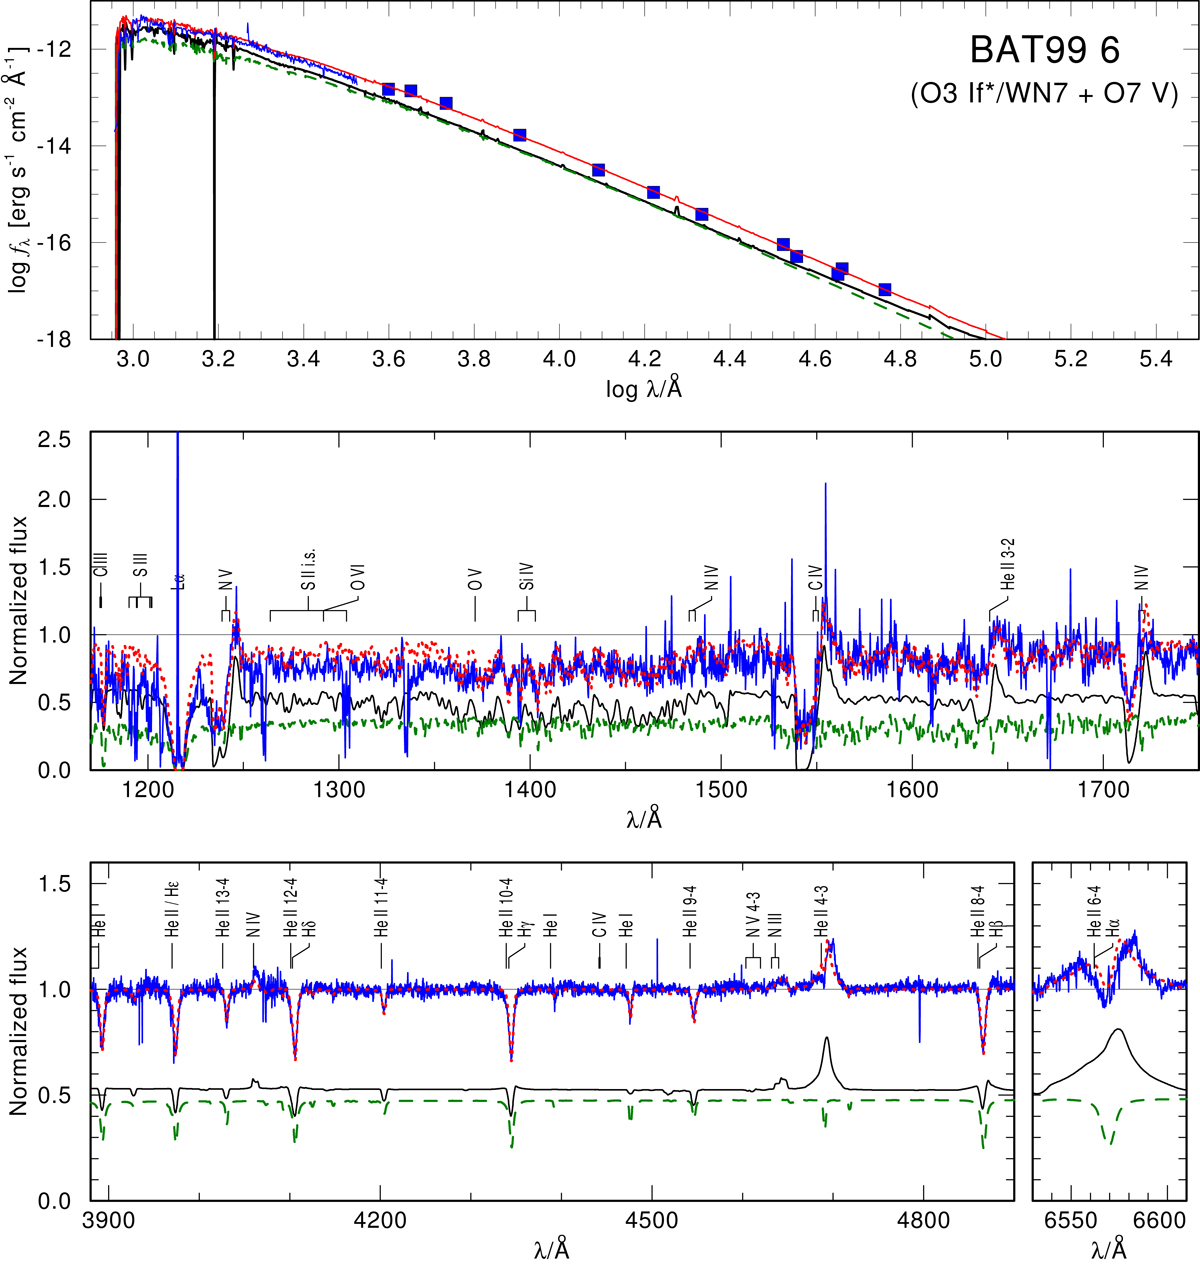
Spectral analysis of the system BAT99 6. The observed photometry and spectra (archival IUE, FEROS) of BAT99 6 are shown in blue. The composite synthetic spectrum (red dotted line) is the sum of the WR (black solid line) and O (green dashed line) models. The relative offsets of the model continua correspond to the light ratio between the two stars.
Current usage metrics show cumulative count of Article Views (full-text article views including HTML views, PDF and ePub downloads, according to the available data) and Abstracts Views on Vision4Press platform.
Data correspond to usage on the plateform after 2015. The current usage metrics is available 48-96 hours after online publication and is updated daily on week days.
Initial download of the metrics may take a while.