Fig. 6.
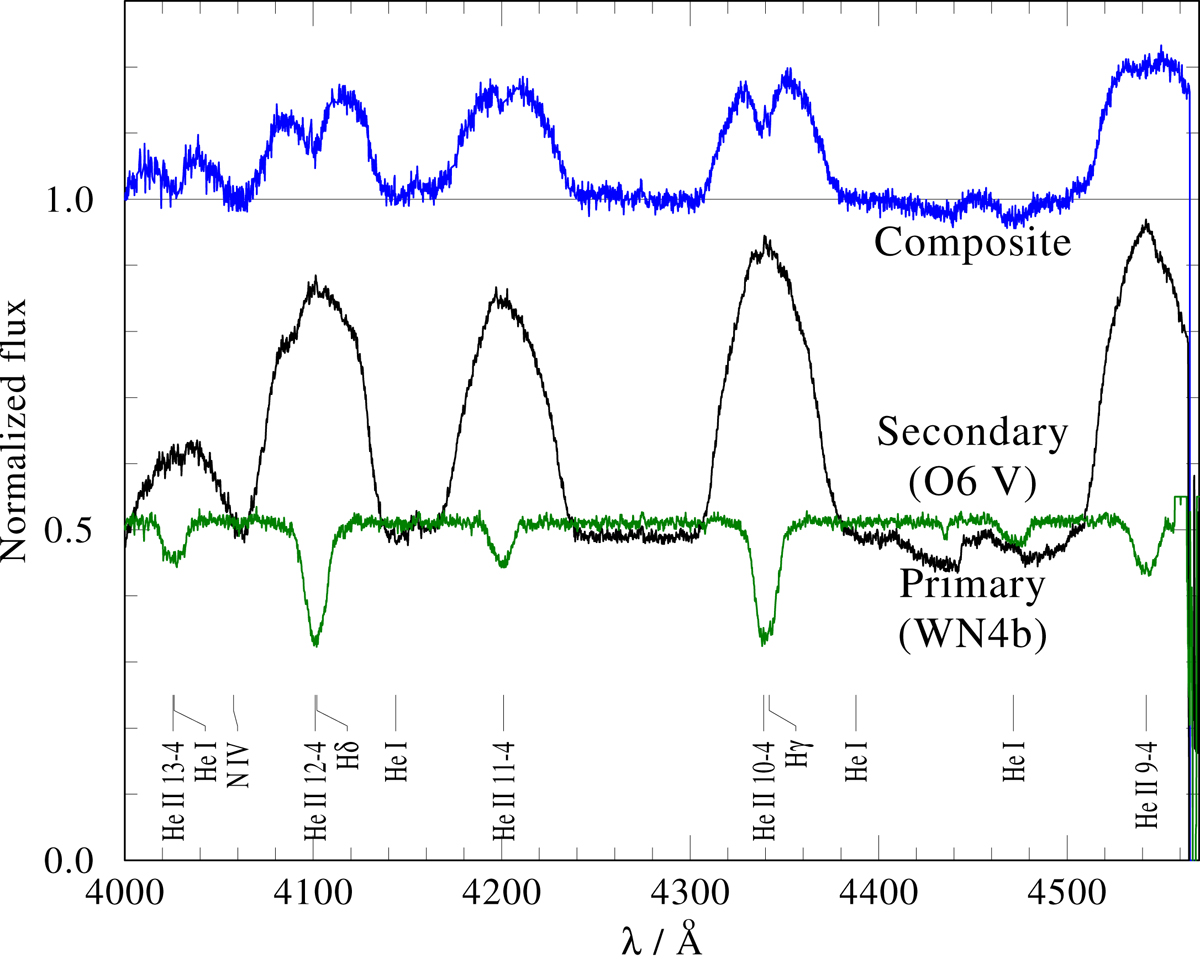
Disentanglement of BAT99 19 using the shift-and-add technique. One of the observed composite FLAMES spectra (blue line) and the disentangled spectra for the WR primary (black line) and O-type secondary (green line) are shown. The levels of the spectra of the components reflect their fractional contribution to the total continuum flux.
Current usage metrics show cumulative count of Article Views (full-text article views including HTML views, PDF and ePub downloads, according to the available data) and Abstracts Views on Vision4Press platform.
Data correspond to usage on the plateform after 2015. The current usage metrics is available 48-96 hours after online publication and is updated daily on week days.
Initial download of the metrics may take a while.