| Issue |
A&A
Volume 627, July 2019
|
|
|---|---|---|
| Article Number | A122 | |
| Number of page(s) | 11 | |
| Section | Planets and planetary systems | |
| DOI | https://doi.org/10.1051/0004-6361/201935143 | |
| Published online | 12 July 2019 | |
Hydrogen isotopic anomalies in extraterrestrial organic matter: role of cosmic ray irradiation and implications for UCAMMs
1
Centre de Sciences Nucléaires et de Sciences de la Matière (CSNSM), Université Paris Sud, UMR 8609-CNRS/IN2P3,
91405 Orsay, France
e-mail: This email address is being protected from spambots. You need JavaScript enabled to view it.
2
Institut des Sciences Moléculaires d’Orsay (ISMO), Université Paris Sud, UMR 8609-CNRS/IN2P3,
91405 Orsay, France
3
Institut Curie, PSL Research University, INSERM, U1196,
91405 Orsay, France
4
IFP Energies Nouvelles, direction Géosciences,
92500 Rueil-Malmaison, France
5
Centre de Recherche sur les Ions, les Matériaux et la Photonique (CIMAP) CEA/CNRS/ENSICAEN/Université de Caen Normandie, Boulevard Henri Becquerel,
BP 5133 14070 Caen Cedex 05, France
Received:
28
January
2019
Accepted:
11
June
2019
Abstract
Context. Micrometeorites represent, at timescales shorter than a few million years, the dominant source of extraterrestrial matter at the surface of the Earth. Analyses of ultracarbonaceous micrometeorites recovered from Antarctica, known as UCAMMs reveal an exceptionally N-rich organic matter associated with spatially extended high D enrichments. Experiments show that this specific organic matter might have been formed in the outer solar system by energetic irradiation of N-rich icy surfaces.
Aims. We experimentally investigate the hydrogen isotopic fractionation resulting from irradiation of normal and D-rich N2-CH4 ices by high energy ions, simulating the exposition to Galactic cosmic rays of icy bodies surfaces orbiting at large heliocentric distances.
Methods. Films of N2-CH4 ices and a N2-CH4/CD4/N2-CH4 “sandwich” ice were exposed to 129Xe13+ ion beams at 92 and 88 MeV. The chemical evolution of the samples was monitored using in situ Fourier transform infrared spectroscopy. After irradiation, targets were annealed to room temperature. The solid residues of the whole process left after ice sublimation were characterized in situ by infrared spectroscopy, and the hydrogen isotopic composition measured ex situ by imaging secondary ion mass spectrometry at the sub-micron scale (NanoSIMS).
Results. Irradiation leads to the formation of new molecules and radicals. After annealing, the resulting poly-HCN-like macro-molecular residue exhibits an infrared spectrum close to that of UCAMMs. The residue resulting from irradiation of N2-CH4 ices does not exhibit a significant deuterium enrichment comparable to that found in extraterrestrial organic matter. The residue formed by irradiation of D-rich ices shows the formation of isotopic heterogeneities with localised hotspots and an extended contribution likely due to the diffusion of the radiolytic products from the D-rich layer.
Conclusions. These results show that high-energy cosmic ray irradiation does not induce the large hydrogen isotopic fractionation observed at small spatial scale in interplanetary organics. By contrast, large D/H ratio heterogeneities at the sub-micron spatial scale in extraterrestrial organic matter can result from isotopically heterogeneous ices mixtures (i.e. condensed with different D/H ratios), which were transformed into refractory organic matter upon irradiation.
Key words: astrochemistry / Oort cloud / meteorites, meteors, meteoroids / methods: laboratory: solid state
© B. Augé et al. 2019
 Open Access article, published by EDP Sciences, under the terms of the Creative Commons Attribution License (http://creativecommons.org/licenses/by/4.0), which permits unrestricted use, distribution, and reproduction in any medium, provided the original work is properly cited.
1 Introduction
Extraterrestrial organic matter is observed in meteorites and interplanetary dust particles (IDPs), originating from asteroids, comets, and icy bodies of the solar system (Hayatsu et al. 1977; Flynn et al. 2003). The hydrogen and nitrogen isotopic composition of extraterrestrial organic matter exhibit large heterogeneities from one meteorite to another and, within a given sample, at a spatial scale of a few microns (Robert et al. 1981; Alexander et al. 2017). The bulk D/H ratio of the insoluble organic matter (IOM) extracted from meteorites exhibits values ranging from the Vienna Standard Mean Ocean Water, i.e. 155.76 ± 0.1 × 10⁻⁶ (Lecluse & Robert 1994), hereafter referred to as VSMOW, to about twice the VSMOW value. These ratios are one order magnitude above the value of the protosolar H2 reservoir recorded in the atmosphere of giant planets (Lecluse et al. 1996; Mahaffy et al. 1998). Large D enrichments are also found in organic matter from interplanetary dust particles (Aléon et al. 2000; Messenger 2002).
Some of the organic matter isotopic anomalies found in extraterrestrial dust may be related to those observed in comets or may originate from the processing of species condensed on these icy bodies. The sublimation of comets thus provides information on the potential isotopic composition of their volatile species. The H2O and HCN molecules observed in the gas phase of comets exhibit variable D/H ratios within a factor of 2–10 of the VSMOW value (Bockelee-Morvan et al. 2015). Before the Rosetta mission, the D/H ratio measured in the H2O vapour of comets was up to twice the VSMOW value. In the Jupiter family comet 67P/Churyumov-Gerasimenko, the D/H ratio in the water vapour was measured by Rosetta and found to be equal to three times the VSMOW value (Altwegg et al. 2014). By contrast, comet 103P/Hartley 2 from the same family exhibits a D/H ratio close to VSMOW (Hartogh et al. 2011). The δD1 values in meteorites ranges from VSMOW to a few thousands permil in IOM with heterogeneous spatial distribution and typical hotspot size about or smaller than μm2 (Remusat et al. 2007).
Micrometeorites recovered in Antarctic snows near the Concordia station reveal particles with exceptionally large content in organic matter, the ultracarbonaceous Antarctic micrometeorites (UCAMMs) with extreme D/H ratios up to 30 times VSMOW value (Duprat et al. 2010). The organic matter in UCAMMs exhibits larger nitrogen and lower oxygen concentration compared to meteoritic IOM (Dartois et al. 2013, 2018; Yabuta et al. 2017, 2012a,b).
The elemental, isotopic, and structural characteristics of these particles indicate that they most probably originate from icy parent bodies (Nakamura et al. 2005; Duprat et al. 2010; Yabuta et al. 2017; Dartois et al. 2013, 2018). Among the general properties of UCAMMs described in the above cited references, these properties are dominated by an organic fraction typically higher than 50% of the micrometeorites content and up to 95% and have a D/H up to 30 times the VSMOW and a N/C fraction up to 0.15 (Dartois et al. 2013, 2018; Duprat et al. 2010). These UCAMMs present several organic phases and have bulk sizes up to several microns in extend (Charon et al. 2017). A hypothesis was put forward proposing that the N-rich O-poor organic matter of UCAMMs may originate from the irradiation by Galactic cosmic ray (GCR) ions of N-rich ices at the surface of icy bodies (see Dartois et al. 2013 for details). Experiments recently performed at GANIL (Caen, France) demonstrated that a N2 -CH4 ice mixture exposed to radiative environments such as cosmic rays produces poly-HCN-like residues (i.e. solid refractory stable material composed of H, C, and N) being possible precursors of the UCAMM N-rich, O-poor organic matter (Augé et al. 2016).
The origin of the isotopic anomalies in extraterrestrial organic matter is still an open question. Large D enrichmentscan result from ion-molecule reactions at low temperature and at relatively high gas density (104 –1012 cm−3; e.g. Aikawa et al. 2012) in molecular cores or protoplanetary discs (Geiss & Reeves 1981). Model calculations indicate that extremely high D/H ratios, which reach values of 0.01–1 in some molecules in protostellar cores (Roueff et al. 2005; Parise et al. 2006; Sakai et al. 2009; Aikawa et al. 2012), can occur in given species (e.g. H ) when reacting with the main H2 reservoir at the time CO is depleted from the gas phase, i.e. frozen in grain mantles (Aikawa et al. 2002; Ceccarelli et al. 2014). The large D enrichments carried by the H2 D+ or HD
 molecules may then be transferred to other molecular species and eventually end up in macro-molecular organics. Besides this main process of D enrichment, additional D/H enhancements, although less significant, may result from secondary processes; these processes are mainly induced by an exposition of extraterrestrial material to energetic particles (electrons and photons). Transmission electron microscopy coupled with NanoSIMS studies and X-ray irradiation followed by NanoSIMS studies have shown that irradiation processes may induce moderate D/H enhancements in carbonaceous matter after very high irradiation doses (de Gregorio et al. 2010; Laurent et al. 2014, 2015; Gavilan et al. 2017). These studies show that the D/H ratio increases with the deposited doses and then reaches a plateau at about 600–1000 permil at extremely high doses.
These studies were so far limited to photon and electron irradiations. We present experiments of irradiation of ice mixtures using swift ions to simulate the effect of GCR irradiation at the surface of outer solar system objects orbiting in the Kuiper Belt or in the Oort cloud (Cooper et al. 2003). We used mixtures of nitrogen and methane ices similar to the species identified at the surface of such icy bodies such as Pluto (Grundy et al. 2016; Cruikshank et al. 2015; Protopapa et al. 2016), Makemake (Lorenzi et al. 2015) or Eris (Licandro et al. 2006); these species are expected to be representative of the composition of thousands of objects, large or cold enough to retain volatiles at their surfaces (see Figs. 1 in Schaller & Brown 2007; Brown et al. 2011), in the Kuiper belt and Oort cloud regions that are not yet accessible to telescopic observations for reasons of size or magnitude limits. We first used an ice mixture with standard CH4 to evaluate the significance of irradiation-induced D/H isotopic fractionation. We then considered the case of a D-rich N2 -CH4 sandwich ice mixture to evaluate how the D excesses carried by the ices is transferred to the poly-HCN-like residue, the latter being more specifically relevant for the case of UCAMMs. These experiments allow us to experimentally evaluate the generic isotopic fractionation induced by irradiation by cosmic rays in the outer solar system and discuss the more particular case of UCAMMs and the origin of deuterium anomalies in their specific organic matter.
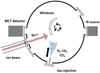 |
Fig. 1 Cross-cut of the IGLIAS set-up in the optical plane with three substrate windows, the moving needle used to inject gas inside the main chamber and the FTIR spectrometer. |
2 Experiments and methods
2.1 Experiments
The experiments were performed at the IRRSUD2 beam line of the heavy ion accelerator GANIL (Caen, France) with 92 and 88 MeV 129 Xe13+. We used for the first time an experimental set-up called IGLIAS (Fig. 1). The IGLIAS set-up is equipped with an ultra-high vacuum chamber (2 × 10⁻¹⁰ mbar at 9 K) coupled to a cryogenic rotatory sample holder. The cooling to the minimum temperature of 9 K is achieved with a closed-cycle helium cryostat. An electrical heating system allows us to control the substrate temperature from 9 to 300 K. Up to three substrate windows can be mounted on the sample holder. The cold head can be rotated into different positions to deposit the ice and to irradiate it. Transmission infrared (IR) spectra can be recorded in the last position at 12° incidence using a Fourier-transform IR (FTIR) spectrometer. More details can be found in Augé et al. (2018). In these experiments, we used IR transparent windows (CsI and ZnSe). Spectra were recorded before and during irradiations at different fluences andat different temperature steps during heating.
After irradiation of the samples, a slow warming-up was performed from 9 to 300 K with a ramp set at 0.1 K min−1. Such low annealing speed avoids explosive desorption when remaining volatile molecules sublimate and allows diffusion of radicals in the ice. When room temperature was reached, the chamber was opened and the windows covered with residues extracted. Each window was kept under dry primary vacuum for transport and further ex situ NanoSIMS analyses. One residue from each experiment was analysed by scanning ion imaging with the NanoSIMS-50 at Institut Curie in Orsay. Prior to the NanoSIMS analysis, the samples were covered with 20 nm of gold for charge evacuation and then exposed to a Cs+ ion beam at 16 keV. Secondary ion mass spectroscopy allows us to measure the CD− /CH− ratio whichthen leads to the determination of the D/H ratio.
Table of experiments parameters.
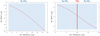 |
Fig. 2 Evolution of the electronic stopping power (Se, calculated with SRIM code, see text for details) as a function of the projectile ion range inside two samples: a N2 -CH4 (90:10) ice and a N2-CH4 (90:10) ice with a thin layer (0.1 μm) of CD4 inside. |
2.2 Ice samples
To deposit ice samples, we used a gaseous mixture of N2 -CH4 (90:10) and CD4. The first sample was acquired from Air Liquide with a purity above 99.99% and the second from Cortecnet with a purity of 99%. Both were used as received.
The first experiment was performed in October 2016 with N2 -CH4 (90:10) ices exposed to 92 MeV Xe ion beam. The thickness was determined using interference fringes measured on the IR spectra as summarized in Table 1. The thickness of the first sample is estimated as 15.2 μm. The second experiment was performed in June 2017 with a “sandwich” sample: a thin layer of CD4 was deposited between two thicker layers of N2 -CH4 (90:10) ices and then exposed to 88 MeV Xe ion beam. The thickness of the CD4 layer was estimated to be around 0.1 μm and the total thickness was 18.9 μm. This sandwich structure was chosen to have a starting ice with a high isotopic contrast to perform a proof of concept in a simple configuration, which could show the induced effects in a straightforward way. We refer to these two samples as unlabelled and labelled ices, respectively. Since these experiments were not performed at the same ion energy, the electronic stopping power is slightly different between the two experiments. Calculated electronic stopping power values shown in Fig. 2 were obtained using the SRIM code (Ziegler et al. 2010) assuming an ice density of 0.94 g cm−3 (Satorre et al. 2008). The thicknesses of the samples were chosen to maximize the amount of residue to be analysed by NanoSIMS, but avoid implantation of the incident ions used for irradiation at GANIL.
The IR spectra of freshly deposited ice films (Fig. 3) reveal different absorption bands which can mainly be assigned to the CH4 molecule. The FTIR spectrometer allows us to detect two absorptions of the N2 molecule usually hidden inside CO2 residual absorption coming from the purge. The labelled sample presents additional bands attributed to the CD4 molecule. The identified bands are listed in Table A.1.
Both mixtures were irradiated with a total dose of 19 eV molecule−1. We chose this dose because previous experiments on similar N-rich ices showed that a dose between 10 and 50 eV molecule−1 is enough toprocess the ices and to form a solid residue at room temperature. It also corresponds to a few million years of exposure in space, see Augé et al. (2016) and Sect. 5 for details.
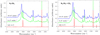 |
Fig. 3 Infrared spectra from 4500 to 700 cm−1 from the N2-CH4 (left) and the N2-CH4+CD4 ices (right). The bottom spectra are the initial deposited ice (multiply by 0.2 for visibility), the middle spectra are those after a total dose of 8 eV molecule−1, and top spectra are the final spectra taken at 19 eV molecule−1. Arrows (triangles) below the IR spectra (right panel) indicate the CD4 (CH4) bands used to estimate the initial D/H ratio from the labelled ice according to Eq. (1). |
2.3 Initial D/H ratio
The experiment aims at studying the isotopic fractionation of the residue obtained from irradiation of unlabelled and labelled ices. The NanoSIMS measurements provide access to the D/H ratio inside the solid residue after irradiation and subsequent sublimation. The initial D/H ratio of the unlabelled ice was controlled by analysis of seven gaseous samples from the N2 -CH4 bottle. The isotopic composition of the gas was measured with a Thermo Scientific MAT 253 mass spectrometer at the IFPEN laboratory (Rueil Malmaison, France). The initial hydrogen isotopic composition of the unlabelled sample has a δD of −189 ± 2‰, corresponding to a D/H ratio of 126 ± 1 × 10⁻⁶.
The initial bulk D/H ratio in the labelled sandwich ice was inferred using Eq. (1), where  (respectively
  ) stands for the integrated absorbance of one methane (heavy methane) band at
  (
( ),
),
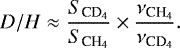 (1)
(1)
Using the 3021 and 1305 cm−1 CH4 bands and the corresponding 2251 and 990 cm−1 CD4 bands (indicated with an arrow, Fig. 3), we found a bulk initial ratio of D∕Hinitial = 0.08 ± 0.02 (2σ). The initial D/H ratio was chosen to maximize the response to the analytical experiments performed on the residue.
2.4 NanoSIMS experiments
The D/H isotopic ratio measurements were performed by scanning ion imaging with the NanoSIMS-50 at Institut Curie in Orsay. Four ion species, such as 12CH−, 12CD−, C and CN−, were recorded in parallel with a Cs+ primary beam by the multi-collection system (with the same magnetic field) on four individual electron multipliers (EMs). Prior to NanoSIMS analysis, the samples were coated with a thin layer of 20 nm of gold (SPI sputter coater) to establish a continuous conducting surface. This also helps to minimize the charging effects due to high densityion bombardment during imaging. The vacuum level in the analytical chamber was around 1.5 × 10⁻¹⁰ mbar to prevent the contamination of the analysis surface from residual ambient gas, which may potentially induce a dilution when high D-content was measured.
The built-in CCD light camera allows the selection of the region to be analysed. The samples were first pre-implanted with a primary current of 500 pA at reduced incident energy (8 keV) for about 20 min over a large area of 200 × 200 μm2. The resulting total pre-implanted fluence is about 1 × 10¹⁶ Cs+ cm−2. Under such conditions, high spatial resolution images of C and CN− ions allow aclose view of the region for further selection. Then an implantation with a nominal 16 keV Cs+ primary ion beam was carried out on a limited area (100 × 100 μm2) so as to reduce the transition time necessary to reach the sputtering equilibrium regime. The isotopic images were acquired with a typical primary Cs+ beam current of about 7 pA and the size of the probe was about 0.3 μm. In order to avoid mass interference from the nearby CH
 matrix ions at high intensity, a high mass resolution (HMR) condition was required. This was obtained using a customized entrance slit of 5 μm in width and 100 μm in height, and a standard aperture slit of 150 × 150 μm2. The HMR protocol is detailed in Slodzian et al. (2014, 2017).
Multi-stack scanning images were acquired over a field of view ranging from 25 × 25 μm2 to 60 × 60 μm2 area, with a definition of 256 × 256 pixels. The probe dwell time was 0.5 ms per pixel per stack. We recorded 200–600 stacks for each analysis area. The typical counting rate on the samples was 50 000 c s−1 for CH−. The image processing was performed using the ImageJ software (Schneider et al. 2012). Usual corrections for both dead time (44 ns) and quasi-simultaneous arrivals (QSA-effect; Slodzian et al. 2017) were performed for major isotope species CH−, C , and CN−, stack by stack, even though their amplitude are well below the variations reported in this work. Then stack to stack alignment was carried out using either the CN−, or the C
 image with a specific ImageJ plug-in (Messaoudi et al. 2007).
The instrumental mass fractionation (IMF) calibration was obtained using the procedure and the standard described in details in Bardin et al. (2015). The calibration included analytical organic films standards prepared with different amount of known and controlled D/H ratios. The calibration curve obtained on the CD−/CH− ratios over a large range spanning from VSMOW value (1.56 × 10⁻⁴) up to the highly D-rich standard having D/H = 0.32 was similar to that obtained by Bardin et al. (2015).
On the unlabelled residue the total acquisition contained 230 stacks. In order to obtain a bulk value, we defined a region of interest (ROI) over a flat region of the sample with a total area of 25 124 pixels. We summed 10 consecutive stacks to obtain stacks with significant counts of CD− ions, resulting in 23 effective stacks. We then we selected the range from stack 5 to stack 20 over which the CH− counts exhibit a plateau. The resulting average number of counts per stack in the ROI ranged from a few tens of counts in CD− and a few 105 counts in CH−. On the labelled residue, we defined the bulk ROI as a square centred in the middle of the sample with a total area of 52 900 pixels by avoiding the edges of the image. As the probe eroded the sample, we obtained isotopic data at increasing depth, allowing us to quantify the D/H ratios for the D-rich zones buried inside the sample. The results presented were obtained by selecting a range of stacks between 210 and 330 over which the average D/H ratio of the image was almost constant while the D-rich zones were clearly visible. As for the unlabelled data, we summed 10 consecutive stacks resulting in a set of 12 stacks with an average number of counts per stack in the ROI ranging from about 105 of counts in CD− and 106 counts in CH−.
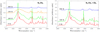 |
Fig. 4 Infrared spectra from 4000 to 1000 cm−1 for the N2-CH4 (left) and the N2-CH4+CD4 ices (right). Spectra are taken at different temperatures during the slow warming-up (0.1 K min−1). No spectra were recorded for the D-rich ice between 100 and 300 K because of a technical problem with the repeated recording feature FTIR spectrometer. |
3 Results
3.1 Irradiation of the ice mixtures
Figure 3 portrays the evolution of the IR spectra at different doses for both samples. These spectra show a clear diminution of CH4 and CD4 bands with time, indicating the radiolysis of these molecules under irradiation. The destruction of initial molecules leads to the formation of radicals and molecules. The identified IR bands and their possible attributions are presented in Table A.1. Labelled and unlabelled ice mixtures produce a strong signal at 2100 and 2091 cm−1 attributed to the formation ofHCN and CN−. The HCN molecule has other IR bands identified at 1725, 3144, and 3286 cm−1. A band at 2036 cm−1 indicates the formation of HNC. HCN and CN− are the most abundantly formed identified molecules in column density, as demonstrated by previous work (Augé et al. 2016). In addition, numerous other molecules and radicals are identified. The methane destruction leads to the formation of the CH3 radicals (611 cm−1). By combination, this species forms carbonaceous species such as C2 H6 (2985 cm−1) or C2 H2 (3270 cm−1). Radiolysis of nitrogen may produce N3 (1656 cm−1), NH (1467 cm−1), and NH3 (1070 and 1638 cm−1).
Thanks to the ultra-high vacuum conditions, the water layering was found to be negligible during the low temperature experiments. Nevertheless, some CO molecule contribution at 2140 cm−1 is visible with a column density of at most 6 × 10¹⁴ molecule cm−2. This value is 15 times lower than that obtained with a previous set-up at the same dose on the same beam line (Augé et al. 2016) and indicates that almost no oxygen bearing molecules were formed. The attribution of the 2264 cm−1 bands, previously assigned to the HNCO molecule (Moore & Hudson 2003; Jheeta et al. 2013) has to be revisited as this band still appears in these experiments with the same relative intensity as that in Augé et al. (2016), where water contamination was higher, disfavouring an O-related identification.
The IR spectra from the labelled ice reveal new features at 1887, 2230, 2402, and 2553 cm−1. Some of these can be assigned to C2HD and C2 D2 (Bottger et al. 1964). Some NH3 isotopologue might also have been formed but no definite attribution is possible. These new bands show that projectiles depositing energy in the CD4 layer lead to the migration of D atoms, which subsequently attach to radicals such as CH3.
3.2 300 K annealing and formation of residues
A selection of IR spectra recorded during warming up of the samples is shown in Fig. 4, and IR spectra of the residues at room temperature are shown in Fig. 5. The warming-up process from 9 to 300 K lasted 48 h with a constant ramp of 0.1 K min−1. We note that spectra were not recorded between 100 and 300 K for the labelled ice sandwich owing to an acquisition incident with the FTIR spectrometer. This incident affected spectra acquisition and not the ramping system, thus both labelled and unlabelled residues were produced under the same experimental condition.
The volatile molecules (e.g. unprocessed CH4, CD4, and N2) sublimate and have disappeared around 50 K. The higher molecular weight species sublimate at higher temperatures accompanying a structural rearrangement of the macromolecular residue in the 100–200 K range up to its final form at room temperature. Residues from labelled and unlabelled ices visible on Fig. 5 reveal IR contributions attributed to different bands involving C, N, and D atoms. A contribution of N-H and amine functional group is present in the large feature between 3500 and 2600 cm−1. Some aliphatic CH2 and CH3 overlap this region around 3000cm−1. The double bandaround 2150 cm−1 is attributed to nitrile and isonitrile absorption. Aromatic C=C and C=N absorb in the 1600 cm−1 range and simple C-N around 1400 cm−1. A first C-Dstretch feature is visible in the labelled residue close to the N ≡C absorption band. The blue spectrum highlights the difference between labelled and unlabelled spectra, normalised to the column density in the C-D stretching mode region. The C-D stretches contribution is otherwise blended with the nitrile and isonitrile absorptions. Infrared spectra show that the residue from the labelled ice present some D-related features, indicating an efficient D incorporation in the organic matter (Fig. 5). The estimated final thickness of the residues is close to hundreds of nanometers. Both spectra are similar to those for the residues obtained in previous experiments and are relevant precursors for the organic matter of UCAMMs (Augé et al. 2016).
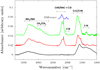 |
Fig. 5 Room temperature spectra from the irradiated N2-CH4 (middle, in red) and the N2 -CH4+CD4 (top, in green) ice mixtures. Functional groups identifications are given. The blue spectrum is a subtraction between green and red spectra; see text for details. Infrared spectrum of a UCAMM (DC060565) is given in black for comparison; see Augé et al. (2016) for a detailed analysis of the nitrile and isonitrile bands intensity. |
4 NanoSIMS analyses
The residues from the labelled and unlabelled experiments were analysed with the NanoSIMS-50 at Institut Curie in Orsay. The bulk D/H ratio and D/H isotopic images are shown below.
4.1 Unlabelled ices
The residue for the unlabelled ice reveals a cracked appearance (Fig. 6). The ROI marked with a yellow line on Fig. 6 exhibits a bulk D/H ratio of δD = 150 ± 100‰, corresponding to a D/H ratio of 180 ± 20 × 10−6. This value is compatible with that measured on the polystyrene standard sample, i.e. δD of 207‰. Figure 7 shows the evolution of the residue D/H ratio during the analysis of consecutive stacks. The consecutive analysis remains close to the standard value and the VSMOW value.
4.2 Labelled ices
The analysis on the residue obtained from the labelled ices are shown in Figs. 7–9. The D/H ratio of the residue exhibit large heterogeneities resulting from varying amount of incorporation of atoms originating from the CD4 ice layer. Parts of the image are characterized by a smooth, isotopically homogeneous D/H ratio with rather low value, hereafter referred to as the cold regions. Other parts exhibit much higher D/H ratios with large spatial heterogeneities, hereafter referred to as the hot regions.
The bulk D/H ratio obtained from the whole image has a mean value of 0.11 ± 0.01 (2σ) close to the bulk value of the ice mixture inferred from the CH4 and CD4 IR bands according toEq. (1) (see Sect. 2.3). The small difference must probably comes from the difficulty to estimate properly the CD4 IR absorption cross section to better than 20%.
The average D/H ratio of hot and cold ROI areas are 0.17 ± 0.02 (2σ) and 0.06 ± 0.01 (2σ), respectively. In Fig. 9 we show a histogram of the D/H ratio distribution in the image. The sampling size for the calculation of D/H ratios in the images (boxes of honeycomb structure) is 36 pixels, i.e. 2 μm2 approximatively. The large contribution of the smooth and cold region is clearly visible in the narrow peak at D/H ≈ 0.06, while the heterogeneous hot regions give rise to a broader contribution with D/H ranging from 0.1 up to 0.3, and a broad maximum around 0.15. We discuss the possible origin of these two components in Sect. 5.1.1.
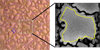 |
Fig. 6 Left: optical picture of the unlabelled residue. Right: C |

5 Discussion
5.1 Heavy ion irradiation
5.1.1 D incorporation
The D/H ratio of the residue obtained after irradiation of unlabelled ices is, within the experimental uncertainties, compatible with that of the VSMOW value. Since the initial ice was slightly depleted in deuterium (δD of −189±2‰ i.e D/H ratio of 126 ± 1 × 10⁻⁶), this result indicates that the upper limit on the isotopic fractionation induced by irradiation is δD ≈ 420 ± 135‰. This means that heavy ion irradiation most probably induces a moderate D fractionation in the resulting organic material. However, the D enrichment remains substantially smaller than that observed in extraterrestrial organic matter where δD can largely exceed few 1000‰ (Robert et al. 1981; Alexander et al. 2010; Remusat et al. 2007). This limited irradiation induced D enrichment is not compatible with the large D excesses observed in hotspots in IDPs and IOM from meteorites and UCAMMs organics, implying that the origin of these isotopic anomalies must be related to another process. A substantial fraction of interplanetary organic matter may have endured secondary processes due to Galactic cosmic ray bombardment. This may have substantially altered the composition of the organics, but our results show that GCR irradiation is not the source of the hydrogen fractionation.
In contrast, the residue from the labelled ice exhibits large D enrichment. The bulk D/H ratio of the residue from labelled ice is 0.11 ± 0.01, which is a value close to that of the original ice mixture estimated from the IR spectra. This result indicates that the hydrogen isotopic composition of the ice is preserved and transferred to the residue during the irradiation and annealing processes. The irradiation process itself does not lead to a substantial loss or gain of deuterium: hot ROI has a δD of about 590‰ and cold ROI of about −435‰, with respect to the bulk value.
The particularly interesting result obtained in this work is that the initial spatial isotopic heterogeneity of the ice mixture (i.e. the sandwich) is clearly visible in the residue exhibiting two distinguishable components: a smooth isotopically cold area and an isotopically hot and irregular component.
The hot regions have an average D/H ratio of 0.17 ± 0.02, but the most D-rich parts reach very large D/H ratios up to ≈0.5 (δD ≈ 3660‰). The precursor of this component was most probably formed within or at least in the close vicinity of the initial CD4 ice layer. The energy deposited by the heavy ions formed extreme D-rich moieties within the D-rich area. These precursors quickly recombined with surrounding molecules with lower D/H ratios giving rise to the isotopically highly heterogeneous D-rich component. In order to preserve such high D/H subcomponents, the intrinsic length of interaction of these extreme D-rich moieties must have been rather short compared to the initial ice thickness. This implies that the formation of the macromolecular residue upon cosmic ray irradiation is a local process that retains the high D/H isotopic enrichment.
By contrast, the smooth and cold component is most probably related to the production of a disordered poly-HCN-like material inside the unlabelled layers. The fact that its mean isotopic ratio of D/H = 0.06 ± 0.01 is about 400 times that of the unlabelled ices clearly indicates incorporation of D atoms originating from the CD4 layer. These D atoms diffused from the labelled layer and recombined with radicals produced by the irradiation. This hypothesis is strengthened by the fact that the D/H ratio of the cold region (Fig. 9) slowly decreased during the analysis. Slightly more D was incorporated in the poly-HCN material in the upper layer (from 0 to 10 μm in Fig. 2) of the sandwich ice. This smooth D/H gradient is most probably the consequence of the higher ion stopping power in the upper part of the ice layers; see Fig. 2. This implies that more radical species susceptible to attach a D atom have been produced in the upper layers, resulting in average, in slightly higher D/H ratios. D also migrated in the bottom layer but less radicals were available for the recombination, resulting in the observed slight isotopic gradient with depth.
As a result, the total residue appears as a mixture between a poly-HCN component formed in the N2 -CH4 layers with some D due to migration and another layer formed within or at the vicinity of the D-rich ice layer. The use of a CD4 layer was chosen to maximize the range of D/H variation in the residue. Formation of precursors at the direct vicinity of this layer induces the very high D/H ratios observed in this laboratory simulation, which are much larger than the values observed in UCAMMs or interplanetary organic matter in general.
Strikingly, the spatial scale of the isotopic anomalies found in the residue is comparable to that observed in UCAMMs or IDPs (Duprat et al. 2010; Messenger 2002). This suggests that the micro-scale isotopic heterogeneities observed in these organics may result from irradiation/condensation of thin ices layers with isotopic heterogeneities. In addition, these experiments show that energetic particle irradiation of D-rich ices preserves the bulk isotopic composition of initial ices and produces a residue which is an excellent candidate precursor compatible with the organic matter observed in UCAMMs.
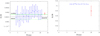 |
Fig. 7 Left: D/H ratio measured in the unlabelled residue. The red dot indicates the polystyrene standard sample value. Solid green line indicates the mean D/H ratio of the residue, dashed black line indicates the VSMOW value, and dashed green line indicates the initial D/H ratio of the icy sample, obtained via the analysis of the N2 -CH4 bottle; see text for details. Each blue point in the figure represents the sum of 10 initial acquisition stacks to ensure significant number of counts per stack. Right: D/H ratio measured in the labelled residue. The red dot delineates the estimated initial value based on IR CD4 and CH4 bands ratiosusing Eq. (1). |
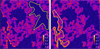 |
Fig. 8 D/H images of the residue obtained from the labelled ice with two ROIs defined by yellow contour. Left: ROI of the cold region. Right: ROI of the hot region. The stack by stack D/H measurements in the bulk image, the hot region ROI and the cold region ROI are shown in Fig. 9. Sample size is 60 × 60 μm. |
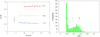 |
Fig. 9 Left: D/H ratio measured in the labelled residue from a hot region (red), the bulk (green), and a cold region (blue). Black point indicates the D/H estimated from the IR ice mixture spectra prior to irradiation. Right: D/H histogram with dots corresponding to the hot (red), bulk (green), and cold (blue) D/H values. |
5.1.2 Timescale
The interaction of high energy ions from the GCR with the surface of objects orbiting at far heliocentric distances (in the Kuiper Belt or in the Oort cloud region) have been studied for more than a decade (e.g. Cooper et al. 1998, 2003). These swift ions penetrate icy surfaces and deposit energy along their tracks. Ultraviolet photons may also contribute to the deposited energy, but they affect a much lower ice volume, as their penetration depth does not exceed a few to hundreds of nanometers. The dose deposited by cosmic rays at large heliocentric distances can be modelled using a functional form for the ions differential flux (Shen et al. 2004). Including the respective Galactic abundance of elements and integrated over a wide energy range, Shen et al. (2004) give a mean deposited energy of about 6 × 10⁻¹⁵ eV molecule−1 s−1 in ices, corresponding to an ionization rate of about 3 × 10⁻¹⁷s−1. We irradiated our samples up to a total dose of 19 eV molecule−1 (≈4.0 × 10²³ eV cm−3), corresponding to about 100 million years of exposition to the GCR. This time is small compared to the solar system age and thus fully compatible with the astrophysical timescale of irradiation of small bodies after their formation. The irradiation period is therefore not time-constrained. It contrasts with the scenarios restricted to a hypothetical high irradiation episode occurring during the protoplanetary phase, such as in Laurent et al. (2015) and Gavilan et al. (2017). The results we obtained show that within 108 years, irradiation by GCR of ices layers can transfer and process the various D/H ratios of the ices in a refractory poly-HCN-like residue which presents isotopic heterogeneities and an IR spectrum similar to that observed in organic matter from UCAMMs.
D/H obtain after irradiation with various projectile.
5.2 Electron and photon irradiation
The effect of irradiation in interplanetary organics have been studied by numerous authors, after the discovery of an induced D/H fractionation in samples analysed by transmission electron microscopy (de Gregorio et al. 2010). Laurent et al. (2015) exposed polymers to electron irradiation and Gavilan et al. (2017) exposed tholins to X-ray photon irradiation. Both studies aimed at reproducing the radiative environment endured by organic matter in the protoplanetary disc. The first experiment used 30 keV electrons with a dose up to 1.7 × 1025 eV cm−3 and the second 0.5 and 1.3 keV X-rays with a dose up to 2.28 × 1028 eV cm−3 (see Table 2). Both experiments were performed at room temperature. These correspond to a dose of approximately 800 eV molecule−1 and 1 MeV molecule−1, respectively, and amount to 40 and 50 × 104 times the dose used in the present work. The astrophysical context in which such extreme doses may be reached is far from trivial. The scenario proposed by Gavilan et al. (2017) imples an exposure time of 1 Myr at 10 AU to the X-ray flux from a young T Tauri star assuming a total absorption of X-rays by the material. However, the typical penetration depth of such X-rays is at most a few microns in a solid. The total volume of matter in the disc that can be affected by such a process (up to the dose required to reach the isotopic plateaus) is small. In the X-ray case, reaching 1024 eV cm−2 over 1 Myr would mean 3.17 × 10¹⁰ eV cm−2 s−1, implying for 1 keV photons a region with a flux of about 3 × 10⁷ X-ray photons cm−2 s−1. Only the very upper part of a disc, even with a high X-ray flux young protostar can reach such values. The internal parts and midplane, where most of the mass resides, are exposed to less than 105 photons cm−2 s−1 (see Fig. 1 in Anderson et al. 2017). Therefore, the fraction of mass affected is, at most, orders of magnitude lower than the mass of the protoplanetary disc.
Moreover, in these two experiments the observed D enrichments are substantially smaller than those reported in meteorites or micrometeorites organics. The NanoSIMS measurements of irradiated samples by Laurent et al. (2014) and Gavilan et al. (2017) reported maximum D enrichment of about 600‰ to about 900‰. The δD in carbonaceous chondrites range from 650 to more than 2500‰ (Robert et al. 1981; Alexander et al. 2010) and Remusat et al. (2007) found values up to 5500‰ in the Orgueil meteorite. In IDPs and UCAMMs, δD values over 10 000‰ are reported (Duprat et al. 2010; Messenger 2002). In addition, the D/H ratios from Laurent et al. (2014) and Gavilan et al. (2017) in irradiated material reach a plateau after a threshold dose, implying that higher doses do not lead to higher δD compatible with the high values observed in the most D-rich components of interplanetary organics.
Finally, if exposed to extreme irradiation doses, the internal structure of the organic matter evolves drastically and we also expect a substantial loss of H. In Fig. 5 from Gavilan et al. (2017), the IR spectra after irradiation show an almost complete destruction of the initial organic matter structure, which is not compatible with IOM spectra. It is probable that the D/H ratio evolves with the total amount of  in these irradiated samples and that the high D/H may be related to a highly H-depleted organic compound fraction. All these elements indicate that irradiation processes alone cannot be the source for the large isotopic fractionation found in extraterrestrial organic matter.
6 Conclusions
We explored the formation of deuterium spatial anomalies found in the interplanetary organic matter by irradiation of isotopically homogeneous and heterogeneous (unlabelled and labelled) ices. The irradiation simulated the effect of GCRs on icy bodies surfaces in the outer solar system region, beyond the nitrogen snow line. We irradiated two ice mixtures: one N2 -CH4 (90:10) and one with a thin layer of CD4 between two thick N2 -CH4 (90:10) layers. The irradiation with swift heavy ions was monitored with FTIR spectroscopy and we observed the formation of numerous molecules and radicals, some of which contain deuterium. During the irradiation and annealing of the ices, these molecules and radicals reacted and formed a refractory poly-HCN-like material that is stable at room temperature. The NanoSIMS analyses conducted on residues produced from unlabelled ice demonstrate that no significant D enrichment arises from the irradiation process itself. The residue obtained from unlabelled ices exhibits a homogeneous D/H ratio with a bulk value similar to that of the terrestrial standard, which has a mean D enrichment δD ≈ 420 ± 135‰. In contrast, the residue obtained from labelled ices exhibits highly heterogeneous D/H ratios but with a bulk value compatible with that of the bulk ratio of irradiated labelled ices. Some IR features of the residue obtained by irradiation of labelled ices are associated with C-D stretch modes, confirming the incorporation of deuterium in the organic material.
The results suggest that the solar system radiative environment cannot account for a reasonable astrophysical timescale for high D enrichments with hotspots up to few thousands permil in meteorites Remusat et al. (2007) and more than 10 000‰ in IDPs andUCAMMs (Duprat et al. 2010; Messenger 2002). The results obtained on isotopically labelled ices demonstrate that initial isotopic inhomogeneities in the ices are efficiently transferred to the organic matter resulting by irradiation by high energy ions. The residue obtained by irradiation of thin layers of ices with highly heterogeneous D/H ratios produce a residue with extreme D-rich areas on micron and sub-micron scales. The exact structure of the D-rich hotspot anomalies depend on the local irradiation induced production and diffusion of the D-rich reservoir, that is, the distribution of the precursor ice mixtures and the isotopic gradients of the ice.
Several experiments will be conducted to address and constrain the astrophysical scenario better in the near future. Nonetheless, present experiments show that it might be possible that these heterogeneities found in UCAMM organic matter are the footprints and witnesses of the chemical history of the parent body.
Acknowledgements
This work was supported by project grants ANR IGLIAS (ANR-13-BS05-0004) and COMETOR (ANR-18-CE31-0011-01) of the French Agence Nationale de la Recherche and funding from DIM-ACAV, IN2 P3, LABEX P2IO, Univ. Paris Saclay, and CNES. E.D. acknowledges financial support by the French IN2 P3-INSU-CNRS programme “Physique et Chimie du Milieu Interstellaire” (PCMI). We thank T. Been, C. Grygiel, T. Madi, I. Monnet, F. Ropars, and J.M. Ramillion for their invaluable support. The authors acknowledge the entire staff of the GANIL facility for providing the ion beams essential for these experiments.
Appendix A Infrared features and assignments
Infrared features measured at 9 K in both samples before and during irradiation and their possible assignments.
References
- Aikawa, Y., van Zadelhoff, G. J., van Dishoeck, E. F., & Herbst, E. 2002, A&A, 386, 622 [NASA ADS] [CrossRef] [EDP Sciences] [Google Scholar]
- Aikawa, Y., Wakelam, V., Hersant, F., Garrod, R. T., & Herbst, E. 2012, ApJ, 760, 40 [NASA ADS] [CrossRef] [Google Scholar]
- Aléon, J., Engrand, C., Robert, F., & Chaussidon, M. 2000, Meteorit. Planet. Sci., 35, A19 [CrossRef] [Google Scholar]
- Alexander, C. M. O. D., Newsome, S. D., Fogel, M. L., et al. 2010, Geochim. Cosmochim. Acta, 74, 4417 [NASA ADS] [CrossRef] [Google Scholar]
- Alexander, C. M. O. D., Cody, G. D., De Gregorio, B. T., Nittler, L. R., & Stroud, R. M. 2017, Chem. Erde Geochem., 77, 227 [CrossRef] [Google Scholar]
- Altwegg, K., Balsiger, H., Bar-Nun, A., et al. 2014, Science, 347, 6220 [Google Scholar]
- Anderson, D. E., Bergin, E. A., Blake, G. A., et al. 2017, ApJ, 845, 13 [NASA ADS] [CrossRef] [Google Scholar]
- Augé, B., Dartois, E., Engrand, C., et al. 2016, A&A, 592, A99 [NASA ADS] [CrossRef] [EDP Sciences] [Google Scholar]
- Augé, B., Been, T., Boduch, B., et al. 2018, Rev. Sci. Instrum., 89, 075105 [NASA ADS] [CrossRef] [Google Scholar]
- Bardin, N., Duprat, J., Slodzian, G., et al. 2015, Int. J. Mass Spectrom., 393, 17 [CrossRef] [Google Scholar]
- Bennett, C. J., Jamieson, C. S., Osamura, Y., & Kaiser, R. I. 2015, ApJ, 653, 792 [Google Scholar]
- Bockelee-Morvan, D., Gautier, D., Lis, D. C., et al. 1998, Icarus, 133, 147 [NASA ADS] [CrossRef] [Google Scholar]
- Bockelee-Morvan, D., Calmonte, U., Charnley, S., et al. 2015, Space Sci. Rev., 197, 47 [NASA ADS] [CrossRef] [Google Scholar]
- Bottger, G. L., Eggers, Jr, D. F. 1964, J. Chem. Phys., 40, 2010 [NASA ADS] [CrossRef] [Google Scholar]
- Brown, M. E., Burgasser, A. J., & Fraser, W. C. 2011, ApJ, 738, L26 [NASA ADS] [CrossRef] [Google Scholar]
- Burgdorf, M., Cruikshank, D. P., Dalle Ore, C. M., & Sekiguchi, T. 2010, ApJ, 718, L53 [NASA ADS] [CrossRef] [Google Scholar]
- Calvani, P., Lupi, S., & Maselli, P. 1989, J. Chem. Phys., 91, 6737 [NASA ADS] [CrossRef] [Google Scholar]
- Ceccarelli, C., Caselli, P., Bockelee-Morvan, D., et al. 2014, Protostars and Planet VI (Tucson: University of Arizona Press), 859 [Google Scholar]
- Charon, E., Engrand, C., Benzerara, K. 2017, Lunar Planet. Sci. Conf., 48, 2085 [NASA ADS] [Google Scholar]
- Cooper, J. F., Christian, E. R., & Johnson, R. E. 1998, Adv. Space Res., 21, 1611 [NASA ADS] [CrossRef] [Google Scholar]
- Cooper, J. F., Christian, E. R., Richardson, J. D., & Wang, C. 2003, Earth Moon Planet., 92, 261 [Google Scholar]
- Cruikshank, D. P., Grundy, W. M., DeMeo, F. E., et al. 2015, Icarus, 246, 82 [NASA ADS] [CrossRef] [Google Scholar]
- Dartois, E., Engrand, C., Brunetto, R., et al. 2013, Icarus, 224, 243 [NASA ADS] [CrossRef] [Google Scholar]
- Dartois, E., Engrand, C., Duprat, J., et al. 2018, A&A, 609, A65 [NASA ADS] [CrossRef] [EDP Sciences] [Google Scholar]
- de Barros, A. L. F., da Silveira, E. F., Bergantini, A., Rothard, H., & Boduch, P. 2015, ApJ, 810, 156 [NASA ADS] [CrossRef] [Google Scholar]
- de Gregorio, B. T., Stroud, R. M., Nittler, L. R., et al. 2010, Geochim. Cosmochim. Acta, 74, 4454 [NASA ADS] [CrossRef] [Google Scholar]
- Duprat, J., Dobrică, E., Engrand, C., et al. 2010, Science, 328, 742 [NASA ADS] [CrossRef] [PubMed] [Google Scholar]
- Flynn, G. J., Keller, L. P., Feser, M., Wirick, S., & Jacobsen, C. 2003, Geochim. Cosmochim. Acta, 67, 24 [Google Scholar]
- Gavilan, L., Remusat, L., Roskosz, M., et al. 2017, ApJ, 840, 35 [NASA ADS] [CrossRef] [Google Scholar]
- Geiss, J., & Reeves, H. 1972, A&A, 18, 126 [NASA ADS] [Google Scholar]
- Geiss, J., & Reeves, H. 1981, A&A, 93, 189 [Google Scholar]
- Gerakines, P. A., Schutte, P. A., & Ehrenfreund, P. 1996, A&A, 312, 289 [Google Scholar]
- Gerakines, P. A., Moore, M. H., & Hudson, R. L. 2004, Icarus, 170, 202 [NASA ADS] [CrossRef] [Google Scholar]
- Gourier, D., Robert, F., Delpoux, O., et al. 2008, Geochim. Cosmochim. Acta, 72, 1914 [NASA ADS] [CrossRef] [Google Scholar]
- Grundy, W. M., Binzel, R. P., Buratti, B. J., et al. 2016, Science, 351, aad9189 [NASA ADS] [CrossRef] [Google Scholar]
- Hartogh, P., Lis, D. C., Bockelée-Morvan, D., et al. 2011, Nature, 478, 218 [NASA ADS] [CrossRef] [PubMed] [Google Scholar]
- Hayatsu, R., Matsuoka, S., Scott, R. G., Studier, M. H., & Anders, E. 1977, Geochim. Cosmochim. Acta, 41, 9 [NASA ADS] [CrossRef] [Google Scholar]
- He, J., Gao, K., Vidali, G., Bennett, C. J., & Kaiser, R. I. 2010, ApJ, 721, 1656 [NASA ADS] [CrossRef] [Google Scholar]
- Hudson, R. L., & Moore, M. H. 2002, ApJ, 568, 1095 [NASA ADS] [CrossRef] [Google Scholar]
- Jheeta, S., Domaracka, A., Ptasinkaa, S., Sivaramand, B., & Masona, J. 2013, Chem. Phys. Lett., 556, 359 [NASA ADS] [CrossRef] [Google Scholar]
- Laurent, B., Roskosz, M., Remusat, L., et al. 2014, Geochim. Cosmochim. Acta, 142, 522 [NASA ADS] [CrossRef] [Google Scholar]
- Laurent, B., Roskosz, M., Remusat, L., et al. 2015, Nat. commun., 6, 8567 [NASA ADS] [CrossRef] [Google Scholar]
- Lecluse, C., & Robert, F. 1994, Geochim. Cosmochim. Acta, 58, 2927 [NASA ADS] [CrossRef] [Google Scholar]
- Lecluse, C., Robert, F., Gautier, D., & Guiraud, M. 1996, Planet. Space Sci., 44, 1579 [NASA ADS] [CrossRef] [Google Scholar]
- Licandro, J., Grundy, W. M., Pinilla-Alonso, N., & Leisy, P. 2006, A&A, 458, L5 [NASA ADS] [CrossRef] [EDP Sciences] [Google Scholar]
- Lorenzi, V., Pinilla-Alonso, N., & Licandro, J. 2015, A&A, 577, A86 [NASA ADS] [CrossRef] [EDP Sciences] [Google Scholar]
- Mahaffy, P. R., Donahue, T. M., Atreya, S. K., Owen, T. C., & Niemann, H. B. 1998, Space Sci. Rev., 84, 251 [NASA ADS] [CrossRef] [Google Scholar]
- McKeegan, K. D., Aléon, J., Bradley, J., et al. 2006, Science, 314, 1724 [NASA ADS] [CrossRef] [PubMed] [Google Scholar]
- Meier, R., Owen, T. C., Jewitt, D. C., et al. 1998, Science, 279, 1707 [NASA ADS] [CrossRef] [PubMed] [Google Scholar]
- Messaoudi, C., Boudier, T., Sorzano, C. O. S., & Marco, S. 2007, BMC Bioinformatics, 8, 288 [CrossRef] [PubMed] [Google Scholar]
- Messenger, S. 2002, Planet. Space Sci., 50, 1221 [NASA ADS] [CrossRef] [Google Scholar]
- Moore, M. H., & Hudson, R. L. 1998, Icarus, 135, 518 [NASA ADS] [CrossRef] [Google Scholar]
- Moore, M. H., & Hudson, R. L. 2003, Icarus, 161, 486 [NASA ADS] [CrossRef] [Google Scholar]
- Nakamura, T., Noguchi, T., Ozono, Y., Osawa, T., & Nagao, K. 2005, Meteorit. Planet. Sci. Supp., 40, 5046 [NASA ADS] [Google Scholar]
- Oberg, K. I., Garrod, R. T., van Dishoeck, E. F., & Linnartz, H. 2009, A&A, 504, 891 [NASA ADS] [CrossRef] [EDP Sciences] [Google Scholar]
- Palumbo, M. E., & Strazzulla, G. 1993, A&A, 269, 568 [NASA ADS] [Google Scholar]
- Parise, B., Ceccarelli, C., Tielens, A. G. G. M., et al. 2006, A&A, 435, 949 [NASA ADS] [CrossRef] [EDP Sciences] [Google Scholar]
- Protopapa, S., Berry, K. L., Binzel, R. P., et al. 2016, 47th Lunar Planet. Sci. Conf. [Google Scholar]
- Remusat, L., Robert, F., & Derenne, S. 2007, C. R. Geosci., 339, 895 [NASA ADS] [CrossRef] [Google Scholar]
- Robert, F., & Epstein, S. 1981, Geochim. Cosmochim. Acta, 46, 81 [NASA ADS] [CrossRef] [Google Scholar]
- Roueff, E., Lis, D. C., van der Tak, F. F. S., Gerin, M., & Goldsmith, P. F. 2005, A&A, 438, 585 [NASA ADS] [CrossRef] [EDP Sciences] [Google Scholar]
- Sakai, N., Sakai, T., Hirota, T., & Yamamoto, S. 2009, ApJ, 702, 1025 [NASA ADS] [CrossRef] [Google Scholar]
- Sandford, S. A., & Allamandola, L. J. 1993, ApJ, 417, 815 [NASA ADS] [CrossRef] [PubMed] [Google Scholar]
- Satorre, M. Á., Domingo, M., Millán, C., et al. 2008, Planet. Space Sci., 46, 1748 [NASA ADS] [CrossRef] [Google Scholar]
- Schaller, E. L., & Brown, M. E. 2007, ApJ, 659, L61 [NASA ADS] [CrossRef] [Google Scholar]
- Schneider, C. A., Rasband, W. S., & Eliceiri, K. W. 2012, Nat. Methods, 9, 671 [CrossRef] [PubMed] [Google Scholar]
- Schutte, W. A., & Khanna, R. K. 2003, A&A, 398, 1049 [NASA ADS] [CrossRef] [EDP Sciences] [Google Scholar]
- Shen, C. J., Greenberg, J. M., Schutte, W. A., & van Dishoeck, E. F. 2004, A&A, 415, 203 [NASA ADS] [CrossRef] [EDP Sciences] [Google Scholar]
- Slodzian, G., Wu, T. D., Bardin, N., et al. 2014, Microsc. Microanal., 20, 577 [NASA ADS] [CrossRef] [Google Scholar]
- Slodzian, G., Wu, T. D., Duprat, J., Engrand, C., & Guerquin-Kern, J. L. 2017, Nucl. Inst. Methods Phys. Res. B, 412, 123 [NASA ADS] [CrossRef] [Google Scholar]
- Wu, Y. J., Chen, H. F., Chuang, S. J., & Huang, T. P. 2013, ApJ, 768, 83 [NASA ADS] [CrossRef] [Google Scholar]
- Yabuta, H., Itoh, S., Noguchi, T., et al. 2012a, Lunar Planet. Sci. Conf., 43, 2239 [NASA ADS] [Google Scholar]
- Yabuta, H., Itoh, S., Noguchi, T., et al. 2012b, Annual Meeting of the Meteoritical Society, 75, 5196 [Google Scholar]
- Yabuta, H., Noguchi, T., Itoh, S., et al. 2017, Geochim. Cosmochim. Acta, 214, 172 [NASA ADS] [CrossRef] [Google Scholar]
- Yung, Y. L., Friedl, R. R., Pinto, J. P., Bayes, K. D., & Wen, J. S. 1988, Icarus, 74, 121 [NASA ADS] [CrossRef] [Google Scholar]
- Ziegler, J. F., Ziegler, M. D., & Biersack, J. P. 2010, Nucl. Inst. Methods Phys. Res. B, 268, 1818 [Google Scholar]
The δD value is the relative difference to the VSMOW value taken as a reference, expressed in permil ( ).
).
All Tables
Infrared features measured at 9 K in both samples before and during irradiation and their possible assignments.
All Figures
|
Fig. 1 Cross-cut of the IGLIAS set-up in the optical plane with three substrate windows, the moving needle used to inject gas inside the main chamber and the FTIR spectrometer. |
| In the text | |
|
Fig. 2 Evolution of the electronic stopping power (Se, calculated with SRIM code, see text for details) as a function of the projectile ion range inside two samples: a N2 -CH4 (90:10) ice and a N2-CH4 (90:10) ice with a thin layer (0.1 μm) of CD4 inside. |
| In the text | |
|
Fig. 3 Infrared spectra from 4500 to 700 cm−1 from the N2-CH4 (left) and the N2-CH4+CD4 ices (right). The bottom spectra are the initial deposited ice (multiply by 0.2 for visibility), the middle spectra are those after a total dose of 8 eV molecule−1, and top spectra are the final spectra taken at 19 eV molecule−1. Arrows (triangles) below the IR spectra (right panel) indicate the CD4 (CH4) bands used to estimate the initial D/H ratio from the labelled ice according to Eq. (1). |
| In the text | |
|
Fig. 4 Infrared spectra from 4000 to 1000 cm−1 for the N2-CH4 (left) and the N2-CH4+CD4 ices (right). Spectra are taken at different temperatures during the slow warming-up (0.1 K min−1). No spectra were recorded for the D-rich ice between 100 and 300 K because of a technical problem with the repeated recording feature FTIR spectrometer. |
| In the text | |
|
Fig. 5 Room temperature spectra from the irradiated N2-CH4 (middle, in red) and the N2 -CH4+CD4 (top, in green) ice mixtures. Functional groups identifications are given. The blue spectrum is a subtraction between green and red spectra; see text for details. Infrared spectrum of a UCAMM (DC060565) is given in black for comparison; see Augé et al. (2016) for a detailed analysis of the nitrile and isonitrile bands intensity. |
| In the text | |
|
Fig. 6 Left: optical picture of the unlabelled residue. Right: C |
| In the text | |
|
Fig. 7 Left: D/H ratio measured in the unlabelled residue. The red dot indicates the polystyrene standard sample value. Solid green line indicates the mean D/H ratio of the residue, dashed black line indicates the VSMOW value, and dashed green line indicates the initial D/H ratio of the icy sample, obtained via the analysis of the N2 -CH4 bottle; see text for details. Each blue point in the figure represents the sum of 10 initial acquisition stacks to ensure significant number of counts per stack. Right: D/H ratio measured in the labelled residue. The red dot delineates the estimated initial value based on IR CD4 and CH4 bands ratiosusing Eq. (1). |
| In the text | |
|
Fig. 8 D/H images of the residue obtained from the labelled ice with two ROIs defined by yellow contour. Left: ROI of the cold region. Right: ROI of the hot region. The stack by stack D/H measurements in the bulk image, the hot region ROI and the cold region ROI are shown in Fig. 9. Sample size is 60 × 60 μm. |
| In the text | |
|
Fig. 9 Left: D/H ratio measured in the labelled residue from a hot region (red), the bulk (green), and a cold region (blue). Black point indicates the D/H estimated from the IR ice mixture spectra prior to irradiation. Right: D/H histogram with dots corresponding to the hot (red), bulk (green), and cold (blue) D/H values. |
| In the text | |
Current usage metrics show cumulative count of Article Views (full-text article views including HTML views, PDF and ePub downloads, according to the available data) and Abstracts Views on Vision4Press platform.
Data correspond to usage on the plateform after 2015. The current usage metrics is available 48-96 hours after online publication and is updated daily on week days.
Initial download of the metrics may take a while.