Fig. 7
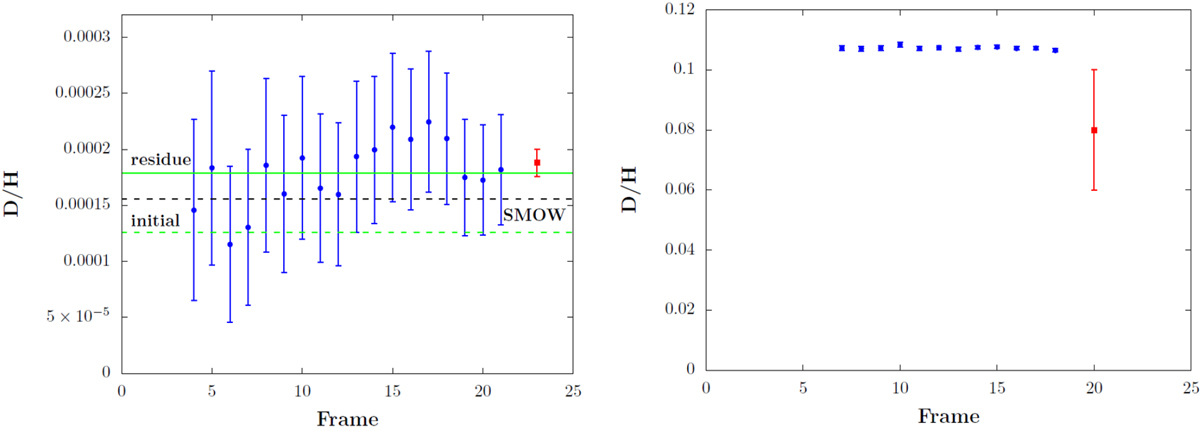
Left: D/H ratio measured in the unlabelled residue. The red dot indicates the polystyrene standard sample value. Solid green line indicates the mean D/H ratio of the residue, dashed black line indicates the VSMOW value, and dashed green line indicates the initial D/H ratio of the icy sample, obtained via the analysis of the N2 -CH4 bottle; see text for details. Each blue point in the figure represents the sum of 10 initial acquisition stacks to ensure significant number of counts per stack. Right: D/H ratio measured in the labelled residue. The red dot delineates the estimated initial value based on IR CD4 and CH4 bands ratiosusing Eq. (1).
Current usage metrics show cumulative count of Article Views (full-text article views including HTML views, PDF and ePub downloads, according to the available data) and Abstracts Views on Vision4Press platform.
Data correspond to usage on the plateform after 2015. The current usage metrics is available 48-96 hours after online publication and is updated daily on week days.
Initial download of the metrics may take a while.