Fig. 3
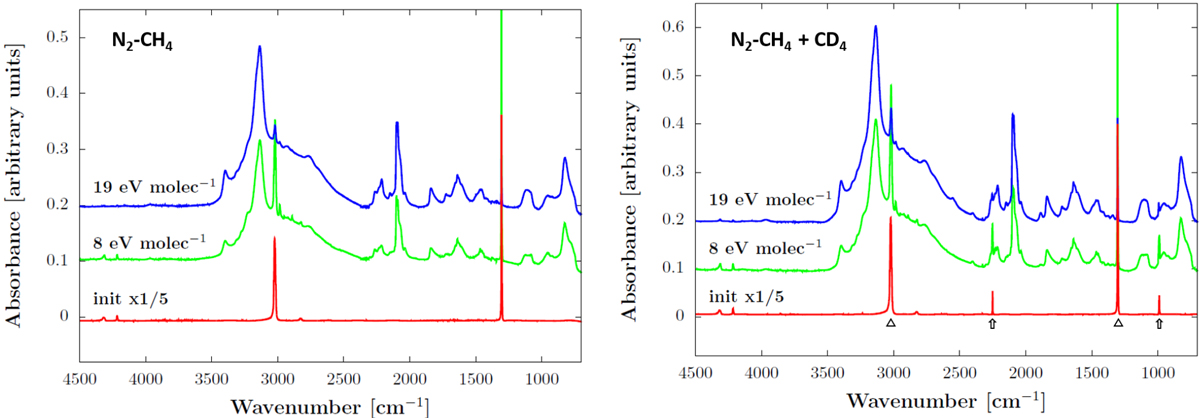
Infrared spectra from 4500 to 700 cm−1 from the N2-CH4 (left) and the N2-CH4+CD4 ices (right). The bottom spectra are the initial deposited ice (multiply by 0.2 for visibility), the middle spectra are those after a total dose of 8 eV molecule−1, and top spectra are the final spectra taken at 19 eV molecule−1. Arrows (triangles) below the IR spectra (right panel) indicate the CD4 (CH4) bands used to estimate the initial D/H ratio from the labelled ice according to Eq. (1).
Current usage metrics show cumulative count of Article Views (full-text article views including HTML views, PDF and ePub downloads, according to the available data) and Abstracts Views on Vision4Press platform.
Data correspond to usage on the plateform after 2015. The current usage metrics is available 48-96 hours after online publication and is updated daily on week days.
Initial download of the metrics may take a while.