Open Access
Fig. 8
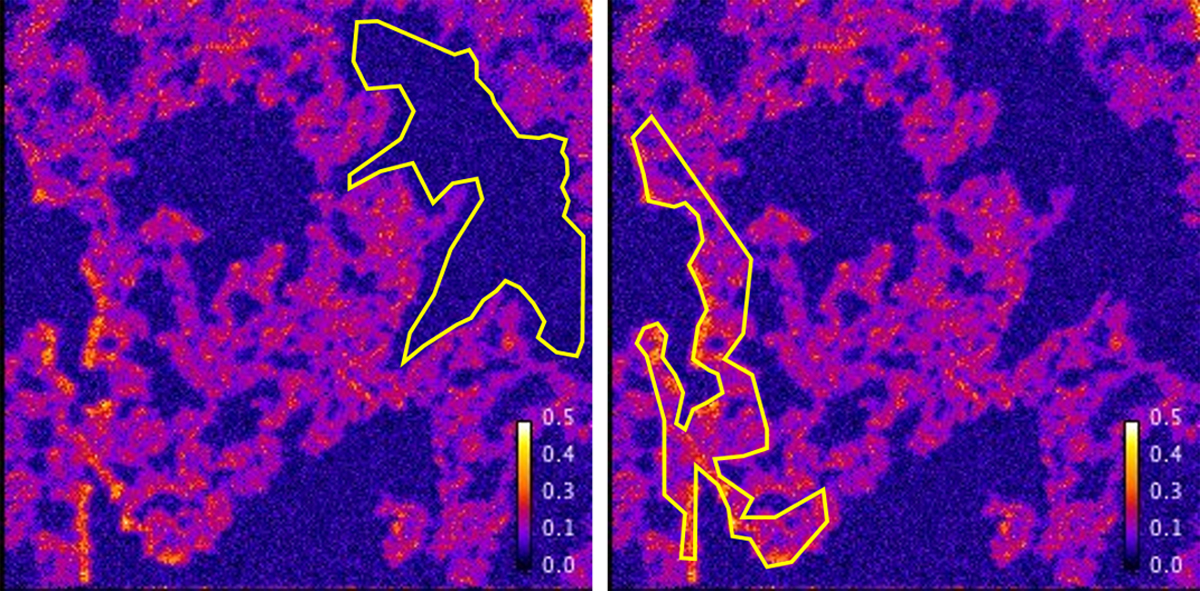
D/H images of the residue obtained from the labelled ice with two ROIs defined by yellow contour. Left: ROI of the cold region. Right: ROI of the hot region. The stack by stack D/H measurements in the bulk image, the hot region ROI and the cold region ROI are shown in Fig. 9. Sample size is 60 × 60 μm.
Current usage metrics show cumulative count of Article Views (full-text article views including HTML views, PDF and ePub downloads, according to the available data) and Abstracts Views on Vision4Press platform.
Data correspond to usage on the plateform after 2015. The current usage metrics is available 48-96 hours after online publication and is updated daily on week days.
Initial download of the metrics may take a while.