Fig. 4
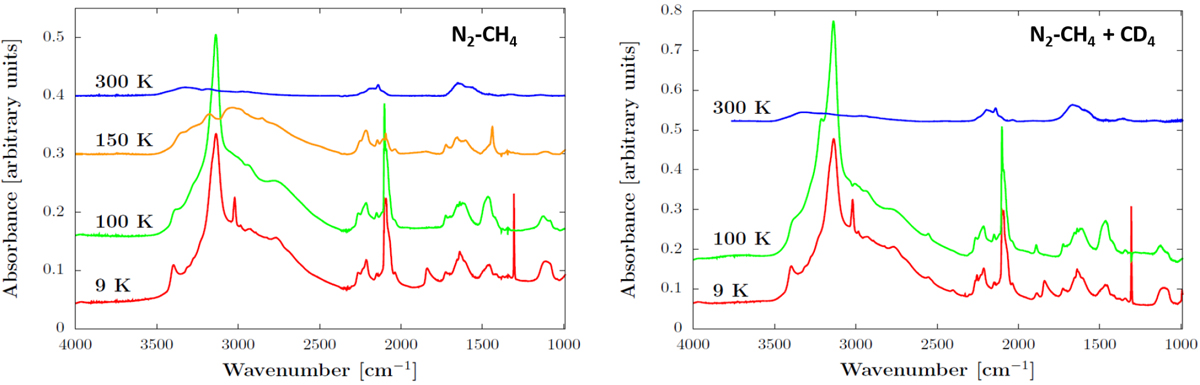
Infrared spectra from 4000 to 1000 cm−1 for the N2-CH4 (left) and the N2-CH4+CD4 ices (right). Spectra are taken at different temperatures during the slow warming-up (0.1 K min−1). No spectra were recorded for the D-rich ice between 100 and 300 K because of a technical problem with the repeated recording feature FTIR spectrometer.
Current usage metrics show cumulative count of Article Views (full-text article views including HTML views, PDF and ePub downloads, according to the available data) and Abstracts Views on Vision4Press platform.
Data correspond to usage on the plateform after 2015. The current usage metrics is available 48-96 hours after online publication and is updated daily on week days.
Initial download of the metrics may take a while.