| Issue |
A&A
Volume 625, May 2019
|
|
|---|---|---|
| Article Number | A74 | |
| Number of page(s) | 8 | |
| Section | Atomic, molecular, and nuclear data | |
| DOI | https://doi.org/10.1051/0004-6361/201834149 | |
| Published online | 15 May 2019 | |
Reaction of NH+, NH2+, and NH3+ ions with H2 at low temperatures
The pathway to ammonia production in the interstellar medium
Department of Surface and Plasma Science, Faculty of Mathematics and Physics, Charles University, V Holešovičkách 2, 180 00 Prague, Czech Republic
e-mail: stepan.roucka@mff.cuni.cz
Received:
28
August
2018
Accepted:
23
March
2019
Aims. We present an experimental investigation of the exothermic reactions of NH+, NH2+, and NH3+ ions with H2 at temperatures relevant for interstellar clouds.
Methods. The reactions were studied using a variable-temperature 22-pole radio frequency ion trap instrument.
Results. The temperature dependences of rate coefficients of these reactions have been obtained at temperatures from 15 up to 300 K. The reaction of NH+ with H2 has two channels, which lead to NH2+ ( ∼ 97%) and H+3 ( ∼ 3%) with nearly constant reaction rate coefficients (kaNH+(17 K) = 1.0 × 10⁻⁹ cm3 s−1 and kbNH+(17 K) = 4.0 × 10⁻¹¹ cm3 s−1, respectively). The reaction of NH2+ with H2 produces only NH3+ ions. The measured rate coefficient monotonically decreases with increasing temperature from kNH2+(17 K) = 6 × 10⁻¹⁰ cm3 s−1 to kNH2+(300 K) = 2 × 10⁻¹⁰ cm3 s−1. The measured rate coefficient of the reaction of NH3+ with H2, producing NH+4, increases with decreasing temperature from 80 K down to 15 K, confirming that the reaction proceeds by tunnelling through a potential barrier.
Key words: astrochemistry / molecular data / molecular processes / methods: laboratory: molecular / ISM: molecules
© ESO 2019
1. Introduction
Nitrogen is among the six most abundant elements in the Universe. Owing to the dominance of hydrogen in the Universe, it is not surprising that nitrogen hydrides are present in the interstellar medium (ISM). Ammonia was the first polyatomic molecule discovered in interstellar space (Cheung et al. 1968). Later, other nitrogen hydrides were detected: NH by Meyer & Roth (1991), NH2 by van Dishoeck et al. (1993), and NH3D+ by Cernicharo et al. (2013). Atomic and molecular nitrogen were also observed in the ISM (Nieva & Przybilla 2012; Knauth et al. 2004). For information on recent observations of nitrogen hydrides, see the results from the Herschel/HIFI instrument (Persson et al. 2010, 2012; Caselli et al. 2017), and from the SOFIA instrument (Wyrowski et al. 2016). For a detailed description of interstellar chemistry of nitrogen hydrides, see for example Rist et al. (2013) and Harju et al. (2017) and the reviews by Le Gal et al. (2014), Gerin et al. (2016), and Acharyya & Herbst (2015). Despite some differences between observed values and the modelled predictions of populations of nitrogen hydrides (see e.g. Le Gal et al. 2014; Persson et al. 2012; Novotný et al. 2014 and references therein), it is generally accepted that the main pathway to gas-phase formation of ammonia in the ISM is a chain of hydrogen abstraction reactions followed by the dissociative recombination of NH (Herbst & Klemperer 1973; Le Gal et al. 2014; Gerin et al. 2016). The suggested pathway of the gas-phase formation of the NH
 in the ISM starting from N+ is (Le Gal et al. 2014)

In current understanding of nitrogen chemistry, the production of N+ in the low-temperature (10 K) dark clouds results from dissociative ionization of N2 in reaction with He+ (Hily-Blant et al. 2013; Le Gal et al. 2014). Alternatively, the chain may also be initiated by  , although this reaction has a high activation energy (Herbst et al. 1987; Scott et al. 1997; Le Gal et al. 2014). It is expected that neutral NH3 molecules are consequently formed in the dissociative recombination of
  ions with electrons. Other hydrides can also be formed by the recombination of ions from this sequence with electrons (Florescu-Mitchell & Mitchell 2006). To model the production of ammonia in the ISM it is important to know the rate coefficients of all the reactions in the chain (1) for temperatures down to 10 K.
The first binary ion-molecule reaction of the chain is

with a corresponding reaction rate coefficient denoted as kN+. Since the enthalpy of this reaction is not yet known with sufficient precision, we provide the activation energy Ea obtained by Zymak et al. (2013). The enthalpies of the other hydrogen abstraction reactions were taken from Rist et al. (2013). This endothermic reaction of the N+ ion with molecular hydrogen has been studied using several well-established experimental techniques (e.g. Adams & Smith 1985; SIFDT, Marquette et al. 1988; CRESU, and Gerlich 1993; 22-pole ion trap). It has also been studied in our laboratory using the 22-pole ion trap instrument with consideration of para- and ortho-spin configurations of the reacting hydrogen molecule (Zymak et al. 2013; Plašil et al. 2014).
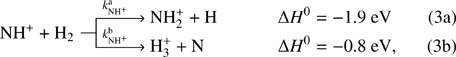
The next reaction of the chain (1) is
where  and
and  are reaction rate coefficients of channels with production of
  and H
and H , respectively. We also define the overall rate coefficient of the reaction of NH+ ion with H2 as
  . The enthalpy of the proton transfer channel (3b) was calculated from the corresponding proton affinities (Hunter & Lias 1998). Reaction (3) was studied at 300 K by Fehsenfeld et al. (1967; FA), Kim et al. (1975; ICR), and Adams et al. (1980; SIFT). At 15 K, it was studied by Gerlich (1993; ion trap). The production of H
 ion (reaction (3b)) was only reported by Adams et al. (1980).
The produced  ion further reacts with H2 in reaction
with a reaction rate coefficient  . This reaction was studied by Fehsenfeld et al. (1967; FA), Kim et al. (1975; ICR), and Adams et al. (1980; SIFT) at 300 K. Using an ion trap instrument, the rate coefficient of the reaction (4) was measured at 15 K by Gerlich (1993).
The final reaction of chain (1) is
with a rate coefficient  . This reaction was studied experimentally over broad range of temperatures by Fehsenfeld et al. (1975), Kim et al. (1975), Smith & Adams (1981), Luine & Dunn (1985), Böhringer (1985), Barlow & Dunn (1987), Adams & Smith (1984), and Gerlich (1993). It was also studied theoretically by Herbst et al. (1991) and recently by Álvarez-Barcia et al. (2016). At temperatures above 300 K, the measured temperature dependence of the rate coefficient of the exothermic reaction (5) exhibits dependence typical for endoergic reactions. If the temperature dependence of
  measured at temperatures above 300 K is extrapolated towards lower temperatures relevant for interstellar clouds using Arrhenius dependence (Fehsenfeld et al. 1975), then the values will be far too low to explain the observed NH3 abundances. This problem was solved when measurements at temperatures below 100 K indicated that the temperature dependence of the reaction rate coefficient has a local minimum, and then slowly increases with temperature decreasing below 50 K. These temperature dependences of rate coefficients of ion-molecule reactions with minimum have been observed several times (e.g. Smith & Adams 1981) and they are typical of exothermic reactions proceeding by tunnelling through a potential barrier (Ng et al. 1994). The observed increase in the reaction rate coefficient
  at low temperatures due to the tunnelling is sufficient for reaction (5) to play an important role in interstellar chemistry.
The recent observations of nitrogen hydrides in many areas of the ISM have led to the modelling of their production and destruction in the corresponding environments. This requires the knowledge of the rate coefficients of reactions playing a role in the production and destruction of nitrogen hydrides at temperatures down to 10 K. The present contribution reports the results of the studies of the reactions of ions NH+, NH , and NH
 with H2 at temperatures from 15 to 300 K using a 22-pole radio frequency (RF) ion trap. After a brief description of the instrument and typical measuring procedures, new data including measured temperature dependences of the reaction rate coefficients (
 ,
,  ,
,  , and
, and  ) are presented. The new results are compared with values from previous experiments and with available theoretical predictions.
2. Experiment and data analysis
The experiments were carried out by means of a linear RF 22-pole ion trap instrument operating at temperatures (T22PT) from 10 to 300 K. The basics of storing ions in RF fields have been described thoroughly by Gerlich (1992, 1995). Only a very short description of the apparatus and its operation are given here (for details, see e.g. Gerlich 1992; Gerlich et al. 2011; Plašil et al. 2011; Zymak et al. 2013). The ion trap is surrounded by a copper box, which is mounted onto a cold head of a closed-cycle helium refrigerator. Helium and hydrogen are introduced into the trap via leak valves and optionally in short pulses (∼10 ms) via a piezo valve (Gerlich 2008).
The primary reactant ions are produced by electron bombardment of the precursor gas in a storage ion source (SIS). In the present experiments, a mixture of N2 and H2 was used as a source gas. The produced ions were periodically extracted from the ion source and mass selected with a quadrupole mass filter. The mass-selected (primary) ions were transferred into the 22-pole ion trap, filled with a mixture of He buffer gas and H2 reactant gas. The helium number density used in the experiments was in the range of 1013 − 1014 cm−3 during the measurements and it was temporarily increased to 1015 cm−3 during the injection of ions into the trap by adding He via the piezo valve. In the present experiments, normal hydrogen was used as a reactant gas with number densities in the trap varying from 1010 up to 1012 cm−3. In normal H2, the para/ortho ratio is 1/3, corresponding to the thermal equilibrium at 300 K (for discussion, see Zymak et al. 2013; Hejduk et al. 2012). As the rotational excitation in hydrogen gas is thermalized only within para and ortho manifolds, H2 gas flowing through the gas inlet system into the trap volume is not thermalized at trap temperatures below 200 K (Zymak et al. 2013; Hejduk et al. 2015). The gas number density inside the ion trap is determined using a spinning rotor gauge and a calibrated ionization gauge with estimated uncertainty of 20%. This constant systematic uncertainty is not included in the error bars of our figures, which indicate the relative uncertainties.
At the number densities of He buffer gas and H2 reactant gas in the present experiment, the kinetic energy of the injected ion was cooled by hundreds of collisions with He atoms prior to colliding with H2. After various trapping times, the ions were extracted from the trap and after passing through a second quadrupole mass filter, they were detected with an MCP detector. The standard measuring procedure is based on filling the ion trap at a fixed frequency with a well-defined number of primary ions and by analysing the content of the ions in the ion trap after different trapping (reaction) times. The data are analysed under the assumption that the numbers of detected ions are proportional to the numbers of ions in the ion trap. In the following text these relative numbers of different ions of particular mass detected (counted) after trapping time t are denoted nx(t), where the index x refers to the various ions in the ion trap. For easier comparison of the experimental results, the data plotted in the figures were normalized by dividing by the total number of detected ions nΣ0 = ∑nx(t0), where t0 is the shortest trapping time. The symbol Σ(t) in the figures indicates the normalized total number of ions in the trap, Σ(t) = ∑nx(t)/nΣ0. The mass discrimination of the detection system is considered in the data analysis (see e.g. Kovalenko et al. 2018, for details) and for some ions (H in comparison with NH+), it was calibrated using a suitable chemical reaction (see Sect. 3.1).
In recent experiments with our apparatus (Zymak et al. 2013; Plašil et al. 2012; Roučka et al. 2018) and in other 22-pole ion trap experiments (Hauser et al. 2015; Endres et al. 2017) it has been confirmed that the collisional temperature (here denoted simply T) is slightly higher than the temperature of the copper box surrounding the ion trap (nominal ion trap temperature, T22PT). At the present experimental conditions, we can safely assume that the collisional temperature in the interaction of ions with H2 does not exceed the ion trap temperature by more than 10 K. For simplicity of presentation, we define the collisional temperature as T = T22PT + 5 K with an uncertainty of ±5 K.
To illustrate the character of the results from the ion trap experiment, the typical data measured in an experiment with injection of N+ ions into the ion trap filled with He buffer gas and H2 reactant gas are shown in Fig. 1. Plotted are the time evolutions of normalized numbers (nx(t)/nΣ0) of N+, NH+, NH , NH
, NH , NH
, NH , and H
 ions in the ion trap. The mass discriminations for particular ions are considered in the evaluation of the measured data. Owing to the large differences between the values of the rate coefficients of the reactions in chain (1), the data were collected in small time steps over a broad time interval. The dominant process after the injection of N+ ions is their reaction with H2 in which the NH+ ions are formed. The NH+ ions further react with H2, producing NH
 and H
and H . The NH
 ions consequently react with H2 to produce NH
 . Finally, the NH
 ions are produced in slow reactions of NH
 with H2. From the time evolution of the normalized number of H
 ions it can be seen that at very long trapping times H
 ions are slowly removed by reactions with N2 (see e.g. Marquette et al. 1989) that penetrates into the trap volume from the ion source:
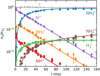 |
Fig. 1. Measured time evolutions of normalized numbers (nx(t)/nΣ0) of N+, NH+, NH |


At low temperatures (⪅40 K), this process becomes negligible because the number density of N2 in the trap is reduced by condensation on the walls of the trap.
The time evolution of the numbers of ions in the ion trap after injection of N+ ions can be described by the following set of differential balance equations, which can be derived from the chemical Eqs. (2)–(6):
The reactions are parametrized by the reaction rates rx, which are proportional to the reaction rate coefficients and the number densities of the neutral reactants, i.e. rx = kx[H2] in the case of reactions with H2 and ![$ r_{\mathrm{H}_{3}^{+}} = k_{\mathrm{H}_{3}^{+}}[\mathrm{N}_2] $](/articles/aa/full_html/2019/05/aa34149-18/aa34149-18-eq64.gif) in Eq. (9). The rate coefficients of the reactions (2)–(6) can therefore be determined by fitting the solution of the corresponding set of differential rate equations to the experimental data with the reaction rates and initial numbers of ions as free parameters. From the fitted rates rx at given hydrogen density [H2], we calculate the corresponding reaction rate coefficients as kx = rx/[H2]. An example of a fitted solution is also shown in Fig. 1.
in Eq. (9). The rate coefficients of the reactions (2)–(6) can therefore be determined by fitting the solution of the corresponding set of differential rate equations to the experimental data with the reaction rates and initial numbers of ions as free parameters. From the fitted rates rx at given hydrogen density [H2], we calculate the corresponding reaction rate coefficients as kx = rx/[H2]. An example of a fitted solution is also shown in Fig. 1.
In measurements with NH+ and NH primary ions, the system can be simplified by setting nN+ and (nN+, nNH+,
  ) to zero, respectively. Special attention should be paid to the possible excitation of the intermediate ions produced in the sequence of reactions in trap. Details concerning the studies of specific reactions are discussed in Sect. 3.
To confirm that the observed reaction rates are indeed caused by binary reactions with H2 and to evaluate the possible loss of ions due to other (background) processes, we measured the time evolutions of the relative numbers of the ions at several number densities of hydrogen in the ion trap. In these particular experiments, N+ ions were injected into the ion trap (see example in Fig. 1). The examples of the dependences of the reaction loss rates (rx) on [H2] for the reactions (2)–(5) measured at T = 18 K are shown in Fig. 2. The values of  were obtained from the fits of the measured time evolutions of relative number of ions at long trapping times, i.e. from evolutions of
  and
and  (not shown in Fig. 1; see Fig. 9 below). The linearity of the dependences plotted in Fig. 2 confirms that the time evolutions of the relative numbers of particular ions in the ion trap are controlled by binary ion-molecule reactions with H2. The measured loss rates can be expressed by the formula, rx = kx[H2]+rxbg, where rxbg is the background loss rate for particular ions. The corresponding binary reaction rate coefficients kN+, kNH+,
  , and
, and  are given by the slope of the plotted dependences. The value of kN+(18 K) = (1.0 ± 0.4)×10−10 cm3 s−1 obtained from the data plotted in Fig. 2 is in very good agreement with the values obtained in previous studies (Zymak et al. 2013). The values of the other reaction rate coefficients obtained from the data in Fig. 2 are discussed below.
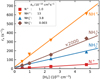 |
Fig. 2. Measured reaction loss rates rN+, rNH+, |


In order to increase the accuracy of the measured reaction rate coefficients for reactions of particular ions, these ions are produced in the SIS and injected into the ion trap. The corresponding reaction rate coefficient can then be calculated from the decay (time evolution) of the relative number of this particular ion. The obvious advantage of the determination of the rate coefficient from the decrease in the relative number of the studied ion is that the decrease in the relative number of the injected ions is influenced only by the reaction of particular ions with the reactant gas.
3. Results and discussion
3.1. Reaction NH+ + H2
We measured the rate coefficients for the atom abstraction reaction (3a) and for the proton transfer reaction (3b) at the ion trap temperatures from 10 up to 130 K. In these experiments, NH+ ions were produced by electron bombardment of the mixture of H2 and N2 gases in the SIS and injected into the trap. The typical time evolutions of the normalized numbers of primary and product ions are shown in Fig. 3.
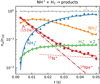 |
Fig. 3. Measured time evolutions of the normalized numbers (nx(t)/nΣ0) of indicated ions in the trap. A+(15 Da) indicates a normalized number of ions with mass 15 Da (mixture of 14NH+ and 15N+ ions). The measurements were performed at T = 34 K, [H2]=6.2 × 1010 cm−3, and [He]≈1014 cm−3. The solid lines are least-squares fits, which were used to determine the reaction rate coefficients. The dash-dotted straight line indicates the decrease in the normalized numbers of 14NH+ ions and the dotted line indicates the normalized numbers of 15N+ ions. The crosses (×) indicate the sum of the normalized numbers of all ions in the ion trap, Σ(t). The normalized numbers of |

Since the mass filters in our instrument cannot resolve between 14NH+ and the 15N+ isotope, we also injected a small fraction of 15N+. This mixture of 14NH+ and 15N+ ions (mass 15 Da) is denoted A+(15 Da). The relative populations of 14NH+ and 15N+ ions injected to the ion trap are influenced by the natural abundance of 15N in N2 and by kinetics in the ion source at particular conditions (partial pressures of gases, electron energy, and storage time in the SIS). The decrease in the normalized number of A+(15 Da) is exponential (dash-dotted straight line in semi-log plot) with a leveling at ∼0.025 (dotted line indicated as 15N+). This leveling of the A+(15 Da) numbers was not observed when 14NH+ ions were produced directly in the trap in the reaction of H2 with 14N+ ions (with well-known isotopic composition; see the example in Fig. 1). This confirms that the slowly reacting ions are 15N+ ions. The presence of 15N+ is considered in the data analysis. Owing to its small rate coefficient, the reaction of 15N+ with H2 does not influence the evaluation of the rate coefficient kNH+. Nevertheless, we take it into account, assuming that it has the same rate coefficient as the 14N+ + H2 reaction (Zymak et al. 2013).
From the data plotted in Fig. 3, we can see the decrease in the relative number of NH+ ions and the production of NH and H
and H ions. To obtain the branching ratio for the reactions (3a) and (3b), the ion detection system had to be calibrated. We obtained the discrimination of the detection system between ions of mass 3 Da and 16 Da by measuring the discrimination between mass 3 Da and 17 Da using a calibration reaction of
  (Bohme et al. 1980) and by taking into account the discrimination between mass 16 Da and 17 Da known from the present experiment with reaction
  .
.
We verified the binary character of the reactions (3a) and (3b) at the present experimental conditions by measuring the dependences of the reaction rates  and
and  on hydrogen number density. The examples of the dependences measured at temperature T = 20 K are shown in Fig. 4. The number density of H2 leaking from the ion source has also been measured and is accounted for in our figures.
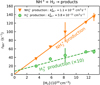 |
Fig. 4. Measured dependences of the reaction rates |


By fitting the measured time evolutions of the relative numbers of ions in the ion trap, the reaction rate coefficients  and
and  for the reaction channel (3a) and (3b) were obtained. The temperature dependences of the reaction rate coefficients
  and
and  are shown in Fig. 5. Also plotted is the value of kNH+ measured at 300 K by Kim et al. (1975). There is just one value of the reaction rate coefficient kNH+ measured in the ion trap experiment at 15 K by Gerlich (1993). In the ion trap experiment, Gerlich measured the overall reaction rate coefficient kNH+ (see Fig. 5). Production of H
 ions was observed only in the selected ion flow tube (SIFT) studies of Adams et al. (1980). At 300 K, they observed 85% of NH
 and 15% of H
 products. The corresponding values of
  and
and  are plotted in Fig. 5. If we extrapolate our data from 130 K towards 300 K as a constant, then there is good agreement with the previously obtained values of kNH+ by Kim et al. (1975) and
  by Adams et al. (1980). However, the value of
  for the production of H
 , measured by Adams et al. (1980) is almost a factor of 4 higher than the present value at 130 K. Values recommended by the Kinetic Database for Astrochemistry (KIDA, Wakelam et al. 2012) and by the University of Manchester Institute of Science and Technology (UMIST) Database for Astrochemistry (McElroy et al. 2013) are also included in Fig. 5.
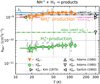 |
Fig. 5. Measured temperature dependences of the reaction rate coefficients |


There have been several previous studies of reaction of NH+ with H2; however, this is the first study giving the temperature dependences of the reaction rate coefficients  and
and  from 15 up to 130 K, i.e. for astrophysically relevant temperatures.
3.2. Reaction NH + H2
+ H2
As mentioned above, in the experiments where N+ ions were injected into the ion trap and NH ions were produced in the chain of reactions with H2, we observed the dependence of the measured reaction rate coefficient
  on partial pressures of gases in the ion trap and on the trapping time. This is presumably connected with internal excitation of NH
 ions formed in exothermic reactions, which did not encounter enough collisions with He and H2 for collisional de-excitation prior to the hydrogen abstraction reaction. To avoid uncertainties, the NH
 ions were produced in the SIS and injected into the ion trap. The primary NH
 ions were produced by electron bombardment of the mixture of N2 and H2 with number density ratio [N2]:[H2]≈10 : 3. In these experiments, the temperature of the ion trap was varied from 10 K to 300 K. An example of measured time evolutions of the normalized numbers of primary NH
 and produced NH
 ions is shown in Fig. 6. The exponential decrease in the normalized numbers of NH
 ions over two orders of magnitude indicates a reaction with a constant reaction rate coefficient.
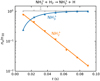 |
Fig. 6. Measured time evolutions of the normalized numbers (nx(t)/nΣ0) of the primary NH |


Two examples of dependences of the reaction rates  on [H2] for reaction (4) measured at T = 18 K and T = 24 K are shown in Fig. 7. The linearity of the obtained dependences confirms that the time evolution of the relative numbers of NH
 ions in the ion trap is controlled by a binary reaction with H2. The slope of the obtained linear dependence is given by the rate coefficient
  for the corresponding binary reaction.
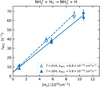 |
Fig. 7. Measured dependence of the reaction rate rNH2f of NH |


The measured temperature dependence of the rate coefficient  between 15 and 300 K is shown in Fig. 8. Also plotted are the results of previous studies at 300 K (Kim et al. 1975; Adams et al. 1980), which are in agreement (within experimental accuracy) with the present value of
  . Gerlich (1993) measured the rate coefficient
  of reaction (4) at 15 K using a 22-pole ion trap with injection of N+ ions. From time evolutions of the number of ions in the trap filled with mixture of He and H2, he obtained the reaction rate coefficient
  (point G in Fig. 8). At similar conditions in present experiments using the injection of N+ ions into the ion trap, we obtained
  (point A, the value obtained from the data shown in Fig. 1) and
  (point B, the value obtained from the data shown in Fig. 2). The present results (point A and B) and the value from Gerlich (1993) (point G) are in rather good agreement, but we note again, that they were measured with short relaxation time, i.e. at conditions without sufficient relaxation of reacting ions (see also discussion in Gerlich 1993). The values of
  recommended by KIDA (Wakelam et al. 2012) and UMIST (McElroy et al. 2013) are also indicated in Fig. 8. KIDA and UMIST only use values measured at 300 K, and the differences in the measured temperature dependences are obvious.
 |
Fig. 8. Temperature dependence of the rate coefficient |


In the experiments with injection of N+ or NH+ ions, we observed that at temperatures below ∼100 K the measured values of  are dependent on processes of formation of NH
 ions. The detailed investigation of this phenomenon, including dependence on para/ortho population of H2, will be a subject of further studies in our laboratory and are not discussed here.
3.3. Reaction NH + H2
+ H2
The exothermic reaction (5) of NH ion with H2 has been studied many times owing to fundamental interest and to its predicted role in the formation of NH3 in interstellar clouds (Herbst & Klemperer 1973; Le Gal et al. 2014; Gerin et al. 2016). Recent theoretical calculations of the temperature dependence of the reaction rate coefficient
  for temperatures down to 20 K (Álvarez-Barcia et al. 2016) are in qualitative agreement with the experiments; nevertheless, at temperatures between 30 and 100 K the calculated reaction rate coefficient is smaller than the available experimental values. To provide further experimental evidence, we measured the reaction rate coefficients at temperatures ranging from 15 to 100 K. In these experiments, N+ ions were injected into the ion trap and in a sequence of hydrogen abstraction reactions, NH
 ions were formed there (see example in Fig. 1). Since reaction (5) is slow in the temperature range covered, the NH
 ions formed in the ion trap have thousands of collisions with He and H2 prior to the reaction. We can expect that in these collisions NH
 ions are thermalized. To see the eventual influence of excitation/de-excitation of NH
 ions in collisions with H2 the data were collected using a broad range of hydrogen densities (see the example of the data plotted in Fig. 2). The example of the measured time evolutions of the normalized numbers (nx(t)/nΣ0) of the primary NH
 ions and of the produced NH
 ions measured at long storage time is shown in Fig. 9. The data plotted in Fig. 9 were measured at identical experimental conditions as data plotted in Fig. 1, the only difference is in the time scale. We also monitored the time evolution of the normalized numbers of H
 , N+, NH+, and NH
 ions in the trap (see the example plotted in Fig. 1), but in Fig. 9 these data are not included. As we can see from the data plotted in Fig. 1, the ions N+, NH+, and NH
 are within 0.2 s removed from the trap in the sequence of fast reactions with H2.
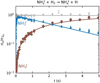 |
Fig. 9. Measured time evolutions of normalized numbers (nx(t)/nΣ0) of NH |


The values of  obtained from the fits of measured time evolutions of nx(t) at long trapping times (i.e. with long relaxation times) at temperatures from 15 up to 100 K are plotted in Fig. 10. We can see the agreement of the present results with the previous experimental results over the covered range of temperatures; in other words, our experiment confirms that the recently calculated reaction rate coefficient by Álvarez-Barcia et al. (2016) is systematically lower than the experimental data at low temperatures.
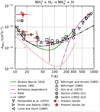 |
Fig. 10. The temperature dependence of the reaction rate coefficient |

When the trapping time was short (⪅100 ms) and the time for the relaxation of produced NH ions was not long enough, we observed a substantial increase in the reaction rate coefficient
  in comparison with values obtained in experiments using long trapping time. An example of a value of
  obtained from the fit of time evolutions of nx(t) at a short trapping time (i.e. with a short relaxation time) is plotted in Fig. 10, labelled A (non-thermalized
  ). A similar increase in the reaction rate coefficient at short trapping time was observed by Gerlich with his ion trap experiment at 15 K (Gerlich 1993). His results obtained at short and long trapping times are labelled G1 and G2 in Fig. 10. At He pressures used in the ion trap in the present experiments (with NH
 ) we did not observe any effect of a ternary reaction. The temperature dependences of
  recommended by KIDA (Wakelam et al. 2012) and by UMIST (McElroy et al. 2013) are also plotted in Fig. 10.
4. Summary
Following our previous studies of the reaction of N+ ions with molecular hydrogen, we studied the chain of hydrogen abstraction reactions of NH+, NH , and NH
 ions with molecular hydrogen leading to the formation of NH
 ions at temperatures relevant for interstellar clouds. Using the 22-pole ion trap apparatus, we measured the temperature dependences of the rate coefficients of the reactions of NH+, NH
 , and NH
 ions with H2 at temperatures down to 15 K.
In the reactions of NH+ ions, we observed two products: NH (∼97%) and H
 (∼3%) (see Figs. 3–5). There have been several previous studies of the reaction of NH+ with H2, but this is the first study giving the temperature dependences of the reaction rate coefficients
  and
and  at astrophysically relevant temperatures. In the covered temperature range, from 15 to 130 K, both reaction rate coefficients are approximately constant (see Fig. 5). The value of
  obtained in our experiment at 130 K,
  is approximately 4 times lower than the only previously available value, which was obtained at 300 K (Adams et al. 1980,
  ). Although these values are not directly comparable due to the difference in temperatures, it is unlikely that the reaction rate coefficient, which is constant below 130 K, would change by a factor of 4 between 130 K and 300 K. There are several systematic effects that can specifically affect the measurement of such a minor reaction channel. We are not able to discuss the possible sources of error in the experiment of Adams et al. (1980), such as different detection efficiencies and diffusion rates for H
 and NH
 . In our study, the detection efficiency was calibrated in experiments with H
 and CH4 (see Sect. 3.1) at otherwise identical conditions to the NH+ experiments. The standard deviation of the detection efficiency was smaller than 10% at given experimental conditions, although it can vary by tens of percentage points with change of potentials in the extraction and detection system. The other systematic effect is related to the kinetic energy release of the reaction. Although we do not know what fraction of the 0.8 eV reaction exothermicity is converted to kinetic energy of the products, it is possible that the H
 ion gains sufficient energy to escape from the trap. However, we did not observe any variation in the branching ratio with trap RF amplitude or He pressure, which would indicate this effect.
The temperature dependence of the rate coefficient of the reaction of NH ion with H2 was measured for temperatures from 15 to 300 K (see Fig. 8). The only observed product of the reaction was the
  ion. The rate coefficient of this reaction drops monotonically from
  to
to  . At 300 K, our value of
  is in agreement with the results of both previous studies (Kim et al. 1975; Adams et al. 1980). At 15 K, our value is significantly higher than that of Gerlich (1993). Our tests indicate that this might be due to insufficient relaxation of the NH
 ions in the experimental procedure of Gerlich (1993). Our experiments were carried out with an injection of NH
 ions from the SIS to the ion trap, and the decay of the number of primary ions was observed over long trapping times to exclude the influence of the process of formation and relaxation of NH
 . The time dependence of the NH
 ion formation process and its relaxation in He or H2 collisions is discussed. The detailed investigation of this phenomenon, including dependence on para/ortho population of H2, will be a subject of further studies in our laboratory and is not discussed here. This is the first study giving the temperature dependence of the reaction rate coefficient
  from 15 K to 300 K.
Due to the astrophysical significance, the temperature dependence of the rate coefficient of the reaction of NH with H2, producing NH
 , was also studied. The measured temperature dependence of the reaction rate coefficient has a minimum at temperatures around 70 K (
 ). At lower temperatures the value of
  slowly increases with decreasing temperature. The presented data for the reaction of NH
 ions with H2 are in agreement with previous experimental values. The recently calculated reaction rate coefficient of Álvarez-Barcia et al. (2016) is systematically lower than all the experimental data at temperatures below 150 K, although the discrepancy is close to the experimental error.
Studies of the reactions of NH+, NH , and NH
 ions with D2, HD, and para-H2 are in preparation.
Acknowledgments
We thank the Technische Universität Chemnitz and the Deutsche Forschungsgemeinschaft for lending the 22-pole trap instrument to the Charles University team. We thank Prof. Dieter Gerlich for the discussion and helpful suggestions. This work was partly supported by the Czech Science Foundation (GACR 17-19459S, GACR 17-18067S), and by Charles University (project Nr. GAUK 1584217, 1144616, 1168216).
References
- Acharyya, K., & Herbst, E. 2015, ApJ, 812, 142 [NASA ADS] [CrossRef] [Google Scholar]
- Adams, N., & Smith, D. 1984, IJMSI, 61, 133 [NASA ADS] [Google Scholar]
- Adams, N., & Smith, D. 1985, CPL, 117, 67 [NASA ADS] [CrossRef] [Google Scholar]
- Adams, N. G., Smith, D., & Paulson, J. F. 1980, JChPh, 72, 288 [NASA ADS] [CrossRef] [Google Scholar]
- Álvarez-Barcia, S., Russ, M.-S., Meisner, J., & Kästner, J. 2016, FaDi, 195, 69 [Google Scholar]
- Barlow, S. E., & Dunn, G. H. 1987, IJMSI, 80, 227 [Google Scholar]
- Bohme, D. K., Mackay, G. I., & Schiff, H. I. 1980, JChPh, 73, 4976 [NASA ADS] [CrossRef] [Google Scholar]
- Böhringer, H. 1985, CPL, 122, 185 [NASA ADS] [CrossRef] [Google Scholar]
- Böhringer, H., & Arnold, F. 1985, Molecular Astrophysics, NATO ASI Series (Dordrecht: Springer), 639 [CrossRef] [Google Scholar]
- Caselli, P., Bizzocchi, L., Keto, E., et al. 2017, A&A, 603, L1 [NASA ADS] [CrossRef] [EDP Sciences] [Google Scholar]
- Cernicharo, J., Tercero, B., Fuente, A., et al. 2013, ApJ, 771, L10 [NASA ADS] [CrossRef] [Google Scholar]
- Cheung, A. C., Rank, D. M., Townes, C. H., Thornton, D. D., & Welch, W. J. 1968, PhRvL, 21, 1701 [NASA ADS] [CrossRef] [Google Scholar]
- Endres, E., Egger, G., Lee, S., et al. 2017, JMoSp, 332, 134 [NASA ADS] [CrossRef] [Google Scholar]
- Fehsenfeld, F. C., Schmeltekopf, A. L., & Ferguson, E. E. 1967, JChPh, 46, 2802 [NASA ADS] [Google Scholar]
- Fehsenfeld, F. C., Lindinger, W., Schmeltekopf, A. L., Albritton, D. L., & Ferguson, E. E. 1975, JChPh, 62, 2001 [NASA ADS] [Google Scholar]
- Florescu-Mitchell, A. I., & Mitchell, J. B. A. 2006, PhR, 430, 277 [NASA ADS] [Google Scholar]
- Gerin, M., Neufeld, D. A., & Goicoechea, J. R. 2016, ARA&A, 54, 181 [NASA ADS] [CrossRef] [Google Scholar]
- Gerlich, D. 1992, AdChP, 82, 1 [Google Scholar]
- Gerlich, D. 1993, FaTr, 89, 2199 [Google Scholar]
- Gerlich, D. 1995, PhyS, 1995, 256 [Google Scholar]
- Gerlich, D. 2008, Low Temperatures and Cold Molecules (Imperial College Press), 121 [CrossRef] [Google Scholar]
- Gerlich, D., Borodi, G., Luca, A., Mogo, C., & Smith, M. A. 2011, ZPC, 225, 5 [Google Scholar]
- Harju, J., Daniel, F., Sipilä, O., et al. 2017, A&A, 600, A61 [NASA ADS] [CrossRef] [EDP Sciences] [Google Scholar]
- Hauser, D., Lee, S., Carelli, F., et al. 2015, NatPh, 11, 467 [NASA ADS] [Google Scholar]
- Hejduk, M., Dohnal, P., Varju, J., et al. 2012, PSST, 21, 024002 [NASA ADS] [CrossRef] [Google Scholar]
- Hejduk, M., Dohnal, P., Rubovič, P., et al. 2015, JChPh, 143, 044303 [NASA ADS] [Google Scholar]
- Herbst, E., & Klemperer, W. 1973, ApJ, 185, 505 [NASA ADS] [CrossRef] [Google Scholar]
- Herbst, E., Defrees, D. J., & McLean, A. D. 1987, ApJ, 321, 898 [NASA ADS] [CrossRef] [Google Scholar]
- Herbst, E., DeFrees, D. J., Talbi, D., et al. 1991, JChPh, 94, 7842 [Google Scholar]
- Hily-Blant, P., Pineau des Forêts, G., Faure, A., Le Gal, R., & Padovani, M. 2013, A&A, 557, A65 [NASA ADS] [CrossRef] [EDP Sciences] [Google Scholar]
- Hunter, E. P. L., & Lias, S. G. 1998, JPCRD, 27, 413 [Google Scholar]
- Kim, J. K., Theard, L. P., & Huntress, W. T. 1975, JChPh, 62, 45 [NASA ADS] [Google Scholar]
- Knauth, D. C., Andersson, B. G., McCandliss, S. R., & Warren Moos, H. 2004, Nature, 429, 636 [NASA ADS] [CrossRef] [Google Scholar]
- Kovalenko, A., Tran, T., Rednyk, S., et al. 2018, ApJ, 856, 100 [NASA ADS] [CrossRef] [Google Scholar]
- Le Gal, R., Hily-Blant, P., Faure, A., et al. 2014, A&A, 562, A83 [NASA ADS] [CrossRef] [EDP Sciences] [Google Scholar]
- Luine, J. A., & Dunn, G. H. 1985, ApJ, 299, L67 [NASA ADS] [CrossRef] [Google Scholar]
- Marquette, J. B., Rebrion, C., & Rowe, B. R. 1988, JChPh, 89, 2041 [Google Scholar]
- Marquette, J. B., Rebrion, C., & Rowe, B. R. 1989, A&A, 213, L29 [NASA ADS] [Google Scholar]
- McElroy, D., Walsh, C., Markwick, A. J., et al. 2013, A&A, 550, A36 [NASA ADS] [CrossRef] [EDP Sciences] [Google Scholar]
- Meyer, D. M., & Roth, K. C. 1991, ApJ, 376, L49 [NASA ADS] [CrossRef] [Google Scholar]
- Ng, C., Baer, T., & Powis, I. 1994, Unimolecular and Bimolecular Ion-Molecule Reaction Dynamics, Wiley Series In Ion Chemistry and Physics (Wiley) [Google Scholar]
- Nieva, M.-F., & Przybilla, N. 2012, A&A, 539, A143 [NASA ADS] [CrossRef] [EDP Sciences] [Google Scholar]
- Novotný, O., Berg, M., Bing, D., et al. 2014, ApJ, 792, 132 [NASA ADS] [CrossRef] [Google Scholar]
- Persson, C. M., Black, J. H., Cernicharo, J., et al. 2010, A&A, 521, L45 [NASA ADS] [CrossRef] [EDP Sciences] [Google Scholar]
- Persson, C., Luca, M., Mookerjea, B., et al. 2012, A&A, 543, A145 [NASA ADS] [CrossRef] [EDP Sciences] [Google Scholar]
- Plašil, R., Mehner, T., Dohnal, P., et al. 2011, ApJ, 737, 60 [NASA ADS] [CrossRef] [Google Scholar]
- Plašil, R., Zymak, I., Jusko, P., et al. 2012, RSPTA, 370, 5066 [NASA ADS] [CrossRef] [Google Scholar]
- Plašil, R., Zymak, I., Hejduk, M., et al. 2014, J. Phys. Conf. Ser., 488, 122003 [CrossRef] [Google Scholar]
- Rist, C., Faure, A., Hily-Blant, P., & Le Gal, R. 2013, JPCA, 117, 9800 [NASA ADS] [CrossRef] [Google Scholar]
- Roučka, S., Rednyk, S., Kovalenko, A., et al. 2018, A&A, 615, L6 [NASA ADS] [CrossRef] [EDP Sciences] [Google Scholar]
- Scott, G. B. I., Freeman, C. G., & McEwan, M. J. 1997, MNRAS, 290, 636 [NASA ADS] [CrossRef] [Google Scholar]
- Smith, D., & Adams, N. G. 1981, MNRAS, 197, 377 [NASA ADS] [CrossRef] [Google Scholar]
- van Dishoeck, E. F., Jansen, D. J., Schilke, P., & Phillips, T. G. 1993, ApJ, 416, L83 [NASA ADS] [CrossRef] [Google Scholar]
- Wakelam, V., Herbst, E., Loison, J.-C., et al. 2012, ApJS, 199, 21 [NASA ADS] [CrossRef] [Google Scholar]
- Wyrowski, F., Güsten, R., Menten, K. M., et al. 2016, A&A, 585, A149 [NASA ADS] [CrossRef] [EDP Sciences] [Google Scholar]
- Zymak, I., Hejduk, M., Mulin, D., et al. 2013, ApJ, 768, 86 [NASA ADS] [CrossRef] [Google Scholar]
All Figures
|
Fig. 1. Measured time evolutions of normalized numbers (nx(t)/nΣ0) of N+, NH+, NH |
| In the text | |
|
Fig. 2. Measured reaction loss rates rN+, rNH+, |
| In the text | |
|
Fig. 3. Measured time evolutions of the normalized numbers (nx(t)/nΣ0) of indicated ions in the trap. A+(15 Da) indicates a normalized number of ions with mass 15 Da (mixture of 14NH+ and 15N+ ions). The measurements were performed at T = 34 K, [H2]=6.2 × 1010 cm−3, and [He]≈1014 cm−3. The solid lines are least-squares fits, which were used to determine the reaction rate coefficients. The dash-dotted straight line indicates the decrease in the normalized numbers of 14NH+ ions and the dotted line indicates the normalized numbers of 15N+ ions. The crosses (×) indicate the sum of the normalized numbers of all ions in the ion trap, Σ(t). The normalized numbers of |
| In the text | |
|
Fig. 4. Measured dependences of the reaction rates |
| In the text | |
|
Fig. 5. Measured temperature dependences of the reaction rate coefficients |
| In the text | |
|
Fig. 6. Measured time evolutions of the normalized numbers (nx(t)/nΣ0) of the primary NH |
| In the text | |
|
Fig. 7. Measured dependence of the reaction rate rNH2f of NH |
| In the text | |
|
Fig. 8. Temperature dependence of the rate coefficient |
| In the text | |
|
Fig. 9. Measured time evolutions of normalized numbers (nx(t)/nΣ0) of NH |
| In the text | |
|
Fig. 10. The temperature dependence of the reaction rate coefficient |
| In the text | |
Current usage metrics show cumulative count of Article Views (full-text article views including HTML views, PDF and ePub downloads, according to the available data) and Abstracts Views on Vision4Press platform.
Data correspond to usage on the plateform after 2015. The current usage metrics is available 48-96 hours after online publication and is updated daily on week days.
Initial download of the metrics may take a while.