Fig. 8.
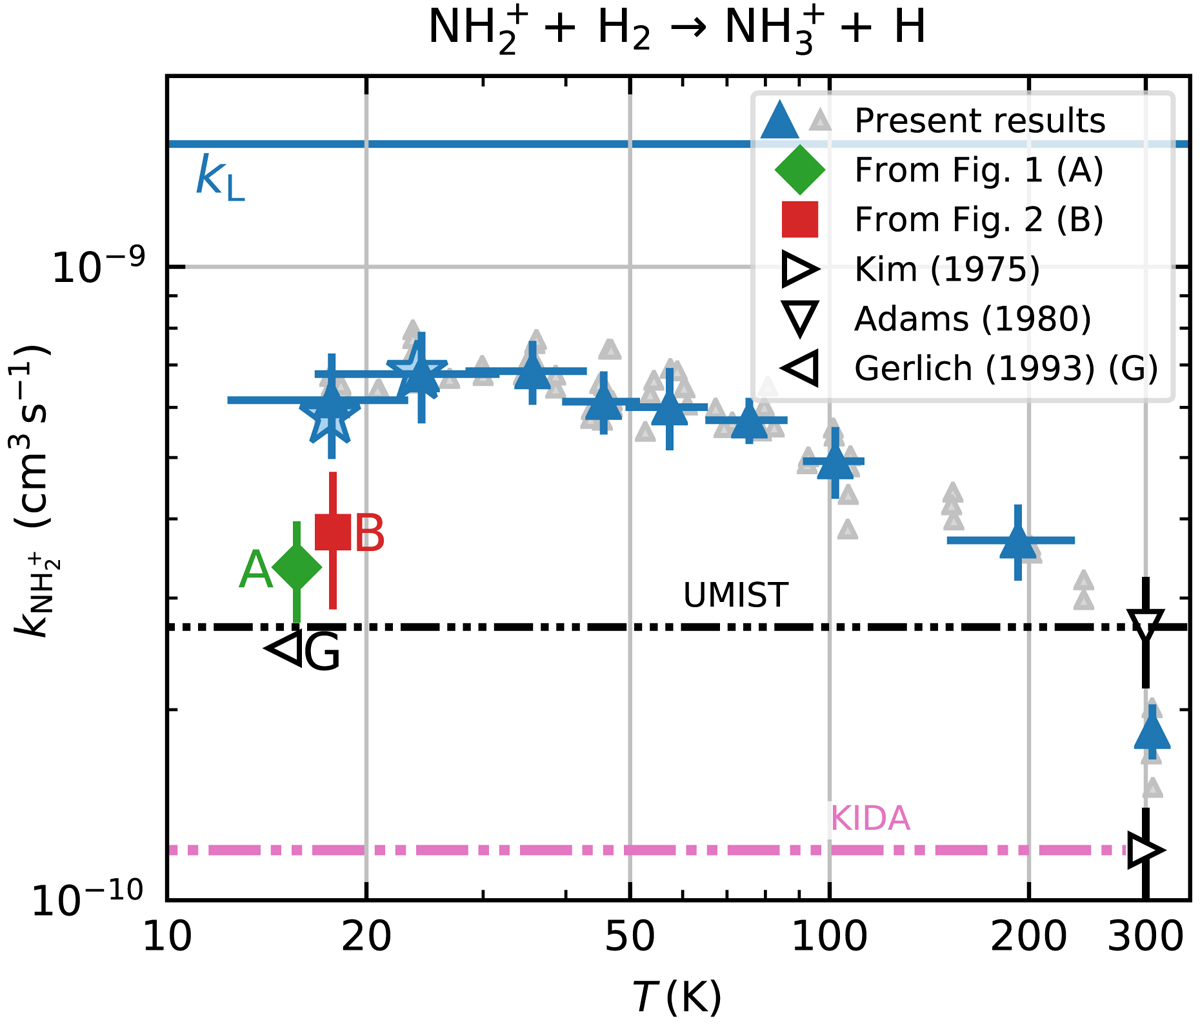
Temperature dependence of the rate coefficient ![]() of the reaction (4). The upward pointing triangles indicate the binned values measured in the present experiments with the injection of NH
of the reaction (4). The upward pointing triangles indicate the binned values measured in the present experiments with the injection of NH![]() ions into the ion trap. The raw data without binning are indicated with the smaller points. The stars indicate the reaction rate coefficients obtained from the [H2] dependences (see Fig. 7). The horizontal straight line (kL) indicates the value of the Langevin collisional rate coefficient. The values of
ions into the ion trap. The raw data without binning are indicated with the smaller points. The stars indicate the reaction rate coefficients obtained from the [H2] dependences (see Fig. 7). The horizontal straight line (kL) indicates the value of the Langevin collisional rate coefficient. The values of ![]() measured in previous experiments at 300 K by Kim et al. (1975; ICR) and by Adams et al. (1980; SIFT) are indicated with the open triangles. The labels A and B indicate values of
measured in previous experiments at 300 K by Kim et al. (1975; ICR) and by Adams et al. (1980; SIFT) are indicated with the open triangles. The labels A and B indicate values of ![]() obtained in the present experiments with the injection of N+ ions into the trap at 16 and 18 K, respectively. The label G indicates the value of
obtained in the present experiments with the injection of N+ ions into the trap at 16 and 18 K, respectively. The label G indicates the value of ![]() measured in similar conditions in ion trap at 15 K by Gerlich (1993).
measured in similar conditions in ion trap at 15 K by Gerlich (1993).
Current usage metrics show cumulative count of Article Views (full-text article views including HTML views, PDF and ePub downloads, according to the available data) and Abstracts Views on Vision4Press platform.
Data correspond to usage on the plateform after 2015. The current usage metrics is available 48-96 hours after online publication and is updated daily on week days.
Initial download of the metrics may take a while.