| Issue |
A&A
Volume 698, June 2025
|
|
|---|---|---|
| Article Number | A32 | |
| Number of page(s) | 15 | |
| Section | Cosmology (including clusters of galaxies) | |
| DOI | https://doi.org/10.1051/0004-6361/202452761 | |
| Published online | 04 June 2025 | |
Distortion of the CMB spectrum by the first molecules of the Dark Ages
Astronomical Observatory of Ivan Franko National University of Lviv, Kyryla i Methodia Str., 8, Lviv 79005, Ukraine
⋆ Corresponding author: This email address is being protected from spambots. You need JavaScript enabled to view it.
Received:
26
October
2024
Accepted:
21
March
2025
Abstract
Context. The formation of the first stars and galaxies at Cosmic Dawn was preceded by primordial chemistry reactions during the Dark Ages, generating the first molecules, H2, HD, and HeH+, which were critical for the emergence of the first stars. These molecules absorb and scatter cosmic microwave background (CMB) quanta leading to distortion of the CMB spectrum.
Aims. We aimed to estimate how much bound-bound transitions between the rovibrational levels of H2, HD, and HeH+ molecules contribute to the distortion of the CMB spectrum in the standard ΛCDM cosmology.
Methods. We modelled the formation kinetics of the first molecules using a system of 166 chemical reactions involving 20 reagents. We solved the differential equations governing the processes of spontaneous and collisional transitions between rovibrational levels of H2, HD, and HeH+ molecules. The populations of rovibrational levels and the optical thickness of the gas in transition lines between these levels were used to estimate the differential brightness produced by the first molecules on the CMB.
Results. The signal from the first molecules in the standard ΛCDM cosmology takes the form of an absorption profile in the CMB spectrum and originates from the Dark Ages. The H2 absorption profile features multiple peaks, reaching a maximum of ∼10−3 Jy/sr within the frequency range of ∼50 GHz to ∼120 GHz. The major contribution to absorption originates at redshifts 300 > z > 200. The HD absorption profile features double peaks, reaching a maximum of ∼10−5 Jy/sr within the frequency range from ∼40 GHz to ∼70 GHz, with the dominant absorption contribution originating at redshifts 300 > z > 30. The absorption profile of HeH+ ion-molecule has no features, reaching a maximum of ∼10−7 Jy/sr within the frequency range of ∼200 GHz to ∼800 GHz, and absorption comes mainly from redshifts 100 > z > 4.
Key words: cosmic background radiation / early Universe / dark ages / reionization / first stars
© The Authors 2025
 Open Access article, published by EDP Sciences, under the terms of the Creative Commons Attribution License (https://creativecommons.org/licenses/by/4.0), which permits unrestricted use, distribution, and reproduction in any medium, provided the original work is properly cited.
This article is published in open access under the Subscribe to Open model. This email address is being protected from spambots. You need JavaScript enabled to view it. to support open access publication.
1. Introduction
Approximately 300 000 years (redshift z ∼ 1100) after the Big Bang, the plasma recombined and cosmic microwave background (CMB) photons had decoupled from baryonic matter. This marked the beginning of the Dark Ages, which lasted until the emergence of the first stars and galaxies at z ∼ 20 − 30. During this epoch, the Universe was filled with CMB photons, dark matter (DM), dark energy (DE), and a weakly ionised gas composed primarily of hydrogen (≈92.4% of total number density), helium-4 (≈7.6%; Aver et al. 2015), along with trace amounts of deuterium (≈2.45 ⋅ 10−3%; Cooke et al. 2014), as well as lithium-7 (as predicted by Coc & Vangioni 2017 to amount to ≈5.61 ⋅ 10−8% while observed Sbordone et al. 2010 to be ≈1.58 ⋅ 10−8%). DM halos formed from initial overdensity perturbations, while primordial chemical reactions produced the first molecules. Molecular hydrogen (H2) emerged as the most abundant compounds (Latter & Black 1991; Lepp et al. 2002; Coppola et al. 2011a; Longo et al. 2011), followed by deuterium hydride molecules (HD) (Lepp et al. 2002; Glover & Abel 2008; Gay et al. 2011), helium hydride ion-molecules (HeH+, Schleicher et al. 2008; Bovino et al. 2011), and lithium hydride molecules (LiH) (Dalgarno et al. 1996; Stancil et al. 1996; Bougleux & Galli 1997; Schleicher et al. 2008).
The estimation of molecular fractions is determined by the primordial chemistry model used, namely the set of chemical reactions and their rates as functions of gas, electron, or radiation temperatures. Primordial chemistry can include up to 300 reactions that involve around 30 reagents (Gay et al. 2011). However, beyond the completeness of the reaction set, the sensitivity of molecular number predictions also depends on the accuracy of reaction rates. Since updates to reaction chains and rates can affect the estimation of abundances, numerous attempts to trace chemical evolution during the Dark Ages have yielded divergent results, sometimes by orders of magnitude (Signore & Puy 2009; Bovino et al. 2009; Galli & Palla 1998, 2002; Black 2006; Sethi et al. 2008; Puy & Signore 2007; Puy et al. 1993; Schleicher et al. 2008; Lepp et al. 2002; Lepp & Shull 1984). The absence of dust and heavy elements in the early Universe leads to extremely low molecular abundances. Molecular fractions in baryonic gas relative to the cosmological background reach ∼10−5 − 10−6 for H2, ∼10−9 − 10−10 for HD molecules, ∼10−11 − 10−14 for HeH+ ions, and ∼10−20 for LiH at the end of the Dark Ages. In the DM halos, chemical processes are expected to be more intense as a result of the denser and hotter environment. The number densities of H2 and HD molecules at the moment of halo virialisation are estimated to be ∼103 and ∼400 times higher, respectively, than the uniformly expanding background. Conversely, HeH+ ion densities appear to lower, by orders of magnitude (Novosyadlyj et al. 2018, 2022). Despite the fairly low abundances of primordial molecules in the early Universe, they were crucial ingredients for the formation of the first stars. Therefore, their detection will provide critical insight into early-Universe processes that led to the emergence of the first stars, galaxies, and supermassive black holes.
The Dark Ages are studied by detecting spectral distortions of the CMB caused by primordial chemistry and the 21 cm transition in neutral hydrogen. Resonant scattering of CMB photons in the rovibrational lines of primordial molecules within Dark Ages halos was first proposed as an observable signature in the CMB thermal spectrum by Dubrovich (1977) in the late 1970s. Subsequent analyses explored the possibility of detecting resonant lines (e.g., Maoli et al. 1994, 1996; Basu 2007; Dubrovich et al. 2008) and three observational attempts to date have not yielded detections (Persson et al. 2010; Gosachinskij et al. 2002; de Bernardis et al. 1993). Schleicher et al. (2008) considered the distortion of the CMB spectrum due to absorption, photoionisation, and photodissociation processes during free-free and bound-free transitions involving atomic and molecular ions on the cosmological background of the Dark Ages. Promising results were obtained for the negative hydrogen ion H− and the HeH+ ion-molecules. In this study, we calculate the contributions of bound-bound transitions between rovibrational levels of H2, HD, and HeH+ to CMB spectral distortions. LiH molecules are not considered due to their low abundance.
2. Primordial chemistry
Primordial chemical reactions began at the epoch of recombination, when neutral atoms emerged, and continue in the post-recombination Universe due to residual free electrons and ions. The presence of such ingredients in an almost neutral post-recombination gas triggered a chain of chemical reactions leading to the synthesis of the first diatomic compounds, of which the most common were H2 and HD molecules, as well as the HeH+ ion. These molecules played a crucial role in forming the first stars by allowing protostellar gas clouds to cool and collapse. Although the primordial gas was chemically poor, it contained atoms and molecules in various ionised and excited states. In our calculations, we included the 20 most common reactants, namely photons of cosmic relic radiation (γ), e−, H, H+, H−, H2, H2+, H3+, He, He+, He++, HeH+, D, D−, D+, D2, D2+, HD, HD+, and H2D+. For these reagents, we considered 166 reactions listed in Table B.1, categorised into three groups as follows. Reactions not involving He and D nuclei are labelled with the prefix ‘H_’, reactions involving He nuclei and not involving D nuclei are labelled with the prefix ‘He_’, and reactions involving D nuclei are labelled with the prefix ‘D_’. The table shows the reaction rates as a function of gas, electron, or radiation temperature. The description in the table lists the publications in which the corresponding approximate expressions were obtained.
In Table B.1 we present new approximate expressions for the reaction rates of H21 and He19. The first is calculated based on the cross-section from the online database1. The second is our approximation to the combined data of Schauer et al. (1989) and Johnsen et al. (1980). Certain reactions involving molecules are sensitive to their quantum state. For these reactions, Table B.1 provides reaction rates for two scenarios: where molecules are in the ground vibrational state, v = 0, and where the population of the rovibrational levels of molecules is described by the local thermodynamic equilibrium (LTE) condition. In the early Universe, the population of rotational and vibrational levels of molecules was mainly determined by the temperature of CMB radiation, while the frequency of collisions depended on the temperature of the gas. At redshifts z > 200, the gas and background radiation temperatures are equal, so it is valid to use the LTE approximation. At lower redshifts, the gas temperature is slightly below the temperature of the background radiation and while we continue to use the LTE approximation, we acknowledge that it is less accurate.
Since the density of the i-th reactant ni changes due to both chemical reactions and expansion of the Universe, it is convenient to represent the amount of the reactant in the form of a fraction, that is, relative to the total number of hydrogen nuclei as xi ≡ ni/nH. The evolution of the fraction of the i-th reactant xi is determined only by chemical reactions and is described by a kinetic equation that has the following general form (Puy et al. 1993; Galli & Palla 1998; Vonlanthen et al. 2009; Novosyadlyj et al. 2018):
 (1)
(1)
where  is the reaction rate of reactants m and n with the formation of reactant i. The number of differential equations can be reduced by applying four equalities: 1 = xHI + xHII + xH− + xHD + xHD+ + xHeH+ + 2xH2+ + 2xH2 + 2xH2D+ + 3xH3+, xD = xDI + xDII + xHD + xHD+ + xH2D+, xHe = xHeI + xHeII + xHeII + xHeH+, and xe = xHII + xDII + xHeII + 2xHeIII + xH2+ + xD2+ + xHeH+ + xH3+ + xHD+ + xH2D+ − xH−.
In our calculations, we used the last equality to calculate the fraction of free electrons, while the others allowed us to control the accuracy of the integration of the differential equations. We did not calculate the change in the photon number density because the number of relic photons exceeds the number of photons arising from recombination by nine orders of magnitude. All calculations were performed for the period from cosmological recombination up to hydrogen reionisation at zrei ≈ 6 and for corresponding values of the main parameters of the cosmological model determined by the final data release of the Planck Space Observatory (Planck Collaboration VI 2020).
The main results of our calculations are presented in Fig. 1, which shows the change in the relative abundances of representative species involved in the formation of H2 (top left panel), HD (top right panel), and HeH + (bottom left panel) with redshift. These abundances are given relative to hydrogen, deuterium, and helium nuclei densities, respectively. The relative abundances of the first molecules relative to hydrogen nuclei density are presented in the bottom right panel. Our results qualitatively match those of other authors, primarily because the core of the most important reactions is common across these studies.
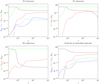 |
Fig. 1. Abundances of atoms, molecules, and ions across redshifts. Panels show relative abundances of key species for H2 (top left), HD (top right), and HeH+ (bottom left) in units of the density of hydrogen, deuterium, and helium nuclei, respectively. The bottom right panel displays the abundances of the first molecules in hydrogen nucleus number density across redshifts. |
We have analysed chemical reactions for their influence on the chemistry of the early Universe, from the moment of recombination to the moment of reionisation. In Table B.1, reactions that give a maximum contribution to the synthesis or destruction of the reactants of more than 0.1 percent in the indicated redshift range are highlighted in bold. Such an analysis identifies reactions that played a noticeable role in the early Universe (within the framework of the standard cosmological model). It is assumed that in halos and cosmological models with additional sources of ionisation and heating, such as primordial magnetic fields, decaying or annihilating dark matter particles or primordial black holes, this set will be somewhat different. The interactive chemical reaction map in Table B.2 is a new way to visualise a network of chemical reactions, allowing us to visually track which reactions are already included in the model of primordial chemistry and which can or should still be included.
2.1. The chemistry of H2
Direct radiative association of two ground-state neutral hydrogen atoms (H) to form H2 is very unlikely, with a rate ≪10−25 cm3 s−1 (Gould & Salpeter 1963). This suppression arises because the emitted photon in this process must be the result of a forbidden transition between the two Hitler-London states of the molecule. Direct radiative association of two neutral H atoms is possible if one of the two colliding atoms is in an excited state (for instance, in the 2p state). In this scenario, photon emission occurs through an allowed transition between the two states of the molecule. However, the fraction of H atoms in the 2p and other excited states during the post-recombination era is negligible. Therefore, in the conditions of the early Universe, two indirect channels of H2 formation dominate – one mediated by the H− ion:
 (2)
(2)
and the other through the mediation of the ion-molecule H2+:
 (3)
(3)
As shown in Fig. 2, the former process dominates at z ≤ 127 and reaches maximum rates at the two peaks located at z ≈ 1270 and z ≈ 98. The second process dominates at 129 ≤ z ≤ 1400, reaching peak efficiency at z ≈ 1220 and z ≈ 320. The grey and yellow lines in Fig. 2 show the overall rates of synthesis and destruction of H2 molecules, respectively, which take into account all the reactions involved listed in Table B.1. The total formation rate is given as the difference between the synthesis and destruction rates, as shown in Fig. 2 by the solid cyan line. The figure illustrates that the formation of H2 molecules in z ≥ 1050 is an equilibrium process, while at lower redshifts, the rate of synthesis of H2 molecules begins to prevail over their destruction.
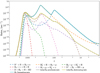 |
Fig. 2. Kinetics of formation and destruction of H2 molecules. The dependencies of the rates of the key reactions involved in the formation and destruction of H2 molecules are shown. |
The main channel for creating H− ions is the process
 (4)
(4)
The main channel for destruction of H− ions at z ≥ 100 is the process
 (5)
(5)
while at z ≤ 100, H− ions are primarily consumed in forming H2 molecule during the process (2). Since the formation of H− ions is an equilibrium process in the early Universe, their number density can be easily estimated by the equality k(4)nHne− = nH−(k(5) + k(2)nH), where k(4), k(2), and k(3) mark rates of processes (4), (2), and (5), respectively.
There are two main processes for the formation of H2+. The first process,
 (6)
(6)
dominates at z ≤ 140, while the second,
 (7)
(7)
dominates at z ≥ 140. There are also two main processes for destruction of H2+, the first is
 (8)
(8)
which dominates at z ≤ 325, while the second,
 (9)
(9)
dominates at z ≥ 325. The formation of H2+ is an equilibrium process in the early Universe, and their number density can be easily estimated by the equality k(6)nHnH+ + k(7)nHeH+nH = nH2+(k(8) + k(9)nH), where k(6), k(7), k(8), and k(9) mark the rates of processes (6), (7), (8), and (9), respectively.
2.2. The chemistry of HD
Unlike H2, HD molecules can form via direct radiative association of two neutral atoms, in the process
 (10)
(10)
which reaches its maximum efficiency in the epoch of recombination (z ≈ 1100). However, in the early Universe, HD formation via H2 becomes more efficient though two pathways, namely charge transfer
 (11)
(11)
and deuteron exchange
 (12)
(12)
These processes have two peaks in efficiency at z ≈ 1180 and z ≈ 307 and dominate at z ≥ 20. At a later time, including the recombination epoch, processes involving H− and D− ions should also be considered, namely
 (13)
(13)
and
 (14)
(14)
The cyan and blue lines in Fig. 3 show the overall rates of synthesis and destruction of HD molecules when all reactions of Table B.1 are involved. The total formation rate is the difference between the synthesis and destruction rates and is shown in Fig. 3 by the solid orange line. As follows from Fig. 3, the formation of the HD molecule is an equilibrium process in the early Universe at z ≥ 120. At later stages of evolution (z ≤ 120), the synthesis of HD molecules dominates over their destruction.
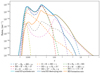 |
Fig. 3. Kinetics of formation and destruction of HD molecules. The dependencies of the rates of the key reactions involved in the formation and destruction of HD molecules are shown. |
2.3. The chemistry of HeH+
Figure 1 (see lower right panel) illustrates that HeH+ was the first molecular ion formed in the early Universe during the recombination of He nuclei, driven by three processes:
 (15)
(15)
and
 (16)
(16)
and
 (17)
(17)
The main channel for destruction of HeH+ at z ≥ 300 is the process
 (18)
(18)
while at z ≤ 300, HeH+ were destroyed in collisions with neutral atoms of hydrogen due to the process
 (19)
(19)
The brown and pink lines in Fig. 4 show the overall rates of synthesis and destruction of HeH+, taking into account all the reactions listed in Table B.1. The convergence of these lines, as shown in Fig. 4, indicates that the formation of HeH+ molecules is an equilibrium process at all redshifts, and their number density can be estimated by the equality k(15)nHenH+ + (k(16) + k(17))nHe+nH = nHeH+(k(18) + k(19)nH), where k(15), k(16), k(17), k(18), and k(19) mark rates of processes (15), (16), (17), (18), and (19), respectively.
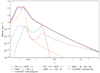 |
Fig. 4. Kinetics of formation and destruction of HeH+ ion-molecules. The dependencies of the rates of the key reactions involved in the formation and destruction of HeH+ ion-molecules are shown. |
3. Occupation of rovibrational levels
The kinetic equations for the population of rotational and vibrational levels are as follows:
![Mathematical equation: $$ \begin{aligned} \frac{\mathrm{d}X_{v,j}^m}{\mathrm{d}t} =&\sum \limits _{s} n_{s}\sum \limits _{v^{\prime },j^{\prime }}\left[k^{s}_{v^{\prime }, j^{\prime }\rightarrow v,j}X_{v^{\prime },j^{\prime }}^m-X_{v,j}^mk^{s}_{v,j\rightarrow v^{\prime },j^{\prime }}\right]\nonumber \\&+ \left[\alpha _{v,j}^m\frac{d_{+}}{\mathrm{d}t} -X_{v,j}^m\frac{d_{-}}{\mathrm{d}t}\right]\ln (n_{m}a^3), \end{aligned} $$](/articles/aa/full_html/2025/06/aa52761-24/aa52761-24-eq21.gif) (20)
(20)
where Xv, jm = nm, {v, j}/∑v′,j′nm, {v′,j′} is the fraction of molecules m ∈ {H2, HD, HeH+} in the quantum state {v, j}. The index s ∈ {γ, H, He, p, e} indicates the collision partner of the molecule m responsible for the transitions. We assume that transitions between the rovibrational levels of the Dark Age and Cosmic Dawn molecules arise from emission and/or absorption of photons, collisions with neutral H and He atoms, protons (responsible for ortho⇆para transitions in H2), and electrons (considered only for HeH+). The final term in Eq. (20) describes the trend in which the population of rovibrational levels of newly synthesised molecules, αv, jm, differs from the population of levels of molecules that have already been exposed to the environment, Xv, jm. The former is determined by the gas temperature,
while the latter is preferably determined by the CMB temperature. The derivative d+ln(nma3)/dt specifies rate of molecule synthesis, while derivative d−ln(nma3)/dt denotes rate of their destruction. These rates correspond to moduli of positive and negative terms of the right-hand side of Eq. (1), respectively, so that dlnxm/dt = d+ln(nma3)/dt − d−ln(nma3)/dt.
The rovibrational level populations of the first molecules in the early Universe were primarily governed by collisions with quanta of CMB radiation. Because this radiation is a blackbody, the population of rovibrational levels are well-described by a Boltzmann distribution with temperature TR. The contributions of spontaneous and radiative rovibrational transitions to the right-hand side of the Equation (20) take the following form:

where the index ‘ul’ denotes transitions from upper to lower energy levels, while index ‘lu’ represents transitions from lower to upper levels. Aul is the rate of spontaneous emission, Bul = (c3/4hνul3)Aul is the rate of radiative emission, Blu = Bul is the rate of radiative absorption, and
is the blackbody energy density. The transition frequencies and energies for permitted spontaneous rovibrational transitions are listed in Table 1, covering low rovibrational energy levels. Data for para- and ortho- H2 are taken from Roueff et al. (2019), data for HD and HeH+ are taken from Amaral et al. (2019).
Values of spontaneous rovibrational transitions permitted by quantum selection rules, including frequencies and energies for the lowest rovibrational energy levels of para- and ortho-s H2, HD, and HeH+.
Spontaneous emission and radiative rovibrational transitions for diatomic molecules with non-zero electric dipole moments (e.g. HD and HeH+) obey the quantum selection rules Δj = ±1 and Δv = ±1. Hydrogen molecules are homonuclear diatomic molecules with zero electric dipole moment. For this reason, there are two types of H2 molecules depending on the relative orientation of their nuclear spins: ortho- and para-. Ortho-H2 molecules are those in which the spins of both nuclei (protons) point in the same direction, so their total spin is In + In = 1, where In = 1/2 is the spin of one nucleus (proton). Molecules of H2 in which the spins of both nuclei are directing in opposite directions are called para-H2, and their total spin is In + In = 0. Spontaneous emission and radiative rovibrational transitions do not lead to the mixing of these spin isomers of H2 molecules because they obey the quantum selection rules Δj = ±2 and Δv = ±1. Spin isomers of homonuclear diatomic molecules have distinct sequences of rotational level statistical weights, gj = gn(2j + 1), which differ in nuclear statistical weights: gn = In(2In + 1) or gn = (In + 1)(2In + 1), depending on the parity of j and the symmetries of the binding wave functions. Ortho-H2 corresponds to odd values of j, with a nuclear statistical weight of gn = 3, while para-H2 corresponds to even values of j, with gn = 1. The statistical weight of any vibrational level v in a diatomic harmonic oscillator is gv = 1.
The next factor affecting the population of rovibrational levels in molecules is their collisions with the components of baryon gas. As shown in Fig. 1, neutral H atoms were the most abundant. In this work, we used collisional de-excitation rates, kul, of rovibrational levels of H2 molecules by H from Lique (2015), where u and l denote upper and lower rovibrational energy levels, respectively. The reverse transition rate (excitation) coefficients can be obtained as follows:
 (21)
(21)
where Eu and El are the energies of the levels, gu and gl are statistical weights of the levels, and T is the baryon gas temperature. We used the rates from Desrousseaux et al. (2022) for collisional de-excitation of HD molecules by H. For collisional de-excitation of HeH+ molecules by H we used the rates from Kulinich et al. (2020), which are somewhat higher than those obtained by Desrousseaux & Lique (2020). The next most abundant element in the gas of Dark Ages was neutral helium. We consider de-excitation of H2 and HD by collisions with He using rates from Nolte et al. (2011), and Flower et al. (1998), Jozwiak et al. (2024) respectively. Although collisions of H2 molecules with protons are much rarer in the early Universe, they still contribute significantly to ortho-para transitions, described by: p + H2(j) ↔ p + H2(j′), where Δj = j′−j = ±1, ±2, ±3, …. For collisional de-excitation of H2 molecules by p, we used the rates of Gerlich (1990). Free electrons are faster than free protons, so their impact on the excitation and deactivation of rotational levels of HeH+ is more significant. To describe the rotational transitions in HeH+ caused by collisions with free electrons we used the transition rates from Khamesian et al. (2018), which are, however, only given for j ≤ 5.
The population of rotational levels for ground vibrational state is a nonmonotonic function of quantum number j: nj ∼ gjexp{−Ej/kBT} ∼ (2j + 1)exp{−Ej/kBT}, where Ej ∼ j(j + 1), with a maximum at
where E1 is the energy of rotational level with j = 1, given in Table 1. The perturbation of levels population caused by the difference in excitation and CMB temperatures depends on the quantum number j as Δnj ∼ gjEjexp{−Ej/kBT}ΔT ∼ (2j + 1)j(j + 1)exp{−Ej/kBT}, and has a maximum at
The smallest number of levels required for calculation should be  , where Tmax ≈ 103 K is the temperature at which the perturbation of levels population can first occur in the Dark Ages (see Fig. 5). So, using data for E1 from Table 1, we can conclude that minimal required levels are: ∼8 for H2 molecule, ∼10 for HD molecule, and ∼11 for HeH+ molecule. Note that the first vibrational level v = 1 with j = 0, 1, 2, 3, 4 should be considered for the HD molecule, since their energies, Ev, j, are lower than for the level v = 0, j = 10. As we noted above, we cannot consider required number of levels for ion-molecule HeH+ due to the lack of data on the activation/deactivation of its rovibrational levels by electrons. As noted in Kulinich et al. (2020), the contributions of collisional excitations and deactivations of rovibrational levels of HeH+ ion-molecule by H and electrons in the Dark Ages are competitive. Therefore, our calculation for HeH+ should be considered rough.
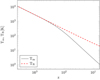 |
Fig. 5. Thermal history of the early Universe. |
4. Global signals of the first molecules
During the Dark Ages, the temperature of baryonic matter was primarily determined by the competition between adiabatic cooling and heating due to Compton scattering of the cosmic microwave background radiation (CMBR) on free electrons. Other factors affecting the energy balance of the gas are collisional activations and de-activations of molecular rovibrational levels and primordial chemistry. However, as demonstrated in Puy et al. (1993), Novosyadlyj et al. (2023), these processes contribute negligibly to the total energy balance of the cosmological background gas. The energy balance of the baryonic component in the cosmic background can be expressed by the equation of the evolution of its temperature with time, described by:
 (22)
(22)
where σT is the Thomson cross-section, a is the radiation constant, me is the electron mass, and xe is the ionisation fraction. Energy exchange between free electrons and the radiation field played a key role in the early Universe, causing the equalisation of baryon gas and radiation temperatures at redshifts z > 300 (see Fig. 5). At lower redshifts, the transfer of energy from radiation to the baryonic gas slowed down significantly due to the reduced frequency of collisions between electrons and the quanta of CMB radiation in the expanding Universe. From this moment on, adiabatic cooling began to dominate, therefore baryon gas cooled faster than radiation.
The population of rovibrational levels begins to deviate from equilibrium at redshifts z < 300 due to collisions between molecules and other components of the baryon gas, where the gas temperature was slightly lower than the temperature of the CMB radiation. These deviations can be represented as a deviation of the excitation temperature,
 (23)
(23)
from the radiation temperature TR. The differential brightness of the first molecules on the background of the CMB can be expressed as
![Mathematical equation: $$ \begin{aligned} \delta I_{ul} = \frac{2h\nu ^3_{ul}}{c^2}\left[\frac{1}{e^{\frac{h\nu _{ul}}{k_{\rm B}T_{\rm ex}}}-1} - \frac{1}{e^{\frac{h\nu _{ul}}{k_{\rm B}T_{r}}}-1}\right]\tau _{ul}, \end{aligned} $$](/articles/aa/full_html/2025/06/aa52761-24/aa52761-24-eq31.gif)
where the optical depth for the transition lines u → l, in the approximation of narrow line, is given by
where λul = c/νul is the wavelength, H(z) is the expansion rate that depends on redshift, and nmol is the molecular number density. We note that indivudial lines cannot be resolved observationally, but their superposition is detectable:
The differential brightness of molecules in their rovibrational lines and their superposition are shown in Fig. A.1. The left panels show absorption profiles in the rotational lines of H2 (top panel), HD (middle panel), and the HeH+ ion-molecule (bottom panel). The coloured dotted lines indicate contributions from individual transitions, while the black line represents their superposition. The right panels in Fig. A.1 show the redshifts at which absorption occurred for the corresponding transitions of H2 (top panel), HD (middle panel), and HeH+ (bottom panel). Absorption begins at z ≃ 300 when the gas temperature T starts to deviate from the CMB temperature TR. The H2 absorption profile has a multi-peak feature and reaches a maximum amplitude of ∼10−3 Jy/sr within the frequency range from approximately 50 GHz to 120 GHz. The maximum absorption in rovibrational lines of H2 molecules occurs over the redshift range 300 > z > 200. The HD absorption profile exhibits a double-peak feature, reaching a maximum amplitude of ∼10−5 Jy/sr within the frequency range of 40 GHz to 70 GHz. The maximum absorption in the rovibrational lines of HD occurs over the redshift range 300 > z > 30. The absorption profile of HeH+ ion-molecule is featureless and reaches a maximum amplitude of ∼10−7 Jy/sr within the frequency range of 200 to 800 GHz. The maximal contribution to absorption in the rovibrational lines of HeH+ ion-molecule occurs over the redshift range 100 > z > 4.
The superposition of the absorption profiles of the first molecules, H2 and HD, and the ion-molecule HeH+, is shown in the left panel of Fig. 6. Despite H2 having zero electric dipole moments, its absorption signal dominates over HD by two orders of magnitude and over HeH+ by four orders, due to its larger population of hydrogen molecules among all other compounds in the early post-recombination Universe (see Fig. 1). The right panel of Fig. 6 illustrates that molecular absorption occurs in the Dark Ages of the Universe, spanning the redshift range 1000 < z < 30).
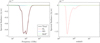 |
Fig. 6. Left panel: superposition of absorption profiles of the first molecules H2 and HD, and the ion HeH+. Right panel: redshifts at which absorption occurred. |
5. Discussion and conclusions
The global signal from first molecules provides a useful source of information from yet-unexplored parts of the visible Universe. It offers information on the thermal and ionisation history of baryonic matter, as well as the kinetics of primordial chemistry during the Dark Ages. In standard cosmology, this signal takes the form of an absorption profile in the CMB spectrum.
Our estimates of the expected signal from H2 and HD molecules are two orders of magnitude lower for H2 and three orders of magnitude lower for HD compared to the results of Puy et al. (1993). This discrepancy can be explained by the difference in cosmological models. In our model, the baryon abundance is only Ωb = 0.0493, in contrast to Ωb = 1 in Puy et al. (1993). The difference in results was also influenced by variations in the models of primordial chemistry used. What is consistent with our findings is the position of the H2 and HD signals in the CMB spectrum.
Previous studies on the effects of primordial chemistry on the CMB spectrum, such as Schleicher et al. (2008), considered free-free and bound-free absorption and emission processes for ions such as H− and He−, as well as ion-molecules HD+ and HeH+. The most promising results were obtained for H−, with a relative CMB temperature change in the range 10−15 ≲ δTR/TR ≲ 10−6 over the frequency range of 10 GHz < ν < 2000 GHz (see Fig. 10 in Schleicher et al. 2008). The authors did not take into account absorption by H2 and HD molecules, considering it negligible.
To compare the molecular absorption obtained here with the ionic absorption from Schleicher et al. (2008), we employ the formula that relates small-amplitude intensity fluctuations to small-amplitude temperature fluctuations:
where f(x) = x ⋅ exp(x)/(exp(x)−1), and x = hν/kBTR. At ν ≈ 102 GHz, where the absorption amplitude of the first molecules is at maximum δI ≈ 0.9 ⋅ 10−3 Jy/sr (see Fig. 6), the CMB specific intensity is equal to I ≈ 3 ⋅ 108 Jy/sr. For ν = 102 GHz and TR ≈ 2.7 K, we obtain x ≈ 1.7 and f(x)≈2.0. Therefore, relative fluctuations of the CMB specific intensity at ν = 102 GHz are estimated to be δI/I ≈ 3 ⋅ 10−12, corresponding to relative fluctuations of the CMB temperature at δTR/TR ≈ 1.5 ⋅ 10−12. The maximum signal from the first molecules is located at the minimum of the signal from the negative hydrogen ion (see Fig. 10 in Schleicher et al. 2008), exceeding it by several orders of magnitude. This indicates that molecular absorption cannot be neglected compared to ionic absorption.
To assess the possibility of detecting a signal from the first molecules, other sources of CMB spectrum distortion in the standard ΛCDM cosmology should be considered. These include μ- and y-distortions, a temperature shift due to a relative error in the measured CMB temperature |ΔTR/TR|≲5 × 10−4, and the cosmological recombination radiation (Desjacques et al. 2015). The frequency dependencies of the first three are monotonic and well-determined so that they can be removed from the overall signal. The latter depends on the details of H and He recombination at z ∼ 103 and has a non-monotonic character with excess CMB emission at ∼102 GHz, at the level of ∼10−1 Jy/sr. These are two orders of magnitude larger than the signal from the first molecules.
Therefore, we conclude that detecting the signal from the first molecules requires accurate predictions of the cosmological recombination radiation up to the third order of magnitude, as well as a radio telescope with a sensitivity of ∼10−4 Jy/sr and a spectral resolution of several tens of GHz.
Acknowledgments
We thank an anonymous referee whose comments significantly improved this article. This work is done in the framework of the project “Tomography of the Dark Ages and Cosmic Dawn in the lines of hydrogen and the first molecules as a test of cosmological models” (state registration number 0124U004029) supported by National Research Foundation of Ukraine. The authors are grateful to Pavlo Kopach for technical assistance in the preparation of the paper.
References
- Adams, N. G., & Smith, D. 1985, ApJ, 294, L63 [Google Scholar]
- Albertsson, T., Indriolo, N., Kreckel, H., et al. 2014, ApJ, 787, 44 [Google Scholar]
- Amaral, P. H. R., Diniz, L. G., Jones, K. A., et al. 2019, ApJ, 878, 95 [NASA ADS] [CrossRef] [Google Scholar]
- Aver, E., Olive, K. A., & Skillman, E. D. 2015, JCAP, 2015, 011 [CrossRef] [Google Scholar]
- Basu, K. 2007, New Astron. Rev., 51, 431 [Google Scholar]
- Black, J. H. 1978, ApJ, 222, 125 [NASA ADS] [CrossRef] [Google Scholar]
- Black, J. H. 2006, Faraday Disc., 133, 27 [Google Scholar]
- Bougleux, E., & Galli, D. 1997, MNRAS, 288, 638 [NASA ADS] [Google Scholar]
- Bovino, S., Wernli, M., & Gianturco, F. A. 2009, ApJ, 699, 383 [Google Scholar]
- Bovino, S., Tacconi, M., Gianturco, F. A., & Galli, D. 2011, A&A, 529, A140 [NASA ADS] [CrossRef] [EDP Sciences] [Google Scholar]
- Coc, A., & Vangioni, E. 2017, Int. J. Mod. Phys. E, 26, 1741002 [CrossRef] [Google Scholar]
- Cooke, R. J., Pettini, M., Jorgenson, R. A., Murphy, M. T., & Steidel, C. C. 2014, ApJ, 781, 31 [NASA ADS] [CrossRef] [Google Scholar]
- Coppola, C. M., Longo, S., Capitelli, M., Palla, F., & Galli, D. 2011a, ApJS, 193, 7 [Google Scholar]
- Coppola, C. M., Diomede, P., Longo, S., & Capitelli, M. 2011b, ApJ, 727, 37 [Google Scholar]
- Coppola, C. M., Kazandjian, M. V., Galli, D., Heays, A. N., & van Dishoeck, E. F. 2017, MNRAS, 470, 4163 [Google Scholar]
- Courtney, E. D. S., Forrey, R. C., McArdle, R. T., Stancil, P. C., & Babb, J. F. 2021, ApJ, 919, 70 [Google Scholar]
- Croft, H., Dickinson, A. S., & Gadea, F. X. 1999, MNRAS, 304, 327 [Google Scholar]
- Dalgarno, A., & Lepp, S. 1987, IAU Symp., 120, 109 [Google Scholar]
- Dalgarno, A., & McDowell, M. R. C. 1956, Proc. Phys. Soc. A, 69, 615 [Google Scholar]
- Dalgarno, A., Kirby, K., & Stancil, P. C. 1996, ApJ, 458, 397 [Google Scholar]
- Datz, S., Larsson, M., Stromholm, C., et al. 1995, Phys. Rev. A, 52, 2901 [Google Scholar]
- de Bernardis, P., Dubrovich, V., Encrenaz, P., et al. 1993, A&A, 269, 1 [NASA ADS] [Google Scholar]
- De Fazio, D. 2014, Phys. Chem. Chem. Phys., 16, 11662 [Google Scholar]
- Desjacques, V., Chluba, J., Silk, J., de Bernardis, F., & Doré, O. 2015, MNRAS, 451, 4460 [Google Scholar]
- Desrousseaux, B., & Lique, F. 2020, J. Chem. Phys., 152, 074303 [NASA ADS] [CrossRef] [Google Scholar]
- Desrousseaux, B., Coppola, C. M., & Lique, F. 2022, MNRAS, 513, 900 [Google Scholar]
- Dickinson, A. S. 2005, J. Phys. B: Atom. Mol. Phys., 38, 4329 [Google Scholar]
- Dove, J. E., Rusk, A. C. M., Cribb, P. H., & Martin, P. G. 1987, ApJ, 318, 379 [NASA ADS] [CrossRef] [Google Scholar]
- Dubrovich, V. K. 1977, Sov. Astron. Lett., 3, 128 [NASA ADS] [Google Scholar]
- Dubrovich, V., Bajkova, A., & Khaikin, V. 2008, New Astron., 13, 28 [NASA ADS] [CrossRef] [Google Scholar]
- Ferland, G. J., Peterson, B. M., Horne, K., Welsh, W. F., & Nahar, S. N. 1992, ApJ, 387, 95 [NASA ADS] [CrossRef] [Google Scholar]
- Flower, D. R., Roueff, E., & Zeippen, C. J. 1998, J. Phys. B: Atom. Mol. Opt. Phys., 31, 1105 [Google Scholar]
- Galli, D., & Palla, F. 1998, A&A, 335, 403 [NASA ADS] [Google Scholar]
- Galli, D., & Palla, F. 2002, Planet. Space Sci., 50, 1197 [Google Scholar]
- Gay, C. D., Stancil, P. C., Lepp, S., & Dalgarno, A. 2011, ApJ, 737, 44 [Google Scholar]
- Gerlich, D. 1990, J. Chem. Phys., 92, 2377 [NASA ADS] [CrossRef] [Google Scholar]
- Glover, S. C. O., & Abel, T. 2008, MNRAS, 388, 1627 [NASA ADS] [CrossRef] [Google Scholar]
- Gosachinskij, I. V., Dubrovich, V. K., Zhelenkov, S. R., Il’in, G. N., & Prozorov, V. A. 2002, Astron. Rep., 46, 543 [NASA ADS] [CrossRef] [Google Scholar]
- Gould, R. J., & Salpeter, E. E. 1963, ApJ, 138, 393 [NASA ADS] [CrossRef] [Google Scholar]
- Huq, M. S., Doverspike, L. D., Champion, R. L., & Esaulov, V. A. 1982, J. Phys. B: Atom. Mol. Phys., 15, 951 [Google Scholar]
- Janev, R. K., Langer, W. D., Post, D. E., & Evans, K. 1987, Elementary Processes in Hydrogen-Helium Plasmas: Cross Sections and Reaction Rate Coefficients (New York: Springer-Verlag) [CrossRef] [Google Scholar]
- Janev, R. K., Reiter, D., & Samm, U. 2003, Collision Processes in Low-Temperature Hydrogen Plasmas, Forschungszentrum Jülich GmbH, Jülich, Germany [Google Scholar]
- Johnsen, R., Chen, A., & Biondi, M. A. 1980, J. Chem. Phys., 72, 3085 [Google Scholar]
- Jozwiak, H., Thibault, F., Viel, A., Wcislo, P., & Lique, F. 2024, A&A, 685, A113 [NASA ADS] [CrossRef] [EDP Sciences] [Google Scholar]
- Karpas, Z., Anicich, V., & Huntress, W. T. 1979, J. Chem. Phys., 70, 2877 [NASA ADS] [CrossRef] [Google Scholar]
- Khamesian, M., Ayouz, M., Singh, J., & Kokoouline, V. 2018, Atoms, 6, 49 [Google Scholar]
- Kimura, M., Lane, N. F., Dalgarno, A., & Dixson, R. G. 1993, ApJ, 405, 801 [Google Scholar]
- Kulinich, Y., Novosyadlyj, B., Shulga, V., & Han, W. 2020, Phys. Rev. D, 101, 083519 [NASA ADS] [CrossRef] [Google Scholar]
- Larsson, M., Lepp, S., Dalgarno, A., et al. 1996, A&A, 309, L1 [NASA ADS] [Google Scholar]
- Latter, W. B., & Black, J. H. 1991, ApJ, 372, 161 [NASA ADS] [CrossRef] [Google Scholar]
- Lepp, S., & Shull, J. M. 1983, ApJ, 270, 578 [NASA ADS] [CrossRef] [Google Scholar]
- Lepp, S., & Shull, J. M. 1984, ApJ, 280, 465 [NASA ADS] [CrossRef] [Google Scholar]
- Lepp, S., Stancil, P. C., & Dalgarno, A. 2002, J. Phys. B: Atom. Mol. Opt. Phys., 35, R57 [Google Scholar]
- Linder, F., Janev, R. K., & Botero, J. 1995, in Atomic and Molecular Processes in Fusion Edge Plasmas, ed. R. K. Janev, 397 [CrossRef] [Google Scholar]
- Lindinger, W., Howorka, F., Maerk, T., & Egger, F. 1982, Symposium on Atomic and Surface Physics, 1982 Contributions [Google Scholar]
- Lique, F. 2015, MNRAS, 453, 810 [NASA ADS] [CrossRef] [Google Scholar]
- Longo, S., Coppola, C. M., Galli, D., Palla, F., & Capitelli, M. 2011, Rendiconti Lincei, 22, 119 [Google Scholar]
- Mac Low, M. M., & Shull, J. M. 1986, ApJ, 302, 585 [Google Scholar]
- Maoli, R., Melchiorri, F., & Tosti, D. 1994, ApJ, 425, 372 [NASA ADS] [CrossRef] [Google Scholar]
- Maoli, R., Ferrucci, V., Melchiorri, F., Signore, M., & Tosti, D. 1996, ApJ, 457, 1 [NASA ADS] [CrossRef] [Google Scholar]
- Martin, P. G., Keogh, W. J., & Mandy, M. E. 1998, ApJ, 499, 793 [Google Scholar]
- Méndez, I., Gordillo-Vázquez, F. J., Herrero, V. J., & Tanarro, I. 2006, J. Phys. Chem. A, 110, 6060 [Google Scholar]
- Mielke, S. L., Peterson, K. A., Schwenke, D. W., et al. 2003, Phys. Rev. Lett., 91, 063201 [NASA ADS] [CrossRef] [Google Scholar]
- Nolte, J. L., Stancil, P. C., Lee, T.-G., Balakrishnan, N., & Forrey, R. C. 2011, ApJ, 744, 62 [Google Scholar]
- Novosyadlyj, B., Shulga, V., Han, W., Kulinich, Y., & Tsizh, M. 2018, ApJ, 865, 38 [NASA ADS] [CrossRef] [Google Scholar]
- Novosyadlyj, B., Kulinich, Y., Melekh, B., & Shulga, V. 2022, A&A, 663, A120 [NASA ADS] [CrossRef] [EDP Sciences] [Google Scholar]
- Novosyadlyj, B., Kulinich, Y., Milinevsky, G., & Shulga, V. 2023, MNRAS, 526, 2724 [Google Scholar]
- Peart, B., & Hayton, D. A. 1994, J. Phys. B: Atom. Mol. Phys., 27, 2551 [Google Scholar]
- Persson, C. M., Maoli, R., Encrenaz, P., et al. 2010, A&A, 515, A72 [NASA ADS] [CrossRef] [EDP Sciences] [Google Scholar]
- Planck Collaboration VI. 2020, A&A, 641, A6 [NASA ADS] [CrossRef] [EDP Sciences] [Google Scholar]
- Poulaert, G., Brouillard, F., Claeys, W., McGowan, J. W., & Van Wassenhove, G. 1978, J. Phys. B: Atom. Mol. Phys., 11, L671 [Google Scholar]
- Puy, D., & Signore, M. 2007, New Astron. Rev., 51, 411 [Google Scholar]
- Puy, D., Alecian, G., Le Bourlot, J., Leorat, J., & Pineau Des Forets, G. 1993, A&A, 267, 337 [NASA ADS] [Google Scholar]
- Ramaker, D. E., & Peek, J. M. 1976, Phys. Rev. A, 13, 58 [Google Scholar]
- Roueff, E., Abgrall, H., Czachorowski, P., et al. 2019, A&A, 630, A58 [NASA ADS] [CrossRef] [EDP Sciences] [Google Scholar]
- Savin, D. W. 2002, ApJ, 566, 599 [Google Scholar]
- Savin, D. W., Krstić, P. S., Haiman, Z., & Stancil, P. C. 2004, ApJ, 607, L147 [Google Scholar]
- Sbordone, L., Bonifacio, P., Caffau, E., et al. 2010, A&A, 522, A26 [NASA ADS] [CrossRef] [EDP Sciences] [Google Scholar]
- Schauer, M. M., Jefferts, S. R., Barlow, S. E., & Dunn, G. H. 1989, J. Chem. Phys., 91, 4593 [NASA ADS] [CrossRef] [Google Scholar]
- Schleicher, D. R. G., Galli, D., Palla, F., et al. 2008, A&A, 490, 521 [NASA ADS] [CrossRef] [EDP Sciences] [Google Scholar]
- Schulz, G. J., & Asundi, R. K. 1967, Phys. Rev., 158, 25 [Google Scholar]
- Seager, S., Sasselov, D. D., & Scott, D. 1999, ApJ, 523, L1 [NASA ADS] [CrossRef] [Google Scholar]
- Sethi, S. K., Nath, B. B., & Subramanian, K. 2008, MNRAS, 387, 1589 [Google Scholar]
- Shapiro, P. R., & Kang, H. 1987, ApJ, 318, 32 [Google Scholar]
- Shavitt, I. 1959, J. Chem. Phys., 31, 1359 [Google Scholar]
- Signore, M., & Puy, D. 2009, Eur. Phys. J. C, 59, 117 [Google Scholar]
- Soon, W. H. 1992, ApJ, 394, 717 [Google Scholar]
- Stancil, P. C., Lepp, S., & Dalgarno, A. 1996, ApJ, 458, 401 [Google Scholar]
- Stancil, P. C., Lepp, S., & Dalgarno, A. 1998, ApJ, 509, 1 [Google Scholar]
- Strömholm, C., Schneider, I. F., Sundström, G., et al. 1995, Phys. Rev. A, 52, R4320 [Google Scholar]
- Theard, L. P., & Huntress, W. T. 1974, J. Chem. Phys., 60, 2840 [CrossRef] [Google Scholar]
- Trevisan, C. S., & Tennyson, J. 2002a, Plasma Phys. Control. Fusion, 44, 1263 [Google Scholar]
- Trevisan, C. S., & Tennyson, J. 2002b, Plasma Phys. Control. Fusion, 44, 2217 [Google Scholar]
- Vonlanthen, P., Rauscher, T., Winteler, C., et al. 2009, A&A, 503, 47 [NASA ADS] [CrossRef] [EDP Sciences] [Google Scholar]
- Walkauskas, L., & Kaufman, F. 1975, Symposium (International) on Combustion, 15, 691 [Google Scholar]
- Walmsley, C. M., Flower, D. R., & Pineau des Forêts, G. 2004, A&A, 418, 1035 [NASA ADS] [CrossRef] [EDP Sciences] [Google Scholar]
- Wang, J. G., & Stancil, P. C. 2002, Phys. Scr., T96, 72 [Google Scholar]
- Wishart, A. W. 1979, MNRAS, 187, 59P [NASA ADS] [CrossRef] [Google Scholar]
- Xu, Y., & Fabrikant, I. I. 2001, Appl. Phys. Lett., 78, 2598 [Google Scholar]
- Zygelman, B., Dalgarno, A., Kimura, M., & Lane, N. F. 1989, Phys. Rev. A, 40, 2340 [Google Scholar]
Appendix A: Absorption signals of H2, HD, and HeH+
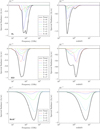 |
Fig. A.1. Left panels: absorption signal in the rotational lines of molecules H2 (top row), HD (middle row), and HeH+ (bottom row) – doted coloured lines show contributions from separate transitions, and the black line shows their superposition. Right panels: redshifts at which absorption occurred for corresponding transitions. |
Appendix B: Detailed description of the chemical model
List of reactions included in our chemical model.
Map of chemical reactions.
All Tables
Values of spontaneous rovibrational transitions permitted by quantum selection rules, including frequencies and energies for the lowest rovibrational energy levels of para- and ortho-s H2, HD, and HeH+.
All Figures
|
Fig. 1. Abundances of atoms, molecules, and ions across redshifts. Panels show relative abundances of key species for H2 (top left), HD (top right), and HeH+ (bottom left) in units of the density of hydrogen, deuterium, and helium nuclei, respectively. The bottom right panel displays the abundances of the first molecules in hydrogen nucleus number density across redshifts. |
| In the text | |
|
Fig. 2. Kinetics of formation and destruction of H2 molecules. The dependencies of the rates of the key reactions involved in the formation and destruction of H2 molecules are shown. |
| In the text | |
|
Fig. 3. Kinetics of formation and destruction of HD molecules. The dependencies of the rates of the key reactions involved in the formation and destruction of HD molecules are shown. |
| In the text | |
|
Fig. 4. Kinetics of formation and destruction of HeH+ ion-molecules. The dependencies of the rates of the key reactions involved in the formation and destruction of HeH+ ion-molecules are shown. |
| In the text | |
|
Fig. 5. Thermal history of the early Universe. |
| In the text | |
|
Fig. 6. Left panel: superposition of absorption profiles of the first molecules H2 and HD, and the ion HeH+. Right panel: redshifts at which absorption occurred. |
| In the text | |
|
Fig. A.1. Left panels: absorption signal in the rotational lines of molecules H2 (top row), HD (middle row), and HeH+ (bottom row) – doted coloured lines show contributions from separate transitions, and the black line shows their superposition. Right panels: redshifts at which absorption occurred for corresponding transitions. |
| In the text | |
Current usage metrics show cumulative count of Article Views (full-text article views including HTML views, PDF and ePub downloads, according to the available data) and Abstracts Views on Vision4Press platform.
Data correspond to usage on the plateform after 2015. The current usage metrics is available 48-96 hours after online publication and is updated daily on week days.
Initial download of the metrics may take a while.