| Issue |
A&A
Volume 692, December 2024
|
|
|---|---|---|
| Article Number | A121 | |
| Number of page(s) | 9 | |
| Section | Atomic, molecular, and nuclear data | |
| DOI | https://doi.org/10.1051/0004-6361/202451757 | |
| Published online | 06 December 2024 | |
Measurements and simulations of rate coefficients for the deuterated forms of the H2+ + H2 and H3+ + H2 reactive systems at low temperature
Max Planck Institute for Extraterrestrial Physics,
Gießenbachstraße 1,
85748
Garching,
Germany
★ Corresponding author; pjusko@mpe.mpg.de
Received:
1
August
2024
Accepted:
4
November
2024
The rate coefficients of various isotopic variations of the H2+ + H2 and H3+ + H2 reactions in the 10–250 K temperature range were measured using a cryogenic 22 pole radio frequency ion trap. The processes involving diatomic ions were found to behave close to the Langevin rate, whereas temperature-dependent rate coefficients were obtained for the four isotopic exchange processes with triatomic ions. Fitting the experimental data using a chemical code allowed us in specific cases to constrain rate coefficients that were not directly measured in the ion trap. The reported rate coefficients suggest a more efficient hydrogenation of deuterated H3+ forms than usually assumed in astrochemical models, which might affect deuteration rates in warmer environments.
Key words: astrochemistry / molecular processes / methods: laboratory: molecular / methods: numerical / astronomical databases: miscellaneous / ISM: molecules
© The Authors 2024
 Open Access article, published by EDP Sciences, under the terms of the Creative Commons Attribution License (https://creativecommons.org/licenses/by/4.0), which permits unrestricted use, distribution, and reproduction in any medium, provided the original work is properly cited.
This article is published in open access under the Subscribe to Open model.
Open Access funding provided by Max Planck Society.
1 Introduction
H3+ is the most important molecular ion in astrochemistry (Oka 2013). It is formed by collisions of H2+ with molecular hydrogen,
 (1)
(1)
In dense and cold molecular clouds, H3+ serves as the universal protonator. It reacts with an atom or molecule M,
 (2)
(2)
and initiates a chain of ion-neutral reactions that causes the formation of most interstellar molecules (McCall & Oka 2000; Tennyson 1995).
At the low temperatures (~10 K) of molecular clouds, the zero point energies (ZPE) of the reactants and products can play an important role in favoring particular chemical pathways. Because of this, deuterium is more efficiently incorporated into molecules, where it produces enhancements several times higher than the galactic D/H ratio (Millar et al. 1989; Millar 2002). For H3+, isotopic exchange reactions with HD can lead to the deuteration of the triatomic ion,
 (3)
(3)
 (4)
(4)
 (5)
(5)
The low exothermicity of these processes (~200 K) means that the reverse reactions may still be relevant even under low-temperature conditions. Understanding the isotopic effects on the chemistry of H2+ and H3+ is therefore key to modeling the deuterium fractionation in molecular clouds (e.g. Caselli et al. 2003; Walmsley & Flower 2004; Caselli et al. 2019), protoplanetary disks (e.g. Willacy & Woods 2009), and other environments, including comets (e.g. Drozdovskaya et al. 2021) and external galaxies (e.g. Bayet et al. 2010; Shimonishi et al. 2021).
Isotopic effects are not only relevant in astrochemistry. The balance of isotopic exchange processes is key for the ionic chemistry of H2/D2 cold plasmas (Jiménez-Redondo et al. 2011), and enhanced rates for deuteration reactions can have a significant role in the efficiency of fusion plasmas (Verhaegh et al. 2021). Substantial effort from the experimental and theoretical point of view, has therefore been devoted to the characterization of the H2+ + H2 and H3+ + H2 isotopic systems.
The exoergic reaction of H2+ with H2 to form H3+ has been extensively studied mainly through the use of merged-beam techniques. The cross section of this process has been characterized for energies ranging from a few meV (Glenewinkel-Meyer & Gerlich 1997; Allmendinger et al. 2016b) to a a few eV (Pollard et al. 1991; Savić et al. 2020) and was found to be well described by the Langevin model for energies below 1 eV. Similar studies were also performed for isotopically substituted reactants, such as the work of Krenos et al. (1976) on H2+ + D2 and D2+ + H2 and Douglass et al. (1977) on HD+ + D2 and D2+ + HD. More recently, the behavior of the cross section at very low temperatures (<1 K) was examined for H2+ + H2 (Allmendinger et al. 2016a), H2+ + HD (Höveler et al. 2021a), and H2+ + D2 (Höveler et al. 2021b). The enhancement of the cross section compared to the Langevin model found in these conditions (Allmendinger et al. 2016a; Höveler et al. 2021b) matches the theoretical prediction of Dashevskaya et al. (2016). In a recent study, Merkt et al. (2022) provided branching ratios for all isotopic variations of the H2+ + H2 system for this temperature range. A variety of theoretical efforts employing different approaches to model this process can be found in the literature, often using quasiclassical trajectory methods (Krenos et al. 1976; Eaker & Schatz 1985; Sanz-Sanz et al. 2015), although the system was also studied with a quantum mechanical treatment (Baer & Ng 1990).
The first experimental low-temperature studies of the iso-topic exchange variations in H3+ + H2 were performed in selected ion flow tube experiments (Adams & Smith 1981; Giles et al. 1992). The corresponding rate coefficients and branching ratios were determined at temperatures of 80 and 300 K. More recent low-temperature studies, such as the deuteration of Hn+ clusters, including H3+ (Paul et al. 1996), have employed ion trap setups. Gerlich & Schlemmer (2002) studied the temperature-dependent reaction rate of D3+ with H2 down to 10 K in a 22 pole trap. The same setup was used to characterize the H3+ + HD reaction (Gerlich et al. 2002), and the reactions of the deuterated ions subsequently produced inside the trap with HD using a kinetic model fit to the experimental data. The controversial set of rate coefficients that was obtained was lower than expected, and in a follow-up study, Hugo et al. (2009) repeated this experiment and obtained values that were about four times higher than in the former work. The experimental results of Hugo et al. (2009) were complemented by a spin-state resolved microcanonical model that agreed well with their measured rates. None of these experiments resolved the spin state of the reacting ion because it is experimentally difficult to prepare ions in defined states inside an ion trap, with the exception of the H+ + H2 reaction, where H+ lacks electronic spin and p-H2 is easily produced (Gerlich et al. 2013). From the theoretical point of view, a number of studies have focused on the possible hopping and exchange processes and their possible constraints. Potential energy surfaces of H5+ were calculated by some groups (Xie et al. 2005; Aguado et al. 2010). The role of spin states was highlighted by Gerlich et al. (2006) and Gómez-Carrasco et al. (2012), while the balance between proton hop and exchange was recently examined using ring polymer molecular dynamics (Suleimanov et al. 2018).
Despite this extensive research, experimental data on the rate coefficients of some of these processes at the temperatures relevant for astrochemistry are still lacking. In this work, we present measurements of the rate coefficients of several of the isotopic variations of the H2+ + H2 and H3+ + H2 systems in the range of 10–250 K using a cyogenically cooled 22 pole ion trap setup. The experiments are complemented by simulations with a chemical code in order to fit the measured data, and we attempted to derive additional rate coefficients, which were not directly accessible experimentally.
2 Experiment
2.1 Experimental setup
The experimental setup consisted of a 22 pole radio frequency (rf) trap with stainless-steel rods (5 cm long and 1 mm in diameter) placed around a circle with a 5 mm inscribed radius, and surrounded by ring electrodes. The setup was described in detail in Jusko et al. (2024), and we only provide a brief description here. The trap was mounted on top of the second stage of a helium cryostat, allowing the cooling of the setup down to 4 K. Ions were generated in a Gerlich-type storage ion source (SIS) by electron bombardment (Gerlich 1992), using H2, D2, or a mixture of both as precursor gases. The ions were subsequently guided through a first quadrupole acting as a mass filter, which allowed us to select the ions according to their mass-to-charge ratio (m/z). The ion beam was deflected with a quadrupole bender before it arrives in the 22 pole trap, where an intense pulse of He buffer gas was used to slow it down and relax the internal excitation. This allowed us to trap the ions and cool them down to the temperature of the trap. After an established trapping time, the ions were extracted from the trap through the output electrode and were subsequently detected (counted) with a quadrupole mass spectrometry system.
The reactant gas (normal H2 or D2) was continuously injected into the trap in order to induce the desired ion-molecule reaction. The time evolution of the different ionic species was then recorded by performing several experiments in which the trap was emptied after various storage times. The rate coefficients of interest can be readily derived from the exponential decay of the primary ion signal, but a more robust result can be obtained by repeating the experiment for several different values of the number density of the neutral (usually around 1010 cm−3) and performing a linear fit of the decay rate against number density, as described in Jusko et al. (2024).
2.2 Measured rate coefficients
The rate coefficients of the reaction of most isotopologs of H2+ and H3+ with H2/D2 were determined using the above-mentioned method. However, issues with mass selectivity prevented us from studying some of these processes. Since ions are discriminated according to their mass-to-charge (m/z) ratio, this prevented us from unequivocally selecting the H2D+ ion in the first quadrupole, since its m/z of 4 is also shared by D2+, which will be produced in the ion source in significant amounts for any precursor mixture containing D2. This conflict in masses also prevented us from studying the D2+ + H2 process, as the H2D+ product branch would contribute to the monitored 4 m/z signal and prevent the determination of the decay rate for D2+.
When the primary ions were diatomic (H2+, D2+ or HD+), the collisions of the energetic (up to eV) ion beam with the He buffer gas during the trapping process correspondingly resulted in the production of HeH+ and HeD+. This was not observed for the triatomic ions H3+ and D2H+, and even though the conflicting masses of D3+ and HeD+ prevented a straightforward dismissal, the behavior of the system indicated that this is also the case for D3+. The reaction of the diatomic ions with He is quite endother-mic for ground-state reactants (by 0.83 eV in the case of H2+, Glosík 1994), and it is consequently only observed to occur during the trapping process and not during the subsequent storage time. Since these HeX+ ions were co-trapped with the corresponding primary ion, we were able to simultaneously determine both rate coefficients in reaction with the neutral of interest.
For many of the studied ion-molecule pairs, the product ions underwent subsequent reactions with the neutral present in the trap. This is illustrated in Fig. 1 for the case of D3+ + H2. In this particular case, the reaction proceeded until full hydrogena-tion was achieved. The experimental rate coefficients (see Fig. 2) were only calculated from the decay of the primary ion when it reacted with the neutral, but the full data of the experiment can be processed with the help of a kinetic model (see below). Due to the exothermicity of some of the ion-molecule processes we studied, the products of these reactions can possess some degree of internal excitation, unlike the buffer-cooled primary ions. This possibility must be taken into account when processing the full data of these experiments.
The experiments presented here did not resolve the spin state of the ions. Nevertheless, spin relaxation might take place in the trap for the less efficient reactions, which are those involving triatomic ions. However, according to Hugo et al. (2009), collisions modifying the ionic nuclear spin are forbidden for all studied reactions except D2H+ + D2, where they are significantly less efficient than the reactive pathway. This means that for all experiments, the spin-state distribution of the ions will be the one resulting from their production in the ion source, which is not characterized.
The experimentally determined rate coefficients are shown in Fig. 2. The error bars represent the standard deviation of the data fit. Measurements at the lowest and highest temperature usually present an increased uncertainty associated with the freezing of the reactant gas in the colder parts of the trap, which affects the reliability of the pressure measurements, or the presence of residual species such as water giving place to parasitic reactions, respectively. Overall, the main source of error for these measurements is the uncertainty in the derivation of the number density, which is estimated to be ~20% (Jusko et al. 2024).
A clear separation was observed between the efficient reactions involving diatomic ions, with exothermicities around 1 eV, and most of the isotopic exchange processes of the triatomic ions, which are slower by a factor of 2–4 times. The reactions of the diatomic ions do not show a significant temperature dependence, including those of HeH+ and HeD+ with H2, which were omitted from the plot for clarity (see Appendix A). Only in the case of the D2+ + D2 reaction is it possible to observe a decay in the rate coefficient of about 10% between 20 and 250 K, but the values are still within the expected dispersion for these measurements. In contrast, the effect of temperature is clearly noticeable for all reactions involving triatomic ions. The starkest temperature dependence is observed for the hydrogenation reactions, which, depending on the product channel, are endothermic by 234/342 K in the case of D3+ + H2 and 187/340 K for D2H+ + H2, with ZPE taken from Ramanlal et al. (2003). The rate coefficient for these two processes grows by almost an order of magnitude between 15 and 250 K. The fact that these reactions are still observed to proceed at a moderate rate even at the lowest temperatures we studied is likely due to the internal energy of ortho-H2, 175 K, which helps offset the endothermicity of the process. The deuteration reactions H3+ + D2 and D2H+ + D2, which are in turn exothermic by 153/340 K and 155 K, respectively, were found to be significantly more efficient at low temperatures, with a somewhat stable rate coefficient at low temperatures and a noticeable decrease above ~60 K, leading to a reduction in the rate coefficient of ~30% at 250 K compared to 20 K.
The temperature dependence of these rate coefficients was fit according to the Arrhenius-Kooij formula, so that we were able to directly use it with tools based on the KIDA data format (Wakelam et al. 2012). The fit is represented by the solid lines in Fig. 2. The parameters of the fit, together with the uncertainties derived from the statistical analysis, are collected in Table 1.
A comparison of the experimental rate coefficients with some of the previously available values is shown in Table 2. Overall, the measurements presented here match previous works such as the selected-ion flow-tube (SIFT) experiments of Giles et al. (1992) at 80 and 300 K. Only in very specific cases are values for the thermal rate coefficients at cold (10–20 K) temperatures available in the literature. For H2+ + H2, merged-beam experiments such as those by Allmendinger et al. (2016b) and Savić et al. (2020) showed that the cross section for this process at low energies is very close to the Langevin value. The low rate coefficient obtained for D3+ + H2 is in line with the results of another merged-beam experiment by Gerlich et al. (2002). Finally, the value for the H3+ + D2 rate coefficient obtained here is close to the value measured by Paul et al. (1996) in a 22 pole trap, which presented significant uncertainty.
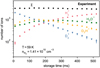 |
Fig. 1 Experimental number of ions in the trap as a function of trapping time for the D3+ + H2 experiment at 27 K. σ represents the sum of all ions. H2D+ and D2H+ undergo subsequent reactions with H2, eventually leading to the formation of H3+. |
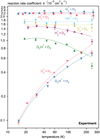 |
Fig. 2 Rate coefficients as a function of temperature for the eight reactions studied in the 22 pole trap experiments. The symbols correspond to the measurements, and the lines represent the fit to the Arrhenius-Kooij formula with the parameters given in Table 1. |
Comparison of the rate coefficients obtained in this work with values available in the literature below 100 K. All values are in 10−10 cm3 s−1.
3 Simulations of the H3+ + H2 reacting system
We carried out simulations to corroborate the rate coefficient values pertaining to the  system (including combinations of all deuterated forms) measured in the laboratory, and to investigate whether we can obtain predictions for rate coefficients that cannot be measured directly in the experiments. To this end, we employed the gas-grain chemical code pyRate (presented in detail in, e.g., Sipilä et al. 2015a), although in the present case, we only required a simple gas-phase description of the chemistry. In what follows, we give a detailed account of the simulations performed for the present paper, including a discussion of the choice of initial conditions, and setting of the simulation parameters to correspond to the experimental setup.
3.1 Initial conditions
Our approach to the chemical simulations was to define an initial set of rate coefficients for the reaction system presented in Table 1, representing a first guess, and to vary these rate coefficients until a reasonable agreement with the experimental results was met (see Sect. 3.2). The fiducial rate coefficient values were obtained based on the values given in Table B.1 of Sipilä et al. (2017). There, new fits of rate coefficients for the H3+ + H2 reacting system, based on the data of Hugo et al. (2009), were presented. These reactions explicitly involve the spin states of the participating species. Our experiments did not distinguish the spin states, however, and therefore, they were removed from the simulation network. We produced a simplified network by summing the rate coefficients of each reaction over the possible product channels, and we then averaged over the reactant channels assuming that the possible spin forms of a given species are distributed according to their high-temperature statistical weights. Table 3 shows the resulting set of rate coefficients at four selected temperatures.
We tested the validity of the rate-coefficient averaging process by running test simulations where we either used the reduced reaction network or the original spin-state resolved network. In the latter case, we summed over the abundances of the spin forms of each species post-simulation so that they could be directly compared to the results obtained with the reduced network. Figure 3 shows the results of this comparison in physical conditions mimicking the D3+ + H2 experiment. The time evolution of the various species simulated with the full network, with explicit consideration of spin states1, deviates from the solution derived using the reduced network at low temperatures. However, toward higher temperatures, the two approaches start to produce nearly identical results. The experiments presented here probed temperatures in excess of 20 K, which justifies the use of the averaged rate coefficients. In any case, the set presented in Table 3 only represents the initial guess, as we explain in more detail in Sect. 3.2.
We set the initial condition in each simulation by taking the recorded count of each ion at the earliest measurement time in the experimental data, and we used these values to define t = 0 in the simulation. In addition to the initial number of ions, the other parameters required for the chemical simulations are the number density of the reactants in the trap (in practice equal to the number density of the neutral reactant) and the temperature. Because pyRate works with number densities, we used the volume of the ion trap (0.770 cm−3) to interconvert between ion counts and number densities when required.
We performed simulations of the H3+ + D2, D2H+ + H2, and D3+ + H2 reacting systems. In what follows, we discuss the H3+ + D2 system as a specific example and quantify the simulation process.
3.2 Search for the best fit: H3+ + D2 system
The experiments yielded the number of ions as a function of storage time. Our simulations attempt to reproduce the time-dependent behavior of the experimental ion numbers. Because the experimentally derived rate coefficients indicate deviations from the predictions of Hugo et al. (2009), we did not expect to find a match between the experiments and the simulations unless the initial rate coefficients (Table 3) were modified. Therefore, we ran for each individual experiment an ensemble of 104 simulations, where in each simulation the rate coefficient of every reaction was varied randomly by a factor of ten each way with respect to the initial guess. In this way, we searched for a set of rate coefficients that was able to provide a match to the experimental results. This approach is feasible because each simulation takes on the order of one second of CPU time to run2. For more time-consuming tasks, it would make more sense to use for example a Markov Chain Monte Carlo approach to search for the best-fitting solution.
The simulations were run from t = 0 s until approximately 10 s even though the experimental measurements were typically taken over a duration of less than a second. To find the best-fitting simulation among the ensemble of 104, we performed for each individual simulation a χ2 test on the simulated versus experimentally deduced number of ions for the four ions separately, for which we summed the four values to set the final χ2 value that represented the goodness of the fit. The best-fitting simulation is the one with the lowest χ2 value. We also derived error bars for the simulated rate coefficients by considering the simulations with a χ2 value within a factor of two from the minimum value to represent good fits. The value of the good-fit constraint is arbitrary and was set empirically based on examination of the simulation results. When we relaxed the condition and allowed more solutions within the good-fitting range, the distinction between sets of rate coefficients were blurred, which provide an acceptable match to the experiments and those that only appear to do so due to the randomized nature of the simulations (see below for a more detailed discussion). In practice, with the constraint of a factor of two, typically only 5−10 solutions for each set of 10 000 simulations were counted as good fits.
Figure 4 shows an example of the results, representing the best-fitting simulation of the H3+ + D2 system at a temperature of 21.6 K. The agreement between the simulations and the experiment is very good. The maximum difference between the simulated and experimental number of ions is only some dozen percent. We also ran simulations for the other two D2 number density values considered in the experiments. The results were similar to those shown in Fig. 4, with a comparably good match between the experiments and the simulation. Additional information on the simulation of this system is presented in Appendix B.
Averaged rate coefficients, based on the spin−state resolved data given in Sipilä et al. (2017), for four selected temperatures.
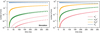 |
Fig. 3 Number of ions as a function of reaction time in a simulation mimicking the D3+ + H2 experiment, where the gas initially only consists of D3+ and H2. The results are shown for simulations run at 15 (left) and 50 K (right). The solid lines represent simulations using the averaged rate coefficients, and the markers represent a simulation where spin states have been explicitly included, but summed over afterward. |
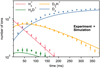 |
Fig. 4 Number of the four ions as a function of reaction time in the H3+ + D2 experiment at a temperature of 21.6 K and a D2 number density of 9.83 × 109cm−3. The solid lines represent the best-fitting simulation results, and the markers with error bars represent the experimental number of ions. |
3.3 Other systems and temperature dependence
Figure 5 shows the temperature dependence of the simulated counterparts of all experimentally studied reactions in comparison with the actual experimental data. Simulations were performed for four temperature values ranging from approximately 20 to 100 K. In general, the simulated values agree well with the experiments. For the H3+ + D2 reaction, which has two possible branches that could not be distinguished in the experiments, we compared the sum of the two rate coefficients to the experimental data. The D2H+ + H2 and D3+ + H2 reactions also have two possible product branches each, but in both cases, one branch has a very low rate coefficient (Table 3), and hence, we only show the major branch in Fig. 5. Overall, the simulated and experimental rate coefficients deviate from the Hugo et al. (2009) values by a factor of a few at most, depending on the reaction and on the temperature.
The rate coefficients of the H2D+ + H2 → H3+ + HD, D2H+ + H2 → H2D+ + HD, and D3+ + H2 → D2H+ + HD reactions are both constrained by the D2H+ + H2 and the D3+ + H2 experiments. The figure shows that we obtained similar rate coefficients for the first two reactions regardless of the experiment on which the simulations were based, but for the last reaction, there is a clear difference between the simulation predictions. This is because the amount of  created in the D2H+ + H2 experiment is low compared to the other ions, and the simulations have difficulties to reproduce its number density. Thus, for the D3+ + H2 → D2H+ + HD reaction, we consider only the simulation predictions based on the D2H+ + H2 experimental system (green dots in the figure) to be reliable.
We were unable to measure the rate coefficient of the H2D+ + H2 → H3+ + HD reaction in the experiments. This is the only reaction outside of the directly measured ones for which the simulations are able to give predictions with reasonably small error bars. The simulations indicate that the rate coefficient of this reaction was underestimated by Hugo et al. (2009) by a factor of approximately four at 100 K, but, interestingly, the simulations also predict a pronounced temperature dependence, and the predicted rate coefficient value is very close to that of Hugo et al. (2009) at 20 K. The astrochemical implications of this finding are discussed in Sect. 4, but we stress here that the simulation prediction should be corroborated by experiments with a different setup or by theoretical calculations.
The data shown in Fig. 5 correspond in each case to the lowest number density of the neutral reactant tested in the experiments. As demonstrated by Fig. B.1, some variation in the results can be expected when the density of the neutral reac-tant is varied. We verified via repeated simulations, however, that the randomness inherent to the simulation process (one obtains somewhat different values for the derived rate coefficients every time a new set of simulations is run) leads to variations in the results on the same order of magnitude as the changes in the neutral reactant density. Therefore, although the best-fit rate coefficient values change from one set of simulations to the next, the trends evident in Fig. B.1 are not affected, and our conclusions remain the same regardless of the density of the neutral reactant.
3.4 Conclusions from the simulations
It is clear that for a given experimental system, the simulations do not allow us to constrain the rate coefficients of reactions that are not as important in that experiment, that is, we cannot constrain reactions whose rate coefficients are too low for them to contribute to the evolution of the experiment (or if the ion abundance is too low, as is the case for reactions 7 and 8 in the H3+ + D2 experiment; see also Appendix B). In the exceptional case of the H2D+ + H2 → H3+ + HD reaction, which could not be determined experimentally, we were able to establish limits on the reaction rate coefficient using the simulations, however. As it stands, our simulations serve to corroborate the experimental findings, as demonstrated by the good correspondence of the simulated rate coefficients to the experimental ones, but the error bars are generally too large to make reliable predictions on unmeasured reactions.
4 Astrochemical implications
For the reactions involving D2 as the neutral reactant, the experiments predict very similar (within a few dozen percent) rate coefficients with respect to the values reported by Hugo et al. (2009). However, larger differences of up to a factor of a few are found for reactions involving H2, which are backward processes that lead to a reduction in deuterium substitution of the reacting  isotopolog. There is no consistent trend in the difference between our predictions and those of Hugo et al. (2009), however, in that we find a higher rate coefficient for the D2H+ + H2 → H2D+ + HD reaction, but a lower one for D3+ + H2 → D2H+ + HD. Nevertheless, variations in the rate coefficients of these reactions imply effects on the relative populations of the deuterated forms of
  , which could have observational implications. The most striking feature of our simulations is the prediction for the rate coefficient of the H2D+ + H2 → H3+ + HD reaction, which we find to be higher by a factor of several at elevated temperatures in comparison to the value reported by Hugo et al. (2009) (the difference is about a factor of four at 100 K), but at low temperatures, their data and ours agree very well. H2D+ is not likely to be very abundant at elevated temperatures, and hence, the effect of the rate coefficient differences may be limited. On the other hand, however, it is conceivable that in the lukewarm temperatures of protostellar envelopes, a higher-than-expected destruction rate of H2D+ might affect the overall deuteration degree. The overall implication of our results is that existing chemical models may be underestimating the efficiency of the destruction of two main deuterium carriers, H2D+ and D2H+. At the same time, it needs to be emphasized that we are unable with the current experimental setup to predict the rate coefficients of the forward processes (e. g., H3+ + HD → H2D+ + H2), and hence, it is difficult to draw any definite conclusions. It is clear, however, that further studies of these fundamental reactions are required for a complete understanding of deuterium chemistry in the interstellar medium.
The new values for the rate coefficients that the experiments provide are readily applicable in astrochemical models that do not distinguish spin states, with the exception of the H3+ + D2 reaction, for which the experiments cannot predict the branching ratio of the two possible product channels3. For models that do include an explicit treatment of spin-state chemistry, the situation is more challenging as the spin states need to be introduced. Procedures for this are available in the literature (Sipilä et al. 2015b; Hily-Blant et al. 2018), but it needs to be noted that the H3+ + H2 system is special in the sense that small energy differences between the reactants have a large impact on the relative populations, and the automated procedures presented in the literature may lead to false predictions for this system. We leave an in-depth investigation of this problem to future work.
Our experimental prediction for the rate coefficient of the H2+ + H2 reaction agrees very well with the data already available in KIDA, where no temperature dependence for this reaction is reported. The experimentally deduced kinetic isotope effect, with the rate coefficient decreasing with the amount of deuterium substitution (see Fig. 2), or the temperature dependence, has not been taken into account to our knowledge in earlier gas-grain chemical models that dealt with deuterium chemistry. However, owing to the low abundance of D2, as already pointed out above, these reactions are not likely to be very important for the overall evolution of deuterium chemistry in the ISM, and hence, variations on the order of a few dozen percent are not expected to change the conclusions drawn from chemical models significantly.
In stark contrast to D2, helium is very abundant. Protonated helium (HeH+) can be produced in the reaction between He+ and HCO (Woon & Herbst 2009), which is currently the only HeH+ production path included in KIDA. Production of HeH+ via this pathway is inhibited in the ISM due to the higher ionization potential of helium compared to hydrogen, however, which means that He+ is exclusively produced by cosmic rays impacting on atomic helium. As a test, we ran a chemical simulation to estimate the HeH+ abundance in molecular clouds, assuming canonical values n(H2) = 104cm−3 and T = 10 K for the number density and kinetic temperature, respectively. We find that the HeH+ abundance (with respect to H2) is very low, on the order of 10−19 –10−18. In the UMIST database (Millar et al. 2024), there is another HeH+ production pathway via H2+ + He (Theard & Huntress 1974), which is much more efficient in producing HeH+ compared to direct helium ionization followed by proton transfer. However, even with this reaction, we predict a HeH+ abundance of only a few times 10−14. Our tests were limited, but we find it likely that the potential of the HeD+ + H2 reaction as a means of distributing deuterium in the ISM remains low, despite the relatively high rate coefficient of this reaction (Fig. A.1).
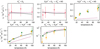 |
Fig. 5 Rate coefficients of various reactions, as indicated above each panel, as a function of temperature. The filled red, orange, and green circles indicate simulated rate coefficients based on the H3+ + D2, D2H+ + H2, and D3+ + H2 systems, respectively. The error bars are defined as in Fig. B.1. The values for the H3+ + D2 reaction are sums over the two product branches, that is, reactions 2 and 3 as given in Table3. The rate coefficients of the H2D+ + H2 → H3+ + HD, D2H+ + H2 → H2D+ + HD, and D3+ + H2 → D2H+ + HD reactions are both constrained by the D2H+ + H2 and the D3+ + H2 experimental systems and hence appear in two colors (D2H+ + H2 in orange; D3+ + H2 in green); the data have been offset by 3 K for better visibility of the error bars. The solid black lines indicate the experimentally deduced rate coefficients; these data are missing for the H2D+ + H2 → H3+ + HD reaction because they could not be determined experimentally. The dashed magenta lines show the rate coefficient values as derived from the Hugo et al. (2009) data (see also Table 3). |
5 Conclusions
The rate coefficients of some of the deuterated variations of the H2+ + H2 and H3+ + H2 systems were experimentally determined for temperatures between 10 and 250 K. The processes involving diatomic ions were observed to follow the Langevin model and do not present a temperature dependence. The rates of the isotopic exchange processes of the triatomic ions, on the other hand, were found to depend on the temperature regardless of whether they are exothermic or endothermic. Particularly for the endothermic hydrogenation processes, the internal energy of o-H2, which is close to the endothermicity of the reactions, likely softens the drop in the measured rate coefficient with decreasing temperature. Nevertheless, a significant variation in the rate coefficient was obtained between 20 and 250 K, whether it is a decrease of ~30% for the exothermic processes we studied or an increase of an order of magnitude for the endothermic processes.
The chemical simulations we used to fit the ion trap measurements provide rate coefficients that agree with the experimental coefficients, but struggle to give additional insight into most of the unmeasured rates due to the large error bars obtained from the fit. Nevertheless, the simulations were able to constrain the rate coefficient for the reaction of H2D+ + H2, and we obtained a stronger temperature dependence than the commonly used values of Hugo et al. (2009). This is in line with our other measurements for the hydrogenation of D2H+ and D3+. This result highlights the need for a direct measurement of this rate coefficient, which is lacking to date.
The rate coefficients obtained in this work can be readily included in astrochemical models that do not consider state-to-state reactions, and they can be used over a wide range of temperatures. Overall, our results show an enhanced efficiency of the hydrogenation of the partially deuterated ions H2D+ and D2H+ compared to the values commonly used in astrochemi-cal models. As a consequence, models may be overestimating the abundances of these ions and the relative importance of the deuteration processes initiated by these species.
Data availability
The data that support the findings of this study are openly available at https://doi.org/10.5281/zenodo.10777585.
Acknowledgements
This work was supported by the Max Planck Society. The authors gratefully acknowledge the work of the electrical and mechanical workshops and engineering departments of the Max Planck Institute for Extraterrestrial Physics. We thank the reviewer for their constructive feedback.
Appendix A Reactions of HeH+/HeD+ with H2
As mentioned in the main text, HeH+ and HeD+ are co-trapped in the experiments involving diatomic ions. Due to overlapping masses (same mass-to-charge ratio m/z) only the determination of the rate coefficient for HeH+ + H2 and HeD+ + H2 is possible. The corresponding rate coefficients as a function of temperature are displayed in Fig. A.1.
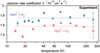 |
Fig. A.1 Rate coefficients as a function of temperature for the HeH+ and HeD+ reactions with H2 studied in the 22 pole trap experiments. Symbols correspond to the measurements, while lines represent the fit to the Arrhenius-Kooij formula with the parameters given in Table 1. |
Appendix B Scaling coefficients derived in the simulation of the  system
To complement the discussion in Sect. 3.2, we show in Fig. B.1 a breakdown of the predicted rate coefficients of the good-fitting solutions, obtained via the random scaling process, for the  system, for each of the 16 reactions individually. For this pair of reactants, only the reactions 2,3,7,8, and 13 (Table 3) are of practical consequence because low amounts of H2 and HD are formed during the experiment with respect to D2. Furthermore, the H2D+ count is low (see Fig. 4), meaning that reactions 7 and 8 are not very important to the overall evolution of the system either. These facts are reflected in the scaling coefficients associated with the good-fitting simulations; only the rate coefficients of reactions 2, 3, and 13 are constrained in a manner that can be considered reliable – all of the other rate coefficients present a large amount of scatter. The experiments do not distinguish between branching ratios when there are multiple product channels but instead yield the total rate coefficient, and hence we have added up the simulated rate coefficients of reactions 2 and 3 so that a direct comparison between the simulations and the experiment is possible. The summation was done using the “variable Gaussian” method Barlow (2004) allowing error bars to be obtained.
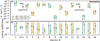 |
Fig. B.1 Data collected from the best-fitting simulations of the H3+ + D2 experiment at 21.6 K. The reaction number refers to the list in Table 3. Results are shown for three sets of simulations corresponding to the three different variations of the experiment, where the number density of the neutral reactant (D2) is varied as shown in the Legend. The results of the three simulation sets have been shifted from each other, and are shown with unique colors, to better discriminate between them. The panels show the rate coefficients of the 16 individual reactions (top) and the scaling coefficients (bottom), which measure the factor of increase/decrease relative to the fiducial rate coefficients that was required to obtain the fit, for each reaction rate coefficient corresponding to the set of best-fitting simulations. Purple triangles in the top panel mark the experimentally deduced rate coefficients. The data corresponding to reactions 2 and 3 have been summed over so that a better correspondence to the experiments, which do not discriminate between the product branches, can be met. Error bars are not visible if they are smaller than the symbol, or, in the case of the summed-up reactions 2 and 3, due to the fact that error bars are not defined in each direction which prevents the summation method of Barlow (2004) being used in a well-defined manner. |
References
- Adams, N. G., & Smith, D. 1981, ApJ, 248, 373 [NASA ADS] [CrossRef] [Google Scholar]
- Aguado, A., Barragán, P., Prosmiti, R., et al. 2010, J. Chem. Phys., 133, 024306 [NASA ADS] [CrossRef] [Google Scholar]
- Allmendinger, P., Deiglmayr, J., Höveler, K., Schullian, O., & Merkt, F. 2016a, J. Chem. Phys., 145, 244316 [NASA ADS] [CrossRef] [Google Scholar]
- Allmendinger, P., Deiglmayr, J., Schullian, O., et al. 2016b, Chem. Phys. Chem., 17, 3596 [NASA ADS] [CrossRef] [Google Scholar]
- Baer, M., & Ng, C. Y. 1990, J. Chem. Phys., 93, 7787 [CrossRef] [Google Scholar]
- Barlow, R. 2004, arXiv e-prints [arXiv:physics/0406120] [Google Scholar]
- Bayet, E., Awad, Z., & Viti, S. 2010, ApJ, 725, 214 [NASA ADS] [CrossRef] [Google Scholar]
- Caselli, P., van der Tak, F. F. S., Ceccarelli, C., & Bacmann, A. 2003, A&A, 403, L37 [CrossRef] [EDP Sciences] [Google Scholar]
- Caselli, P., Sipilä, O., & Harju, J. 2019, Phil. Trans. R. Soc. London, Ser. A, 377, 20180401 [Google Scholar]
- Dashevskaya, E. I., Litvin, I., Nikitin, E. E., & Troe, J. 2016, J. Chem. Phys., 145, 244315 [NASA ADS] [CrossRef] [Google Scholar]
- Douglass, C. H., McClure, D. J., & Gentry, W. R. 1977, J. Chem. Phys., 67, 4931 [CrossRef] [Google Scholar]
- Drozdovskaya, M. N., Schroeder I, I. R. H. G., Rubin, M., et al. 2021, MNRAS, 500, 4901 [Google Scholar]
- Eaker, C. W., & Schatz, G. C. 1985, J. Phys. Chem., 89, 2612 [CrossRef] [Google Scholar]
- Gerlich, D. 1992, Adv. Chem. Phys., 83, 1 [Google Scholar]
- Gerlich, D., & Schlemmer, S. 2002, Planet. Space Sci., 50, 1287 [NASA ADS] [CrossRef] [Google Scholar]
- Gerlich, D., Herbst, E., & Roueff, E. 2002, Planet. Space Sci., 50, 1275 [NASA ADS] [CrossRef] [Google Scholar]
- Gerlich, D., Windisch, F., Hlavenka, P., Plašil, R., & Glosik, J. 2006, Phil. Trans. R. Soc. London, Ser. A, 364, 3007 [Google Scholar]
- Gerlich, D., Plašil, R., Zymak, I., et al. 2013, J. Phys. Chem. A, 117, 10068 [CrossRef] [Google Scholar]
- Giles, K., Adams, N. G., & Smith, D. 1992, J. Phys. Chem., 96, 7645 [CrossRef] [Google Scholar]
- Glenewinkel-Meyer, T., & Gerlich, D. 1997, Isr. J. Chem., 37, 343 [CrossRef] [Google Scholar]
- Glosík, J. 1994, Int. J. Mass Spectrom. Ion Processes, 139, 15 [CrossRef] [Google Scholar]
- Gómez-Carrasco, S., González-Sánchez, L., Aguado, A., et al. 2012, J. Chem. Phys., 137, 094303 [CrossRef] [Google Scholar]
- Hily-Blant, P., Faure, A., Rist, C., Pineau des Forêts, G., & Flower, D. R. 2018, MNRAS, 477, 4454 [NASA ADS] [CrossRef] [Google Scholar]
- Höveler, K., Deiglmayr, J., Agner, J. A., Schmutz, H., & Merkt, F. 2021a, Phys. Chem. Chem. Phys., 23, 2676 [CrossRef] [Google Scholar]
- Höveler, K., Deiglmayr, J., & Merkt, F. 2021b, Mol. Phys., 119, e1954708 [CrossRef] [Google Scholar]
- Hugo, E., Asvany, O., & Schlemmer, S. 2009, J. Chem. Phys., 130, 164302 [Google Scholar]
- Jiménez-Redondo, M., Carrasco, E., Herrero, V. J., & Tanarro, I. 2011, Phys. Chem. Chem. Phys., 13, 9655 [CrossRef] [Google Scholar]
- Jusko, P., Jiménez-Redondo, M., & Caselli, P. 2024, Mol. Phys., 122, e2217744 [NASA ADS] [CrossRef] [Google Scholar]
- Krenos, J. R., Lehmann, K. K., Tully, J. C., Hierl, P. M., & Smith, G. P. 1976, Chem. Phys., 16, 109 [NASA ADS] [CrossRef] [Google Scholar]
- McCall, B. J., & Oka, T. 2000, Science, 287, 1941 [NASA ADS] [CrossRef] [Google Scholar]
- Merkt, F., Höveler, K., & Deiglmayr, J. 2022, J. Phys. Chem. Lett., 13, 864 [CrossRef] [Google Scholar]
- Milenko, Y., Karnatsevich, L., & Kogan, V. 1972, Physica, 60, 90 [NASA ADS] [CrossRef] [Google Scholar]
- Millar, T. J. 2002, Planet. Space Sci., 50, 1189 [CrossRef] [Google Scholar]
- Millar, T. J., Bennett, A., & Herbst, E. 1989, ApJ, 340, 906 [NASA ADS] [CrossRef] [Google Scholar]
- Millar, T. J., Walsh, C., de Sande, M. V., & Markwick, A. J. 2024, A&A, 682, A109 [NASA ADS] [CrossRef] [EDP Sciences] [Google Scholar]
- Oka, T. 2013, Chem. Rev., 113, 8738 [NASA ADS] [CrossRef] [Google Scholar]
- Paul, W., Schlemmer, S., Lücke, B., & Gerlich, D. 1996, Chem. Phys., 209, 265 [NASA ADS] [CrossRef] [Google Scholar]
- Pollard, J. E., Johnson, L. K., Lichtin, D. A., & Cohen, R. B. 1991, J. Chem. Phys., 95, 4877 [CrossRef] [Google Scholar]
- Ramanlal, J., Polyansky, O. L., & Tennyson, J. 2003, A&A, 406, 383 [NASA ADS] [CrossRef] [EDP Sciences] [Google Scholar]
- Sanz-Sanz, C., Aguado, A., Roncero, O., & Naumkin, F. 2015, J. Chem. Phys., 143, 234303 [NASA ADS] [CrossRef] [Google Scholar]
- Savić, I., Schlemmer, S., & Gerlich, D. 2020, Chem. Phys. Chem., 21, 1429 [CrossRef] [Google Scholar]
- Shimonishi, T., Izumi, N., Furuya, K., & Yasui, C. 2021, ApJ, 922, 206 [NASA ADS] [CrossRef] [Google Scholar]
- Sipilä, O., Caselli, P., & Harju, J. 2015a, A&A, 578, A55 [Google Scholar]
- Sipilä, O., Harju, J., Caselli, P., & Schlemmer, S. 2015b, A&A, 581, A122 [NASA ADS] [CrossRef] [EDP Sciences] [Google Scholar]
- Sipilä, O., Harju, J., & Caselli, P. 2017, A&A, 607, A26 [NASA ADS] [CrossRef] [EDP Sciences] [Google Scholar]
- Suleimanov, Y. V., Aguado, A., Gómez-Carrasco, S., & Roncero, O. 2018, J. Phys. Chem. Lett., 9, 2133 [CrossRef] [Google Scholar]
- Tennyson, J. 1995, Rep. Prog. Phys., 58, 421 [NASA ADS] [CrossRef] [Google Scholar]
- Theard, L. P., & Huntress, W. T. 1974, J. Chem. Phys., 60, 2840 [CrossRef] [Google Scholar]
- Verhaegh, K., Lipschultz, B., Harrison, J. R., et al. 2021, Nucl. Fusion, 61, 106014 [CrossRef] [Google Scholar]
- Wakelam, V., Herbst, E., Loison, J.-C., et al. 2012, ApJS, 199, 21 [Google Scholar]
- Walmsley, C. M., & Flower, D. R. 2004, A&A, 418, 1035 [NASA ADS] [CrossRef] [EDP Sciences] [Google Scholar]
- Willacy, K., & Woods, P. M. 2009, ApJ, 703, 479 [NASA ADS] [CrossRef] [Google Scholar]
- Woon, D. E., & Herbst, E. 2009, ApJS, 185, 273 [Google Scholar]
- Xie, Z., Braams, B. J., & Bowman, J. M. 2005, J. Chem. Phys., 122, 224307 [CrossRef] [Google Scholar]
All Tables
Comparison of the rate coefficients obtained in this work with values available in the literature below 100 K. All values are in 10−10 cm3 s−1.
Averaged rate coefficients, based on the spin−state resolved data given in Sipilä et al. (2017), for four selected temperatures.
All Figures
|
Fig. 1 Experimental number of ions in the trap as a function of trapping time for the D3+ + H2 experiment at 27 K. σ represents the sum of all ions. H2D+ and D2H+ undergo subsequent reactions with H2, eventually leading to the formation of H3+. |
| In the text | |
|
Fig. 2 Rate coefficients as a function of temperature for the eight reactions studied in the 22 pole trap experiments. The symbols correspond to the measurements, and the lines represent the fit to the Arrhenius-Kooij formula with the parameters given in Table 1. |
| In the text | |
|
Fig. 3 Number of ions as a function of reaction time in a simulation mimicking the D3+ + H2 experiment, where the gas initially only consists of D3+ and H2. The results are shown for simulations run at 15 (left) and 50 K (right). The solid lines represent simulations using the averaged rate coefficients, and the markers represent a simulation where spin states have been explicitly included, but summed over afterward. |
| In the text | |
|
Fig. 4 Number of the four ions as a function of reaction time in the H3+ + D2 experiment at a temperature of 21.6 K and a D2 number density of 9.83 × 109cm−3. The solid lines represent the best-fitting simulation results, and the markers with error bars represent the experimental number of ions. |
| In the text | |
|
Fig. 5 Rate coefficients of various reactions, as indicated above each panel, as a function of temperature. The filled red, orange, and green circles indicate simulated rate coefficients based on the H3+ + D2, D2H+ + H2, and D3+ + H2 systems, respectively. The error bars are defined as in Fig. B.1. The values for the H3+ + D2 reaction are sums over the two product branches, that is, reactions 2 and 3 as given in Table3. The rate coefficients of the H2D+ + H2 → H3+ + HD, D2H+ + H2 → H2D+ + HD, and D3+ + H2 → D2H+ + HD reactions are both constrained by the D2H+ + H2 and the D3+ + H2 experimental systems and hence appear in two colors (D2H+ + H2 in orange; D3+ + H2 in green); the data have been offset by 3 K for better visibility of the error bars. The solid black lines indicate the experimentally deduced rate coefficients; these data are missing for the H2D+ + H2 → H3+ + HD reaction because they could not be determined experimentally. The dashed magenta lines show the rate coefficient values as derived from the Hugo et al. (2009) data (see also Table 3). |
| In the text | |
|
Fig. A.1 Rate coefficients as a function of temperature for the HeH+ and HeD+ reactions with H2 studied in the 22 pole trap experiments. Symbols correspond to the measurements, while lines represent the fit to the Arrhenius-Kooij formula with the parameters given in Table 1. |
| In the text | |
|
Fig. B.1 Data collected from the best-fitting simulations of the H3+ + D2 experiment at 21.6 K. The reaction number refers to the list in Table 3. Results are shown for three sets of simulations corresponding to the three different variations of the experiment, where the number density of the neutral reactant (D2) is varied as shown in the Legend. The results of the three simulation sets have been shifted from each other, and are shown with unique colors, to better discriminate between them. The panels show the rate coefficients of the 16 individual reactions (top) and the scaling coefficients (bottom), which measure the factor of increase/decrease relative to the fiducial rate coefficients that was required to obtain the fit, for each reaction rate coefficient corresponding to the set of best-fitting simulations. Purple triangles in the top panel mark the experimentally deduced rate coefficients. The data corresponding to reactions 2 and 3 have been summed over so that a better correspondence to the experiments, which do not discriminate between the product branches, can be met. Error bars are not visible if they are smaller than the symbol, or, in the case of the summed-up reactions 2 and 3, due to the fact that error bars are not defined in each direction which prevents the summation method of Barlow (2004) being used in a well-defined manner. |
| In the text | |
Current usage metrics show cumulative count of Article Views (full-text article views including HTML views, PDF and ePub downloads, according to the available data) and Abstracts Views on Vision4Press platform.
Data correspond to usage on the plateform after 2015. The current usage metrics is available 48-96 hours after online publication and is updated daily on week days.
Initial download of the metrics may take a while.