Fig. 5
Download original image
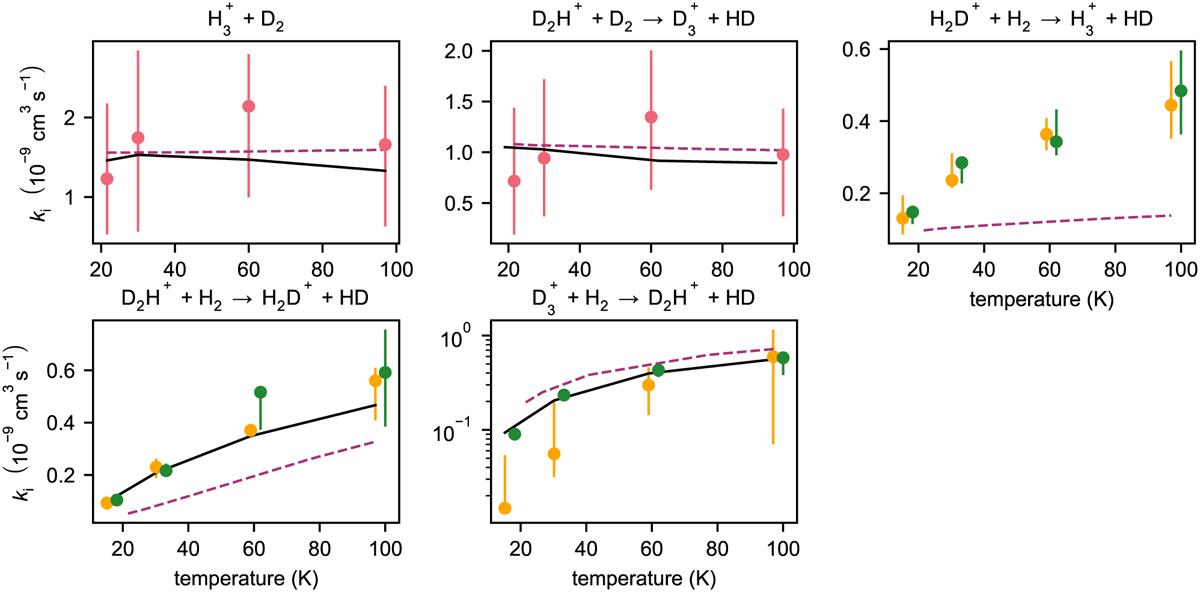
Rate coefficients of various reactions, as indicated above each panel, as a function of temperature. The filled red, orange, and green circles indicate simulated rate coefficients based on the H3+ + D2, D2H+ + H2, and D3+ + H2 systems, respectively. The error bars are defined as in Fig. B.1. The values for the H3+ + D2 reaction are sums over the two product branches, that is, reactions 2 and 3 as given in Table3. The rate coefficients of the H2D+ + H2 → H3+ + HD, D2H+ + H2 → H2D+ + HD, and D3+ + H2 → D2H+ + HD reactions are both constrained by the D2H+ + H2 and the D3+ + H2 experimental systems and hence appear in two colors (D2H+ + H2 in orange; D3+ + H2 in green); the data have been offset by 3 K for better visibility of the error bars. The solid black lines indicate the experimentally deduced rate coefficients; these data are missing for the H2D+ + H2 → H3+ + HD reaction because they could not be determined experimentally. The dashed magenta lines show the rate coefficient values as derived from the Hugo et al. (2009) data (see also Table 3).
Current usage metrics show cumulative count of Article Views (full-text article views including HTML views, PDF and ePub downloads, according to the available data) and Abstracts Views on Vision4Press platform.
Data correspond to usage on the plateform after 2015. The current usage metrics is available 48-96 hours after online publication and is updated daily on week days.
Initial download of the metrics may take a while.