Fig. B.1
Download original image
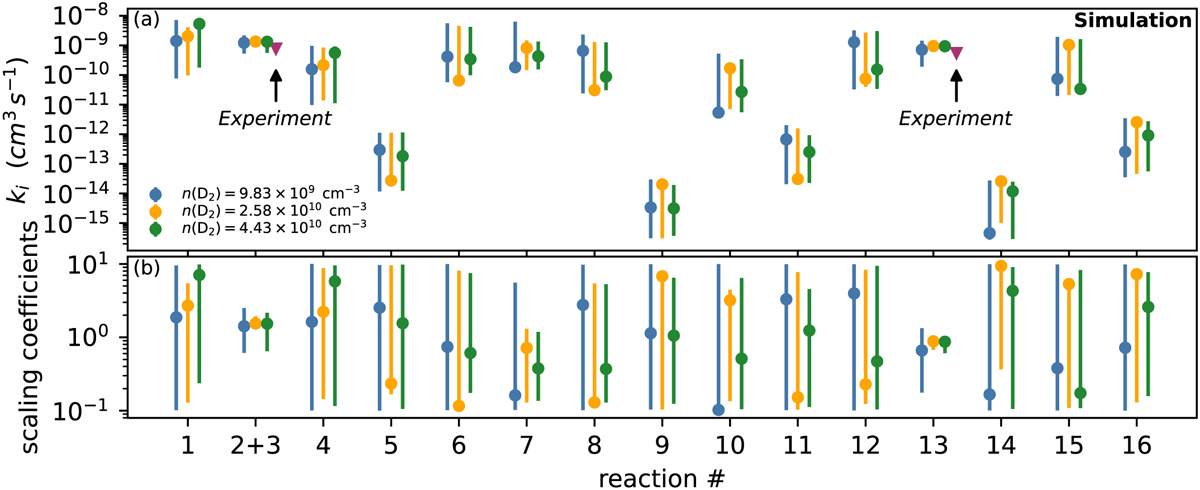
Data collected from the best-fitting simulations of the H3+ + D2 experiment at 21.6 K. The reaction number refers to the list in Table 3. Results are shown for three sets of simulations corresponding to the three different variations of the experiment, where the number density of the neutral reactant (D2) is varied as shown in the Legend. The results of the three simulation sets have been shifted from each other, and are shown with unique colors, to better discriminate between them. The panels show the rate coefficients of the 16 individual reactions (top) and the scaling coefficients (bottom), which measure the factor of increase/decrease relative to the fiducial rate coefficients that was required to obtain the fit, for each reaction rate coefficient corresponding to the set of best-fitting simulations. Purple triangles in the top panel mark the experimentally deduced rate coefficients. The data corresponding to reactions 2 and 3 have been summed over so that a better correspondence to the experiments, which do not discriminate between the product branches, can be met. Error bars are not visible if they are smaller than the symbol, or, in the case of the summed-up reactions 2 and 3, due to the fact that error bars are not defined in each direction which prevents the summation method of Barlow (2004) being used in a well-defined manner.
Current usage metrics show cumulative count of Article Views (full-text article views including HTML views, PDF and ePub downloads, according to the available data) and Abstracts Views on Vision4Press platform.
Data correspond to usage on the plateform after 2015. The current usage metrics is available 48-96 hours after online publication and is updated daily on week days.
Initial download of the metrics may take a while.