Fig. 10.
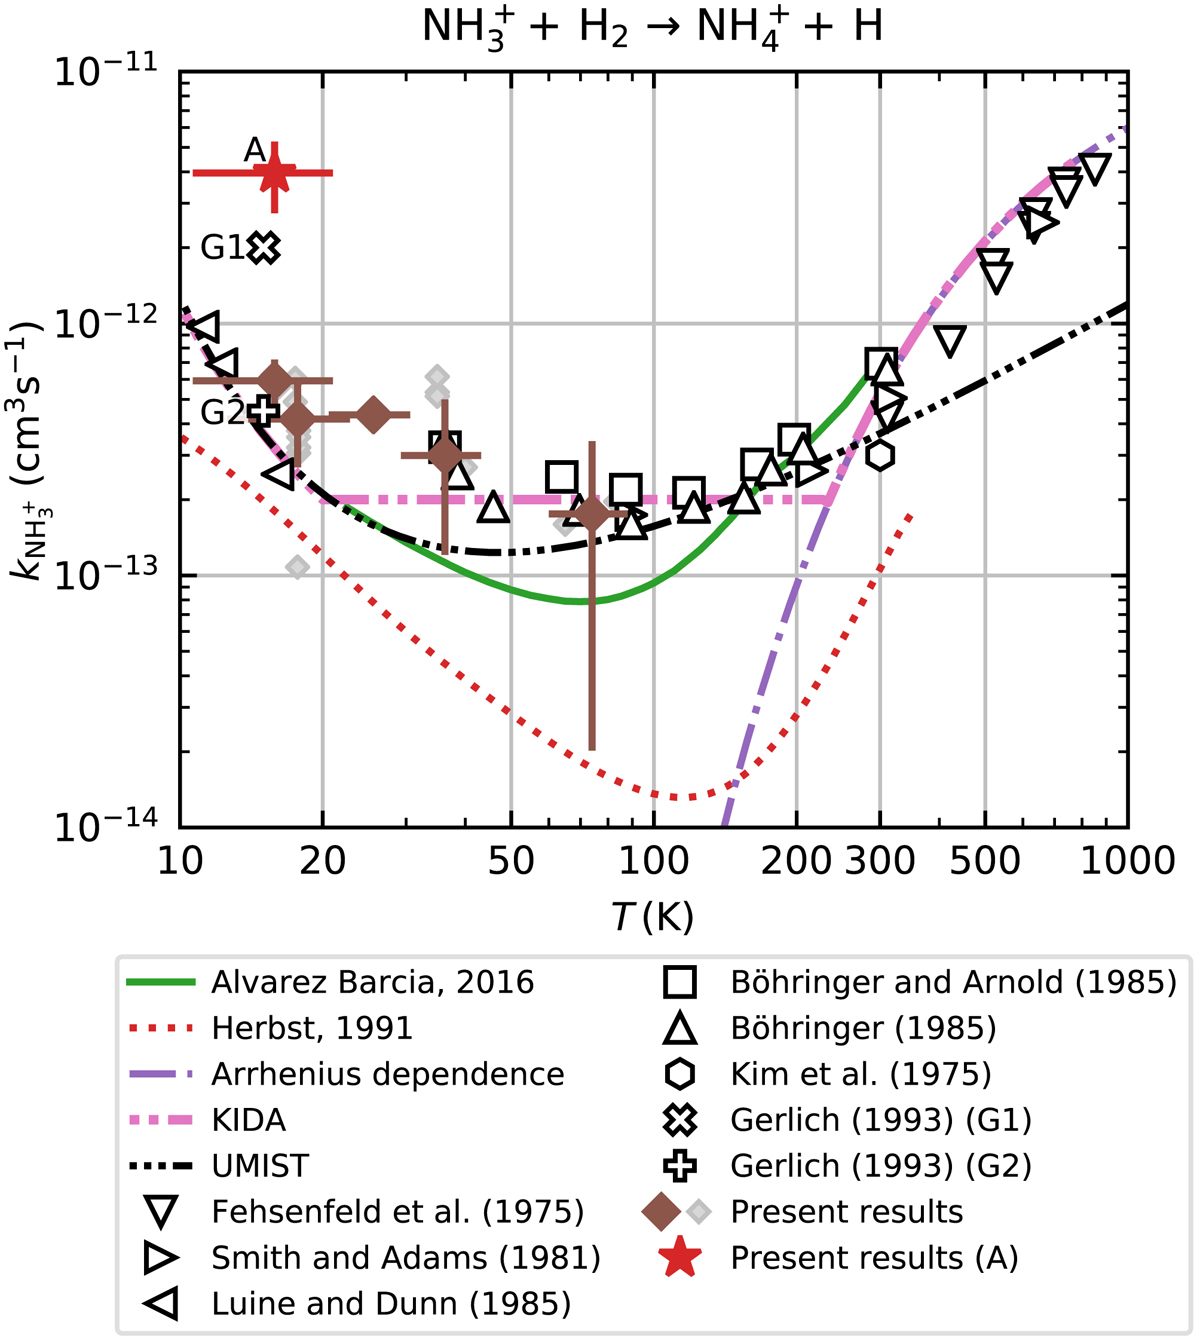
The temperature dependence of the reaction rate coefficient ![]() . The binned present data measured with long trapping times are indicated with the full diamonds. The raw data without binning are indicated with the smaller points. Present data measured with short trapping time are indicated with a red star (label A). The points labelled as G1 and G2 are the values measured by Gerlich (1993) using short and long trapping time, respectively. Previous experimentally determined binary rate coefficient are taken from Fehsenfeld et al. (1975), Kim et al. (1975), Smith & Adams (1981), Adams & Smith (1984), Luine & Dunn (1985), Böhringer & Arnold (1985), Böhringer (1985), Barlow & Dunn (1987). The plotted theoretical temperature dependences were calculated by Herbst et al. (1991) (dashed line) and by Álvarez-Barcia et al. (2016) (solid line). The dash dotted line indicates the Arrhenius dependence obtained by the fit of the data measured at temperatures above 300 K (Fehsenfeld et al. 1975). Included are also the temperature dependences recommended by KIDA (Wakelam et al. 2012) and by UMIST (McElroy et al. 2013).
. The binned present data measured with long trapping times are indicated with the full diamonds. The raw data without binning are indicated with the smaller points. Present data measured with short trapping time are indicated with a red star (label A). The points labelled as G1 and G2 are the values measured by Gerlich (1993) using short and long trapping time, respectively. Previous experimentally determined binary rate coefficient are taken from Fehsenfeld et al. (1975), Kim et al. (1975), Smith & Adams (1981), Adams & Smith (1984), Luine & Dunn (1985), Böhringer & Arnold (1985), Böhringer (1985), Barlow & Dunn (1987). The plotted theoretical temperature dependences were calculated by Herbst et al. (1991) (dashed line) and by Álvarez-Barcia et al. (2016) (solid line). The dash dotted line indicates the Arrhenius dependence obtained by the fit of the data measured at temperatures above 300 K (Fehsenfeld et al. 1975). Included are also the temperature dependences recommended by KIDA (Wakelam et al. 2012) and by UMIST (McElroy et al. 2013).
Current usage metrics show cumulative count of Article Views (full-text article views including HTML views, PDF and ePub downloads, according to the available data) and Abstracts Views on Vision4Press platform.
Data correspond to usage on the plateform after 2015. The current usage metrics is available 48-96 hours after online publication and is updated daily on week days.
Initial download of the metrics may take a while.