| Issue |
A&A
Volume 624, April 2019
|
|
|---|---|---|
| Article Number | A139 | |
| Number of page(s) | 8 | |
| Section | Stellar structure and evolution | |
| DOI | https://doi.org/10.1051/0004-6361/201935095 | |
| Published online | 26 April 2019 | |
Sensitivity of Type Ia supernovae to electron capture rates
E.T.S. Arquitectura del Vallès, Universitat Politècnica de Catalunya, Carrer Pere Serra 1-15, 08173 Sant Cugat del Vallès, Spain
e-mail: This email address is being protected from spambots. You need JavaScript enabled to view it.
Received:
22
January
2019
Accepted:
8
March
2019
Abstract
The thermonuclear explosion of massive white dwarfs is believed to explain at least a fraction of Type Ia supernovae (SNIa). After thermal runaway, electron captures on the ashes left behind by the burning front determine a loss of pressure, which impacts the dynamics of the explosion and the neutron excess of matter. Indeed, overproduction of neutron-rich species such as 54Cr has been deemed a problem of Chandrasekhar-mass models of SNIa for a long time. I present the results of a sensitivity study of SNIa models to the rates of weak interactions, which have been incorporated directly into the hydrodynamic explosion code. The weak rates have been scaled up or down by a factor ten, either globally for a common bibliographical source, or individually for selected isotopes. In line with previous works, the impact of weak rates uncertainties on sub-Chandrasekhar models of SNIa is almost negligible. The impact on the dynamics of Chandrasekhar-mass models and on the yield of 56Ni is also scarce. The strongest effect is found on the nucleosynthesis of neutron-rich nuclei, such as 48Ca, 54Cr, 58Fe, and 64Ni. The species with the highest influence on nucleosynthesis do not coincide with the isotopes that contribute most to the neutronization of matter. Among the latter, there are protons, 54, 55Fe, 55Co, and 56Ni, while the main influencers are 54, 55Mn and 55 − 57Fe, in disagreement with Parikh et al (2013, A&A, 557, A3), who found that SNIa nucleosynthesis is most sensitive to the β+-decay rates of 28Si, 32S, and 36Ar. An increase in all weak rates on pf-shell nuclei would affect the dynamical evolution of burning bubbles at the beginning of the explosion and the yields of SNIa.
Key words: nuclear reactions / nucleosynthesis / abundances / supernovae: general / white dwarfs
© ESO 2019
1. Introduction
Weak interactions on iron-group nuclei (IGN) play a key role in the late stages of stellar evolution. In Type II supernovae first electron captures in the iron core reduce the pressure and start the collapse and, later, beta-decays on neutron-rich nuclei contribute appreciably to the neutrino flux, help to regulate the core temperature (Aufderheide et al. 1990), and leave an imprint on the nucleosynthetic yield of the innermost ejected shells (Langanke et al. 2011). Aufderheide et al. (1994) studied the most relevant electron captures in the pre-supernova evolution of massive stars, and identified many IGN that may have an influence on the conditions at supernova core collapse. These nuclei were subsequently targets of theoretical studies to refine the associated weak rates. As another example, electron capture supernovae (see Gil-Pons et al. 2018, for a recent review) are predicted to be triggered by the transmutation of the late nucleosinthetic products of the most massive intermediate-mass stars with low metallicity progenitors (Miyaji et al. 1980).
The relevance of weak interactions for Type Ia supernovae (SNIa) depends on the progenitor system. Nowadays, there is debate about the nature of SNIa progenitors, whether they are more or less massive white dwarfs (WD), and whether they are part of a single degenerate or a double degenerate binary system. While all of these scenarios have several points in favour and against (Chomiuk et al. 2012; Jacobson-Galán et al. 2018; Kilpatrick et al. 2018; Rebassa-Mansergas et al. 2019, to cite only a few), there are indications that SNIa may be produced by a combination of all of them (e.g. Sasdelli et al. 2017; Liu et al. 2018). In SNIa triggered by the explosion of massive WDs, first, during the pre-supernova carbon simmering phase, electron captures and beta decays drive the equilibrium configuration of the star in response to mass accretion from a companion star; later, electron captures destabilize the WD and start the dynamical phase of the explosion (e.g. Yokoi et al. 1979; Chamulak et al. 2008; Piersanti et al. 2017). Early during the explosion, electron captures on IGN reduce the electron pressure and affect the dynamical evolution and the nucleosynthesis of SNIa. On the other hand, SNIa coming from the explosion of sub-Chandrasekhar mass WDs (Woosley & Weaver 1994; Fink et al. 2010; Shen et al. 2018) are not expected to be affected by either electron captures or beta-decays during the pre-explosive or explosive phases. However, explosion of WDs more massive than ∼1 M⊙ may drive the central regions to densities and temperatures high enough that the electron mole number changes significantly.
The sensitivity of SNIa nucleosynthesis to the weak rates adopted in their modelling has been analysed in a few works with conflicting results. Brachwitz et al. (2000) probed the consequences of a global change in the stellar weak rates of IGN owing to new shell model calculations of the Gamow-Teller (GT+) strength distribution of pf-shell nuclei (Dean et al. 1998). These authors found a systematic shift in the centroid of the GT+ strength distribution and lower stellar weak rates than prior models. They explored the thermonuclear explosions of Chandrasekhar-mass WDs with central densities in the range (1.7 − 2.1)×109 g cm−3, applying approximate factors to correct for the GT+ centroid offset in those nuclei for which the shell model was not available. The new rates improve the nucleosynthesis, reducing the historical excess production of several neutron-rich isotopes of chromium, titanium, iron, and nickel, among others, in SNIa models. They noticed that protons dominate the neutronization during SNIa explosions and, since their weak rate is not affected by the uncertainties plaguing electron capture rates on IGN, the overall neutronization only depends weakly on these uncertainties. They also identified odd-A and odd–odd nuclei as the largest contributors to WD neutronization besides protons.
On the other hand, Parikh et al. (2013) analysed one three-dimensional model of SNIa and the classical one-dimensional W7 model (Thielemann et al. 1986) and found maximal sensitivity of SNIa nucleosynthesis to the electron capture rates of the α elements 28Si, 32S, and 36Ar, whereas electron captures on IGN had little impact on the explosion. Recently, Mori et al. (2016) have studied the impact that recent alternatives to the shell model calculations of Dean et al. (1998) have on SNIa nucleosynthesis; these calculations were motivated by new experimental data on the electron capture rates on 56Ni and 55Co. These data call for differences in the GT+ strength distribution, leading to reduced electron capture rates. Mori et al. (2016) found that the overall yields of the explosion are affected at most by 2 − 3%. Both Mori et al. (2016) and Parikh et al. (2013) based their sensitivity study on modifying the nuclear rates in nuclear post-processing, meaning that the sensitivity study was decoupled from the supernova hydrodynamics.
In the present work, I explore the sensitivity of SNIa hydrodynamics and nucleosynthesis to the rates of weak interactions during the dynamic phase of the explosion, using a one-dimensional hydrocode with a large nuclear network that makes it unnecessary to post-process the thermodynamic trajectories to obtain the nucleosynthesis. The hydrodynamic model is run for each modification of a weak rate, thus making the calculation of the hydrodynamics and nucleosynthesis consistent. I explore a range of WD central density and mass, and modify the weak rates globally, according to their source in the literature, and individually for the isotopes that contribute most to the neutronization of the ejected matter.
2. Explosion models
2.1. Setup
I have computed SNIa explosion models in spherical symmetry starting from sub-Chandrasekhar (sub-MCh) and Chandrasekhar-mass (MCh) WDs. The hydrocode integrates simultaneously the hydrodynamics and the nuclear network, and has been described in detail by Bravo et al. (2019). Here, I focus on the behaviour of models suitable for normal-luminosity SNIa, characterized by an ejected mass of 56Ni of the order of M(56Ni)∼0.5 − 0.7 M⊙. To this end, I have selected two base models: one describing the central detonation (DETO) of a sub-MCh WD of mass MWD = 1.06 M⊙, and the other belonging to the delayed detonation (DDT) of a MCh WD with central density in the range ρc = (2 − 5)×109 g cm−3, thus extending the range of ρc explored by Brachwitz et al. (2000). The DDT model is characterized by the following two parameters: the density of transition, ρDDT, from a deflagration (subsonic flame propagation near the centre of the WD) to a detonation (supersonic combustion wave), and the velocity of the flame during the deflagration phase, vdef, usually prescribed as a fraction of the local sound velocity, vsound. The configuration parameters are given in Table 1 together with the main explosion properties, i.e. kinetic energy, K, and M(56Ni).
Cases studied.
Models S, S+, C3, C3_1p2, and C3_4p0 in Table 1 are the same as models 1p06_Z9e-3_std, 1p15_Z9e-3_std, ddt2p4_Z9e-3_std, ddt1p2_Z9e-3_std, and ddt4p0_Z9e-3_std in Bravo et al. (2019), and all the details of the code and the models are the same as in that paper unless otherwise stated in what follows. The remaining models reported in this work share the same initial composition as C3 and use the same set of thermonuclear reaction rates. I explored the impact of different weak rates for various parameters of the DDT and for different initial central densities, but most of the simulations are variations of model C3. Its central density at thermal runaway, ρc = 3 × 10⁹ g cm−3, is that suggested by some recent studies of the carbon simmering phase (Martínez-Rodríguez et al. 2016; Piersanti et al. 2017). A central density as high as ρc = 5 × 10⁹ g cm−3, or even higher, has been invoked to explain the composition of particular SNIa events (Dave et al. 2017), while a value as low as ρc = 2 × 10⁹ g cm−3provides the best nucleosynthetic match with the solar system ratios of the IGN (Brachwitz et al. 2000; Mori et al. 2016).
All models in Table 1 share the same set of weak reaction rates; the results of their modification are given later. In the next section, I explain the details of the weak rates incorporated to the models.
2.2. Weak rates
At the high densities characteristic of the central layers of exploding WDs, electron captures are favoured relative to β+ decays because the Fermi-Dirac distribution of degenerate electrons allows an enhancement in the electron capture rate, whereas β+ decays remain insensitive to the density (Sarriguren 2016). The Fermi energy of the electrons depends on density as EF ≃ me[(ρ6Ye)1/3−1] with an accuracy better than 98% for ρ6 > 103, where ρ6 is the density in units of 106 g cm−3, Ye is the electron mole number in mol g−1, and me = 0.511 MeV is the mass of the electron in energy units. In SNIa, most of the neutronization takes place on matter that is in a nuclear statistical equilibrium (NSE) state, at temperatures of the order of T ∼ 9 × 10⁹ K, where the Fermi energy of the electrons is EF ∼ 3.5 − 8 MeV.
Stellar electron capture rates are dominated by allowed GT+ transitions, which allow a change of the nuclear angular momentum from parent to child nuclei by ΔJ = 0, ±1. Theory and experiment on ground state GT distribution agree, generally, within a factor ∼2 (Wiescher et al. 2012), but when the electron chemical potential (close to the electron Fermi energy) is similar to the reaction Q-value, the rates are sensitive to the detailed GT+ distribution, and such distributions cannot be measured from excited states. In theoretical models, the transitions starting from excited states are treated according to the Brink (or Brink-Axel) hypothesis: the GT+ strength distribution from excited states is the same as from the ground state, shifted by the energy of the excited state. However, the applicability of the Brink hypothesis to excited states with low excitation energy is uncertain (e.g. Misch et al. 2014).
Fuller et al. (1980, 1982a,b) calculated weak interaction rates for nuclei in the mass range A = 21 − 60 in the IPM approximation (independent-particle model), but the shell model was applied only to sd-shell nuclei (A = 17 − 40). Later, Oda et al. (1994) revised the rates on sd-shell nuclei including new relevant experimental information. Dean et al. (1998) applied the shell model to the pf-shell nuclei with experimental data on the GT+ strength distribution, i.e. 51V, 55Mn, 54, 56Fe, 59Co, and 58, 60, 62, 64Ni, most of these are even–even nuclei; they also predicted the stellar weak rates for other nuclei belonging to the iron group. Cole et al. (2012) analysed new experimental data on the GT+ strength distribution on pf-shell nuclei, including those already considered by Dean et al. (1998) plus 45Sc, 48Ti, 50V, and 64Zn. Cole et al. (2012) found that the experimental electron captures rates on 54, 56Fe were higher than the theoretical rates (Caurier et al. 1999; Langanke & Martínez-Pinedo 2000, 2001) by as much as a factor two in the conditions of SNIa. Fantina et al. (2012) analysed the same two isotopes of iron from a purely theoretical point of view, taking into account the uncertainties associated with the different nuclear model parameters, and concluded that the weak rates on these nuclei could change by as much as two orders of magnitude for the whole set of parameters explored. Sarriguren (2013, 2016) revisited the effect of excited states of iron-group nuclei and concluded that thermal excitation of nuclei in SNIa can lead to overall electron capture rates higher as well as lower than those accounting only for transitions from the parent ground state. In either case, the associated uncertainty is similar to that derived from nuclear structure.
In all the models presented in this work, weak interaction rates are adopted from, in order of precedence, Martínez-Pinedo et al. (2000; hereafter, MPLD00), Oda et al. (1994; hereafter, Oda94), Pruet & Fuller (2003; hereafter, PF03), and Fuller et al. (1982b; hereafter, FFN82). For instance, if a rate appears both in MPLD00 and in FFN82, the former is the choice. The tables are interpolated following the procedure described in Fuller et al. (1985). Figure 1 shows the sources of each weak rate in the proton number versus baryon number plane.
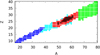 |
Fig. 1. Sources of tabulated weak interaction rates. Colours identify the source of weak rates on a species: FFN82 is indicated in cyan, Oda94 in blue, MPLD00 in red, and PF03 in green. The weak rates on protons, not shown in the graph, are taken from MPLD00. The species with the most influencial individual weak rates (Sect. 4.2) are highlighted with an open black square. All of these belong to the MPLD00 tabulation. |
Table 2 gives the overall change in Ye as a result of electron captures and β+ decays, on the one hand, and of β− decays, on the other hand, for the sub-MCh models and for the MCh models with different initial central densities. Table 2 also lists the species that contribute most to the change of Ye in each model (from here on, the neutronizers). As expected, β− decay contribution is negligible in all SNIa models. The two sub-MCh models experience a small change of the electron mole number in spite of their relatively high mass (for a sub-MCh model). The main neutronizers in the two models are 60Zn and 56Ni, as well as the protons in the S+ model.
Neutronizers: contributors to the overall ΔYe
In all MCh models, protons are the main source of neutronization, followed by several isotopes from the IGN, among which there are even–even, odd–odd, and odd-A nuclei. At the lowest ρc explored, the strongest neutronization is provided, besides protons, by 55Co and 56Ni, while, for increasing ρc, these two species are overtaken by the two iron isotopes 54, 55Fe. Among the IGN reported in Table 2, the only rates with direct experimental information about the GT+ distribution are 55Mn, 54, 56Fe, and 58, 60Ni.
3. Three-dimensional effects
In three-dimensional models of the thermonuclear explosion of massive WDs, thermal runaway is usually assumed to start in discrete volumes located slightly off-centre (bubbles). These bubbles tend to float owing to the expansion caused by the release of nuclear energy, and their density drops off sooner than if they remained at the centre and followed the expansion of the whole WD. Consequently the rate of neutronization drops off as well. In models working with standard electron capture rates, the timescale for the bubbles to start rising off the centre is ∼0.4 − 0.6 s (García-Senz & Bravo 2005; Byrohl et al. 2018), by which time most of the neutronization has taken place, and the results of the present work are applicable.
In case the weak rates increased by an order of magnitude, the time taken by the bubbles near the centre (therefore, at high density and neutronization rate) would increase sizeably. To estimate this time, I calculated the dynamic evolution of a hot bubble born near the centre of a WD, incorporating the effect of electron captures into the general scheme presented in Fisher & Jumper (2015). In their appendix, Fisher & Jumper (2015) wrote a second order differential equation for the evolution of the radial position, r, of a hot bubble, accounting for the floatation force and the drag on the bubble as follows:
![Mathematical equation: $$ \begin{aligned} \frac{\mathrm{d} }{\mathrm{d} t}\left[\frac{4\pi }{3}R^3\left(\rho _\mathrm{a} +\frac{1}{2}\rho _\mathrm{f} \right)\frac{\mathrm{d} r}{\mathrm{d} t}\right] = \frac{4\pi }{3}R^3\left(\,\rho _\mathrm{f} -\rho _\mathrm{a} \right)g\,, \end{aligned} $$](/articles/aa/full_html/2019/04/aa35095-19/aa35095-19-eq1.gif) (1)
(1)
where t is time since bubble ignition; R is the bubble radius, which is assumed to increase linearly with time (at constant flame velocity); g = g(r) is the local acceleration of gravity; ρf is the local density; and ρa is the density of ashes. To incorporate electron captures in this scheme in a simplified manner, I assumed that the burning is isobaric, which is valid near the centre of the WD, and that the main contribution to pressure is that of a completely degenerate gas of electrons. Then, the pressure, P is a function of the product ρYe and, to keep it constant, the bubble density changes with time according to
 (2)
(2)
Equation (1) can then be integrated numerically, starting from an initial radial coordinate of the bubble, r0.
Figure 2 shows the results for a WD of ρc = 3 × 10⁹ g cm−3, both for standard electron capture rates and for weak rates increased by a factor ten. With standard electron capture rates, the dynamical evolution of the bubble is similar to the results of complex three-dimensional simulations. However, with increased weak rates the bubble remains near the centre at high density for nearly a second. This shows that the weak rates have the potential of changing the overall dynamical evolution of MCh models.
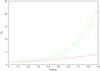 |
Fig. 2. Time evolution of the radial coordinate, r, of an incinerated bubble for a central density of the WD of ρc = 3 × 10⁹ g cm−3. The radial coordinate of the bubble is plotted normalized to its initial position, r0, for two cases: standard electron capture rates (green curve) and weak rates scaled up by a factor ten (red curve). |
4. Sensitivity of nucleosynthesis to the electron capture rates
In this section, I give the results of the sensitivity of the nucleosynthetic yields of the models to the modification of weak rates both globally, applying the same change to all rates coming from a given source (Sect. 4.1), and individually for selected nuclei (Sect. 4.2). In the last case, the sensitivity is measured by the logarithmic derivative, Di, j, of the mass ejected of nucleus i with respect to the enhancement factor of the weak rates on species j, fj, which is the factor by which these weak rates are scaled at every density and temperature,
 (3)
(3)
where mi, 10 is the mass of nucleus i ejected for fj = 10, and mi, 0.1 is the corresponding mass when fj = 0.1. Just to give a feeling of the meaning of Di, j, a value of Di, j ≈ 0.3 means that the abundance of nucleus i doubles for a constant enhancement factor of fj = 10. For the same enhancement factor, a value of Di, j ≈ 0.05 implies a relative change in the abundance of a nucleus by 12%, and a change of 2% would derive from Di, j ≈ 0.01.
All the sensitivity results are based on the computation of explosion models with individual or global changes in weak rates by factors of either fj = 10 or fj = 0.1. According to the discussion in Sect. 2.2, it is expected that the weak rates are known with better accuracy, of the order of a factor two. However, as most of the neutronizers weak rates are not tied by direct experimental results, I explore a slightly larger enhancement factor.
4.1. Modification of rates by sources
Table 3 shows the results of the models in Table 1 when all the weak rates tabulated in a given reference are scaled simultaneously by the same factor. In general, the sensitivity to an increase in the weak rates by a factor 10 is much larger than the sensitivity to a decrease in the rates by the same factor. The only exception is the decrease in the rates from MPLD00, including the rates on protons, in model C3, which causes a 10% increase in the yield of 56Ni and a decrease in the yield of several neutron-rich nuclei, such as that of 54Cr by nearly five orders of magnitude.
Sensitivity to a bulk change in the rates of a given source.
The sub-MCh models are very robust against changes in the weak rates. When the MPLD00 rates are increased by a factor ten, the kinetic energy changes just by 0.2% and the yield of 56Ni by 2%. However, it is interesting that the yield of stable nickel doubles that of the model with the standard weak rates.
Modifying the rates given by Oda94 in MCh models have practically no impact on the supernova explosion dynamics and nucleosynthesis. The modification of the FFN82 rates has no impact as well, although it should be recalled that I used their rates only when the isotope was not tabulated in the other sources of weak rates.
The strongest impact of the modification of weak rates is found when all the rates in MPLD00 are increased by a factor ten in model C3, leading to a 3% decrease in the final kinetic energy and a 13% decrease in the yield of 56Ni. In this same run, the yield of 48Ca increases by nearly six orders of magnitude, that of 54Cr increases by a factor 8.9, and the yield of 54Fe decreases by nearly 10%. However, in this model the proton weak rate was modified by the same factor as the weak rates on IGN, which seems unrealistic since the uncertainty on the proton weak rate is much smaller than those on IGN nuclei. Consequently, I ran the same model with all the rates in MPLD00 modified with the exception of those belonging to protons, for which the standard rate was applied. In this case, the impact is much smaller but still noticeable: the yield of 56Ni decreases by 6.6%, that of 48Ca increases by more than three orders of magnitude, and that of 54Cr increases by a factor 3.8, while the yield of 54Fe remains practically unaltered.
When the same modifications are applied to models C2, C4, and C5, in order to explore the effects of different ρc, the changes in the kinetic energy and the yield of 56Ni are similar to those for model C3, but the nucleosynthesis changes in a different way. The higher the initial central density, the less sensitive the yields of 48Ca and 54Cr to the modification of the weak rates. The yields of several other isotopes are especially sensitive to the weak rates only when ρc is within a particular range. For instance, this is the case of the yield of 80Se at ρc ∼ (4 − 5)×109 g cm−3.
With respect to the models with different deflagration velocity, models C3_100 and C3_500, I find that the nucleosynthesis is increasingly more sensitive to the modification of the weak rates of MPLD00 with increasing vdef. The reason is that, as the deflagration velocity increases, a higher mass is burnt before the white dwarf expands appreciably, then the matter in NSE has more time to capture electrons before weak rates freeze out. The deflagration-to-detonation transition density, ρDDT, does not influence the sensitivity of the explosion to weak rates. The apparent largest sensitivity of the yield of 56Ni in model C3_1p2 simply reflects the small amount of the isotope that is made out of NSE in this model. In absolute terms, the total change in M(56Ni) is very close for all three models with different ρDDT and the same ρc, ΔM(56Ni)=0.035 − 0.045 M⊙.
4.2. Modification of individual rates
Model C3 was rerun with selected weak interaction rates modified by either a factor fj = 10 or fj = 0.1. The selection criterium for choosing the rates to be modified was that they contributed to the global change of Ye in model C3 by at least 5 × 10⁻⁷ mol g−1. The individual rates explored were the electron captures plus β+ on and the β− decays to (all these were changed simultaneously by the same factor) the following list of species: 28Si, 29, 30P, 32S, 33, 34Cl, 36Ar, 50V, 48, 50 − 52Cr, 50, 51, 53 − 56Mn, 52 − 58Fe, 54 − 60Co, 55 − 61Ni, 58 − 61Cu, 60Zn. Although electron captures on protons dominate the neutronization, I excluded these from the list because of the smaller uncertainty of their tabulated weak rate.
The kinetic energy in all these models changed by less than 1% with respect to the reference model C3, and the mass of ejected 56Ni changed by less than 1% in all but the models with the rates on 55, 56Co or 56Ni modified, in which it changed by less than 2%.
Table 4 lists, sorted by |Di, j|, the species (from now on, the influencers) whose weak rates caused a strong impact on any species with a non-negligible yield. The list is leaded by iron isotopes, then manganese isotopes and cobalt isotopes. To be precise, the top influencer is 57Fe, whose Di, j = 0.5 in relation to the production of 48Ca, which means that the yield of the last isotope would change by a factor three if the weak rate on 57Fe increased by a factor ten. 54, 55Mn and 55, 56Fe also stand out among the top influencers, and all of these impact most the production of 48Ca and then of 64Ni.
Influencers: species whose weak rates modification has a large impact on the yield of any other species.
These findings contradict the results of Parikh et al. (2013), who identified the rates on 28Si, 32S, and 36Ar as the most influential for the MCh scenario, whereas the weak rates on IGN had little impact on the nucleosynthesis. The origin of the discrepancy can be traced back to the treatment of weak rates while matter is in a NSE state. Parikh et al. (2013) had overlooked to account for the effect of changes in the weak interactions of the NSE component (priv. comm.). The timescales for weak interactions are longer than the WD expansion timescale and beta-equilibrium is not reached in the NSE conditions of SNIa explosions (Brachwitz et al. 2000). For this reason, quantifying the impact of modified individual weak reaction rates while matter is in the NSE state requires a re-computation of the NSE composition at each time step, either of the post-processing calculation or of the hydrodynamic calculation itself, as done in this paper. To confirm that this is the main source of the observed differences, I have rerun model C3 confining the modification of individual weak rates to matter colder than 5 × 10⁹ K, to match the NSE criterion applied by Parikh et al. (2013). With this restriction, the most influential rate is the β+-decay of 36Ar, while the impact of the modification of the weak rates on IGN decreases by more than an order of magnitude with respect to the values reported in Table 4.
Within the ten most influencer electron captures, only the rates on 55Mn and 54, 56Fe have been determined with the aid of experimental information on the GT+ strength distribution. The existence of low-lying excited states in some of the influencers contributes to make uncertain their stellar electron capture rates. For instance, the first two excited states of 57Fe lie at 14.4 and 136.5 keV, to be compared to the thermal energy at the typical temperatures of NSE matter in SNIa, kT ∼ 800 keV. Electron capture from these excited states are favoured by the small difference between their angular momentum and that of the ground state of 57Mn, which allows a GT+ transition, as opposed to the ground state of 57Fe. A similar situation occurs for the electron captures on 56Co.
Table 5 gives the species whose yield is most impacted by the modification of a weak rate on any isotope. The most sensitive are 48Ca and 4He, but these two species are of low interest in SNIa from the nucleosynthetic point of view. For instance, in model C3, the ratio of the ejected mass of 48Ca with respect to the main nucleosynthetic product of SNIa, 56Fe, normalized to the solar system ratio is just 2 × 10⁻⁴. Of more interest is 64Ni, which is mainly sensitive to the weak rates on several isotopes of iron and manganese, with Di, j ∼ 0.2. Indeed, if all the weak rates tabulated in MPLD00 minus those involving protons were revised up by a factor 10, 64Ni would be overproduced with respect to 56Fe in all MCh models (see Table 3). The species most overproduced in model C3 (with standard rates) are 50Ti, 54Cr, and 58Fe, partially because of the relatively high initial central density. Their sensitivity to modification of individual weak rates is moderate, Di, j ∼ 0.06 − 0.09.
Sensitive: species most impacted by the modification of individual weak rates.
The pairing of sensitive and influencer species can be understood as a result of the spatial coincidence between the regions of synthesis of the former and the regions of maximum impact of the second on the final value of Ye. Figure 3 shows, for model C3, the final distribution of the most sensitive species within the WD ejecta. 48Ca and 64Ni are synthesized in the innermost few 10−3 M⊙ of the WD, where the contribution of 57Fe and 55Mn to the neutronization is maximal, whereas 50Ti, 54Cr, 58Fe, and 62Ni are made in between mass coordinates 10−3 − 10−2 M⊙, where most of the neutronization is provided by p, 54 − 56Fe, and 54Mn. On the other hand, 58Ni is made in the mass range 0.06 − 1 M⊙, where most electron captures occur on p, 56Ni, and 55Co.
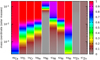 |
Fig. 3. Final distribution of the most sensitive isotopes through the ejecta in model C3. The colour represents the cumulated mass of each isotope, starting from the centre of the star, normalized to the total ejected mass of the same isotope. |
Figure 4 shows the mass coordinates within which the different species contribute most to the neutronization in the MCh models with different initial central density. At all values of ρc, electron captures on protons dominate the neutronization in the central regions of the WD, with decreasing contribution at increasing distance to the centre, and electron captures on 56Ni determine the neutronization at M ≳ 0.1 − 0.2 M⊙. The number of species that contribute significantly to the neutronization increases with ρc, but their distribution is similar for all central densities. Therefore, it is to be expected that the sensitivities explored for a ρc = 3 × 10⁹ g cm−3are representative of models with ρc in the range (2 − 5)×109 g cm−3.
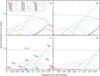 |
Fig. 4. Contribution of individual electron captures to the neutronization close to the centre as a function of the mass coordinate for a Chandrasekhar-mass model with (a) ρc = 2 × 10⁹ g cm−3(model C2), (b) ρc = 3 × 10⁹ g cm−3(model C3), (c) ρc = 4 × 10⁹ g cm−3(model C4), and (d) ρc = 5 × 10⁹ g cm−3(model C5). In panel c, the curves are labelled with the species name. In all panels, the contribution from protons has been scaled down by a factor ten. |
5. Summary
I have assessed the impact of modifications of the weak interaction rates on the nucleosynthesis and other explosion properties of SNIa models. The present work relies on the simulation of one-dimensional models of Chandrasekhar-mass as well as sub-Chandrasekhar mass WD SNIa models through a hydrocode that incorporates a large enough nuclear network that the nucleosynthesis can be obtained directly, and there is no need for nuclear post-processing (Bravo et al. 2019).
Since many of the arguments in favour of the single-degenerate scenario for SNIa progenitors rely on the detection of neutron-rich nuclei and elements in individual SNIa and their remnants (e.g. Höflich et al. 2004; Yamaguchi et al. 2015; Shen et al. 2018), it is of particular interest to test if the explosion of the heaviest sub-Chandrasekhar mass WDs is able to produce the yields required by the observations. And the result is that it is not. The impact of modifying the electron capture rates in the explosion of sub-Chandrasekhar WDs is small, even for progenitors close to the upper mass limit for WDs made of carbon and oxygen. In particular, model S+, whose progenitor mass is MWD = 1.15 M⊙, is unable to produce either the central hole in the distribution of radioactive nickel (Höflich et al. 2004) or the high nickel to iron mass ratio detected in the supernova remnant 3C397 (Yamaguchi et al. 2015).
The impact of the explored changes of electron capture rates on the main properties of Chandrasekhar-mass models, namely the final kinetic energy and the mass of 56Ni synthesized, is also scarce. The yield of 56Ni may vary by as much as ∼0.1 M⊙ only in case of a global revision of the rates upwards by an order of magnitude, while the maximum variation obtained by changing individual rates is limited to ∼0.01 M⊙. In comparison, current observational estimates of the amount of 56Ni needed to power SNIa light curves work with uncertainties of order ∼0.2 M⊙ (Scalzo et al. 2014), although there are prospects to reduce the error budget to ∼0.1 M⊙ (Childress et al. 2015).
I have identified three groups of species relevant for assessing the impact of weak rates on SNIa: the neutronizers, which are those that contribute most to the neutronization of matter; the influencers, which are those whose eventual weak rate change impacts most the abundance of any species with a non-negligible yield; and the sensitive, which are the isotopes whose abundance is most impacted by a change in the weak rates. In the Chandrasekhar-mass models explored in this work, the neutronizers are, besides protons, 54, 55Fe, 55Co, and 56Ni. The influencers do not match the neutronizers point by point; they are mainly 54, 55Mn and 55 − 57Fe. Finally, the sensitive are those neutron-rich nuclei made close to the centre of the WD, which are usually overproduced in Chandrasekhar-mass SNIa models with ρc > 2 × 10⁹ g cm−3; these are 48Ca, 50Ti, 54Cr, and 62, 64Ni, in agreement with Brachwitz et al. (2000) and Parikh et al. (2013).
I do not support the claim by Parikh et al. (2013) that SNIa nucleosynthesis is most sensitive to the modification of individual β+-decay rates of 28Si, 32S, and 36Ar. On the other hand, the present results relative to the sensitivity of the nucleosynthesis of SNIa to simultaneous changes in all the weak rates grossly agree with the findings of Parikh et al. (2013). Another effect I have found of increasing globally the weak rates by an order of magnitude is a reduced floatability of hot bubbles near the centre, which increases the time available for further electron captures and affects the overall dynamics of the explosion. These results underline the importance of knowing the weak rates with accuracy, at least for Chandrasekhar-mass models.
Acknowledgments
I am grateful to Gabriel Martínez-Pinedo for providing stellar weak rates tables on a fine grid. Thanks are due to Robert Fisher, for interesting discussions concerning the floatability of hot bubbles, and to Ivo Seitenzahl and Friedrich Röpke for clarifying the origin of the differences between the present results and those of Parikh et al. The referee, Chris Fryer, has made interesting suggestions to improve the presentation of this paper. This work has been supported by the MINECO-FEDER grant AYA2015-63588-P.
References
- Aufderheide, M. B., Brown, G. E., Kuo, T. T. S., Stout, D. B., & Vogel, P. 1990, ApJ, 362, 241 [NASA ADS] [CrossRef] [Google Scholar]
- Aufderheide, M. B., Fushiki, I., Woosley, S. E., & Hartmann, D. H. 1994, ApJS, 91, 389 [NASA ADS] [CrossRef] [Google Scholar]
- Brachwitz, F., Dean, D. J., Hix, W. R., et al. 2000, ApJ, 536, 934 [NASA ADS] [CrossRef] [Google Scholar]
- Bravo, E., Badenes, C., & Martínez-Rodríguez, H. 2019, MNRAS, 482, 4346 [NASA ADS] [CrossRef] [Google Scholar]
- Byrohl, C., Fisher, R. T., & Townsley, D. M. 2018, ApJ, submitted [arXiv:1810.08203] [Google Scholar]
- Caurier, E., Langanke, K., Martínez-Pinedo, G., & Nowacki, F. 1999, Nucl. Phys. A, 653, 439 [NASA ADS] [CrossRef] [Google Scholar]
- Chamulak, D. A., Brown, E. F., Timmes, F. X., & Dupczak, K. 2008, ApJ, 677, 160 [NASA ADS] [CrossRef] [Google Scholar]
- Childress, M. J., Hillier, D. J., Seitenzahl, I., et al. 2015, MNRAS, 454, 3816 [NASA ADS] [CrossRef] [Google Scholar]
- Chomiuk, L., Soderberg, A. M., Moe, M., et al. 2012, ApJ, 750, 164 [NASA ADS] [CrossRef] [Google Scholar]
- Cole, A. L., Anderson, T. S., Zegers, R. G. T., et al. 2012, Phys. Rev. C, 86, 015809 [NASA ADS] [CrossRef] [Google Scholar]
- Dave, P., Kashyap, R., Fisher, R., et al. 2017, ApJ, 841, 58 [NASA ADS] [CrossRef] [Google Scholar]
- Dean, D. J., Langanke, K., Chatterjee, L., Radha, P. B., & Strayer, M. R. 1998, Phys. Rev. C, 58, 536 [NASA ADS] [CrossRef] [Google Scholar]
- Fantina, A. F., Khan, E., Colò, G., Paar, N., & Vretenar, D. 2012, Phys. Rev. C, 86, 035805 [NASA ADS] [CrossRef] [Google Scholar]
- Fink, M., Röpke, F. K., & Hillebrandt, W. 2010, A&A, 514, A53 [Google Scholar]
- Fisher, R., & Jumper, K. 2015, ApJ, 805, 150 [NASA ADS] [CrossRef] [Google Scholar]
- Fuller, G. M., Fowler, W. A., & Newman, M. J. 1980, ApJS, 42, 447 [NASA ADS] [CrossRef] [Google Scholar]
- Fuller, G. M., Fowler, W. A., & Newman, M. J. 1982a, ApJ, 252, 715 [NASA ADS] [CrossRef] [Google Scholar]
- Fuller, G. M., Fowler, W. A., & Newman, M. J. 1982b, ApJS, 48, 279 [NASA ADS] [CrossRef] [Google Scholar]
- Fuller, G. M., Fowler, W. A., & Newman, M. J. 1985, ApJ, 293, 1 [NASA ADS] [CrossRef] [PubMed] [Google Scholar]
- García-Senz, D., & Bravo, E. 2005, A&A, 430, 585 [NASA ADS] [CrossRef] [EDP Sciences] [Google Scholar]
- Gil-Pons, P., Doherty, C. L., Gutiérrez, J. L., et al. 2018, PASA, 35 [Google Scholar]
- Höflich, P., Gerardy, C. L., Nomoto, K., et al. 2004, ApJ, 617, 1258 [NASA ADS] [CrossRef] [Google Scholar]
- Jacobson-Galán, W. V., Dimitriadis, G., Foley, R. J., & Kilpatrick, C. D. 2018, ApJ, 857, 88 [NASA ADS] [CrossRef] [Google Scholar]
- Kilpatrick, C. D., Coulter, D. A., Dimitriadis, G., et al. 2018, MNRAS, 481, 4123 [NASA ADS] [CrossRef] [Google Scholar]
- Langanke, K., & Martínez-Pinedo, G. 2000, Nucl. Phys. A, 673, 481 [NASA ADS] [CrossRef] [Google Scholar]
- Langanke, K., & Martínez-Pinedo, G. 2001, At. Data Nucl. Data Tables, 79, 1 [NASA ADS] [CrossRef] [Google Scholar]
- Langanke, K., Martínez-Pinedo, G., Petermann, I., & Thielemann, F. K. 2011, Progr. Part. Nucl. Phys., 66, 319 [NASA ADS] [CrossRef] [Google Scholar]
- Liu, D., Wang, B., & Han, Z. 2018, MNRAS, 473, 5352 [NASA ADS] [CrossRef] [Google Scholar]
- Lodders, K. 2003, ApJ, 591, 1220 [NASA ADS] [CrossRef] [Google Scholar]
- Martínez-Pinedo, G., Langanke, K., & Dean, D. J. 2000, ApJS, 126, 493 [NASA ADS] [CrossRef] [Google Scholar]
- Martínez-Rodríguez, H., Piro, A. L., Schwab, J., & Badenes, C. 2016, ApJ, 825, 57 [NASA ADS] [CrossRef] [Google Scholar]
- Misch, G. W., Fuller, G. M., & Brown, B. A. 2014, Phys. Rev. C, 90, 065808 [NASA ADS] [CrossRef] [Google Scholar]
- Miyaji, S., Nomoto, K., Yokoi, K., & Sugimoto, D. 1980, PASJ, 32, 303 [Google Scholar]
- Mori, K., Famiano, M. A., Kajino, T., et al. 2016, ApJ, 833, 179 [NASA ADS] [CrossRef] [Google Scholar]
- Oda, T., Hino, M., Muto, K., Takahara, M., & Sato, K. 1994, At. Data Nucl. Data Tables, 56, 231 [NASA ADS] [CrossRef] [Google Scholar]
- Parikh, A., José, J., Seitenzahl, I. R., & Röpke, F. K. 2013, A&A, 557, A3 [NASA ADS] [CrossRef] [EDP Sciences] [Google Scholar]
- Piersanti, L., Bravo, E., Cristallo, S., et al. 2017, ApJ, 836, L9 [NASA ADS] [CrossRef] [Google Scholar]
- Pruet, J., & Fuller, G. M. 2003, ApJS, 149, 189 [NASA ADS] [CrossRef] [Google Scholar]
- Rebassa-Mansergas, A., Toonen, S., Korol, V., & Torres, S. 2019, MNRAS, 482, 3656 [NASA ADS] [CrossRef] [Google Scholar]
- Sarriguren, P. 2013, Phys. Rev. C, 87, 045801 [NASA ADS] [CrossRef] [Google Scholar]
- Sarriguren, P. 2016, Phys. Rev. C, 93, 054309 [NASA ADS] [CrossRef] [Google Scholar]
- Sasdelli, M., Hillebrandt, W., Kromer, M., et al. 2017, MNRAS, 466, 3784 [NASA ADS] [CrossRef] [Google Scholar]
- Scalzo, R., Aldering, G., Antilogus, P., et al. 2014, MNRAS, 440, 1498 [NASA ADS] [CrossRef] [Google Scholar]
- Shen, K. J., Kasen, D., Miles, B. J., & Townsley, D. M. 2018, ApJ, 854, 52 [NASA ADS] [CrossRef] [Google Scholar]
- Thielemann, F.-K., Nomoto, K., & Yokoi, K. 1986, A&A, 158, 17 [NASA ADS] [Google Scholar]
- Wiescher, M., Käppeler, F., & Langanke, K. 2012, ARA&A, 50, 165 [NASA ADS] [CrossRef] [Google Scholar]
- Woosley, S. E., & Weaver, T. A. 1994, ApJ, 423, 371 [NASA ADS] [CrossRef] [Google Scholar]
- Yamaguchi, H., Badenes, C., Foster, A. R., et al. 2015, ApJ, 801, L31 [NASA ADS] [CrossRef] [Google Scholar]
- Yokoi, K., Neo, S., & Nomoto, K. 1979, A&A, 77, 210 [NASA ADS] [Google Scholar]
All Tables
Influencers: species whose weak rates modification has a large impact on the yield of any other species.
All Figures
|
Fig. 1. Sources of tabulated weak interaction rates. Colours identify the source of weak rates on a species: FFN82 is indicated in cyan, Oda94 in blue, MPLD00 in red, and PF03 in green. The weak rates on protons, not shown in the graph, are taken from MPLD00. The species with the most influencial individual weak rates (Sect. 4.2) are highlighted with an open black square. All of these belong to the MPLD00 tabulation. |
| In the text | |
|
Fig. 2. Time evolution of the radial coordinate, r, of an incinerated bubble for a central density of the WD of ρc = 3 × 10⁹ g cm−3. The radial coordinate of the bubble is plotted normalized to its initial position, r0, for two cases: standard electron capture rates (green curve) and weak rates scaled up by a factor ten (red curve). |
| In the text | |
|
Fig. 3. Final distribution of the most sensitive isotopes through the ejecta in model C3. The colour represents the cumulated mass of each isotope, starting from the centre of the star, normalized to the total ejected mass of the same isotope. |
| In the text | |
|
Fig. 4. Contribution of individual electron captures to the neutronization close to the centre as a function of the mass coordinate for a Chandrasekhar-mass model with (a) ρc = 2 × 10⁹ g cm−3(model C2), (b) ρc = 3 × 10⁹ g cm−3(model C3), (c) ρc = 4 × 10⁹ g cm−3(model C4), and (d) ρc = 5 × 10⁹ g cm−3(model C5). In panel c, the curves are labelled with the species name. In all panels, the contribution from protons has been scaled down by a factor ten. |
| In the text | |
Current usage metrics show cumulative count of Article Views (full-text article views including HTML views, PDF and ePub downloads, according to the available data) and Abstracts Views on Vision4Press platform.
Data correspond to usage on the plateform after 2015. The current usage metrics is available 48-96 hours after online publication and is updated daily on week days.
Initial download of the metrics may take a while.