Fig. 1.
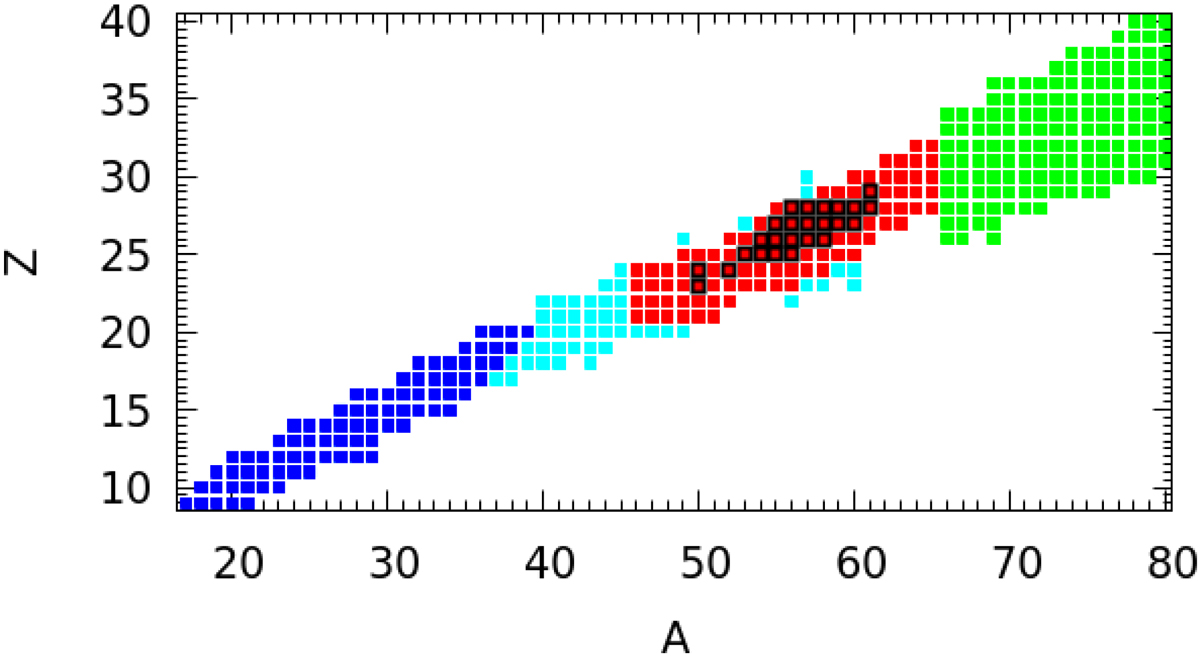
Sources of tabulated weak interaction rates. Colours identify the source of weak rates on a species: FFN82 is indicated in cyan, Oda94 in blue, MPLD00 in red, and PF03 in green. The weak rates on protons, not shown in the graph, are taken from MPLD00. The species with the most influencial individual weak rates (Sect. 4.2) are highlighted with an open black square. All of these belong to the MPLD00 tabulation.
Current usage metrics show cumulative count of Article Views (full-text article views including HTML views, PDF and ePub downloads, according to the available data) and Abstracts Views on Vision4Press platform.
Data correspond to usage on the plateform after 2015. The current usage metrics is available 48-96 hours after online publication and is updated daily on week days.
Initial download of the metrics may take a while.