Free Access
Fig. 3.
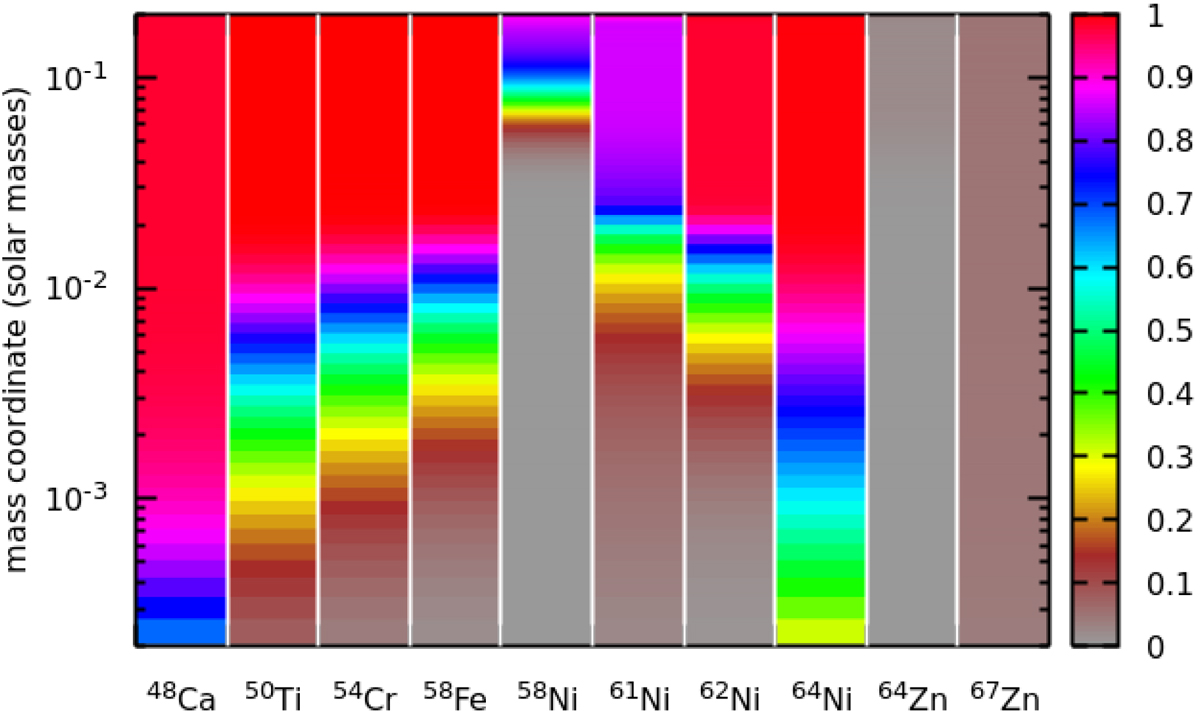
Final distribution of the most sensitive isotopes through the ejecta in model C3. The colour represents the cumulated mass of each isotope, starting from the centre of the star, normalized to the total ejected mass of the same isotope.
Current usage metrics show cumulative count of Article Views (full-text article views including HTML views, PDF and ePub downloads, according to the available data) and Abstracts Views on Vision4Press platform.
Data correspond to usage on the plateform after 2015. The current usage metrics is available 48-96 hours after online publication and is updated daily on week days.
Initial download of the metrics may take a while.