Fig. 2.
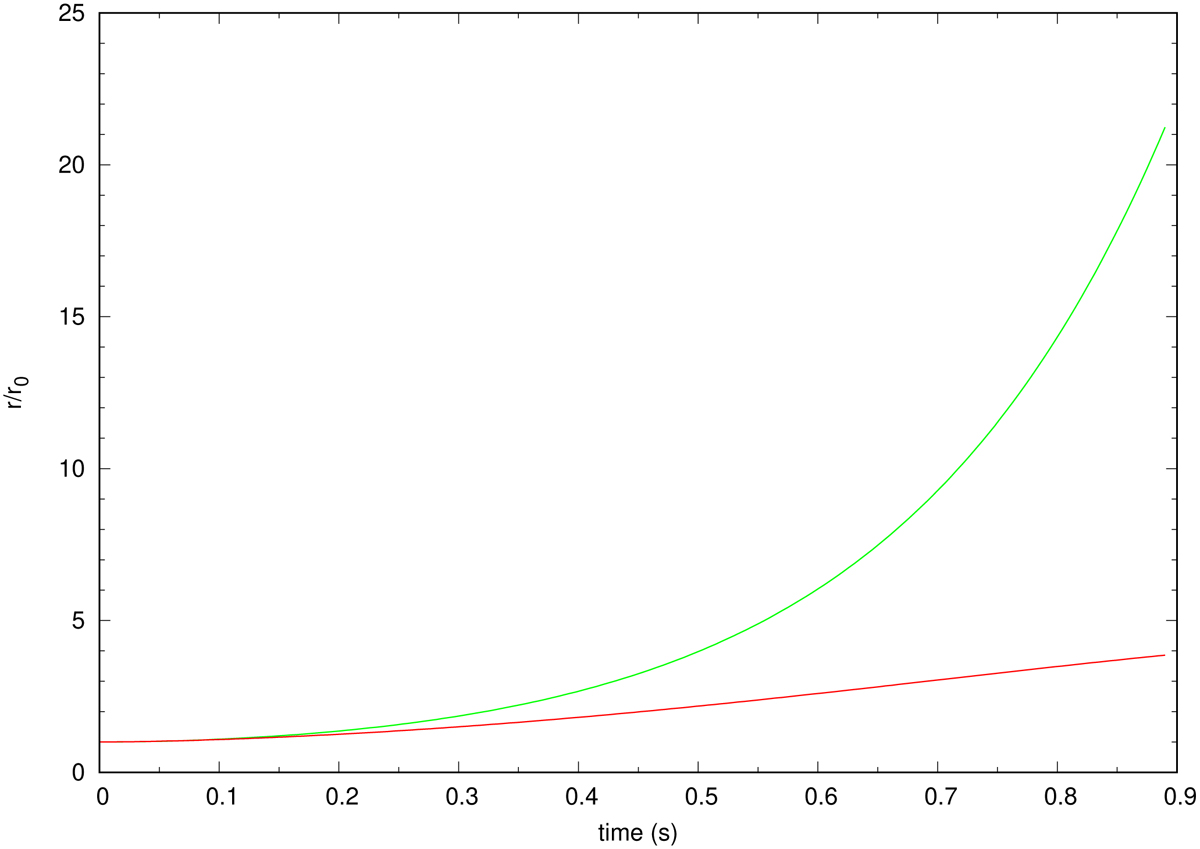
Time evolution of the radial coordinate, r, of an incinerated bubble for a central density of the WD of ρc = 3 × 10⁹ g cm−3. The radial coordinate of the bubble is plotted normalized to its initial position, r0, for two cases: standard electron capture rates (green curve) and weak rates scaled up by a factor ten (red curve).
Current usage metrics show cumulative count of Article Views (full-text article views including HTML views, PDF and ePub downloads, according to the available data) and Abstracts Views on Vision4Press platform.
Data correspond to usage on the plateform after 2015. The current usage metrics is available 48-96 hours after online publication and is updated daily on week days.
Initial download of the metrics may take a while.