| Issue |
A&A
Volume 624, April 2019
|
|
|---|---|---|
| Article Number | A81 | |
| Number of page(s) | 20 | |
| Section | Extragalactic astronomy | |
| DOI | https://doi.org/10.1051/0004-6361/201834542 | |
| Published online | 15 April 2019 | |
Quenching by gas compression and consumption
A case study of a massive radio galaxy at z = 2.57
1
European Southern Observatory, Karl-Schwarzschild-Str. 2, Garching bei München 85748, Germany
2
Dunlap Institute for Astronomy & Astrophysics, 50 St. George Street, Toronto, ON M5S 3H4, Canada
e-mail: This email address is being protected from spambots. You need JavaScript enabled to view it.
, This email address is being protected from spambots. You need JavaScript enabled to view it.
3
Sorbonne Université, CNRS UMR 7095, Institut d’Astrophysique de Paris, 98 bis bd Arago, 75014 Paris, France
Received:
30
October
2018
Accepted:
22
February
2019
Abstract
The objective of this work is to study how active galactic nuclei (AGN) influence star formation in host galaxies. We present a detailed investigation of the star-formation history and conditions of a z = 2.57 massive radio galaxy based on VLT/X-shooter and ALMA observations. The deep rest-frame ultraviolet spectrum contains photospheric absorption lines and wind features indicating the presence of OB-type stars. The most significantly detected photospheric features are used to characterize the recent star formation: neither instantaneous nor continuous star-formation history is consistent with the relative strength of the Si IIλ1485 and S Vλ1502 absorption. Rather, at least two bursts of star formation took place in the recent past, at 6+1-2 Myr and ≳20 Myr ago, respectively. We deduce a molecular H2 gas mass of (3.9 ± 1.0) × 1010 M⊙ based on ALMA observations of the [C I] 3P2−3P1 emission. The molecular gas mass is only 13% of its stellar mass. Combined with its high star-formation rate of (1020-170+190 M⊙ yr-1, this implies a high star-formation efficiency of (26 ± 8) Gyr−1 and a short depletion time of (38 ± 12) Myr. We attribute the efficient star formation to compressive gas motions in order to explain the modest velocity dispersions (⩽55 km s−1) of the photospheric lines and of the star-forming gas traced by [C I]. Because of the likely very young age of the radio source, our findings suggest that vigorous star formation consumes much of the gas and works in concert with the AGN to remove any residual molecular gas, and eventually quenching star formation in massive galaxies.
Key words: galaxies: evolution / galaxies: high-redshift / galaxies: jets / galaxies: starburst / galaxies: star clusters: general / ultraviolet: stars
© ESO 2019
1. Introduction
Over the past 10 Gyrs, galaxies with stellar masses greater than 1011 M⊙ are observed to be predominantly quiescent (e.g., Davidzon et al. 2017). This implies that the red sequence of the Hubble tuning fork diagram has been in place since early epochs. The processes underlying their rapid assembly and the eventual cessation of their star formation are not clearly established. To reproduce the observed number densities of massive quiescent galaxies and match the stellar mass function, cosmological simulations routinely include the impact of the mechanical and radiative output of active galactic nuclei (AGN) to halt their episodes of wide spread star formation (Di Matteo et al. 2005; Springel et al. 2005; Dubois et al. 2012; Sijacki et al. 2015; Croton et al. 2016; Bower et al. 2017). Given that the most massive supermassive blackholes reside in the most massive galaxies, and that their accretion is amongst the most energetic events in the Universe, AGN certainly have sufficient energy to significantly alter the interstellar medium (ISM) of their host galaxies. This “AGN feedback” can occur either through pressure from the intense radiation fields generated by AGN, winds generated in the accretion disk surrounding the supermassive blackhole, or by direct mechanical interaction of powerful radio jets with the surrounding gas. In the case of AGN feedback regulating star formation, one would expect the star-formation rates (SFR) of galaxies to be inversely correlated to their AGN luminosities. This is however not apparent in observational studies (e.g., Rosario et al. 2013; Stanley et al. 2015). Bursts of star formation can also create high-speed winds of outflowing gas (e.g., Heckman et al. 1995; Lehnert & Heckman 1996; Lehnert et al. 1999; Zirm et al. 2005) further complicating a direct understanding of how AGN may regulate star formation.
Despite the potentially important role that AGN feedback plays in galaxy evolution, how such feedback works in detail is not well-understood or well-constrained observationally. Understanding the physics of feedback requires knowledge of the characteristics of the AGN such as luminosity and variability timescale, as well as the density and temperature distributions of the ISM of the host galaxy (e.g., Wagner et al. 2012; Zubovas et al. 2013a). These detailed properties of AGN and ISM have only been determined for a handful of nearby galaxies with deep, resolved multi-wavelength observations. While negative feedback may be expected to be prevalent over long timescales, AGN feedback can instead be positive – enhancing the star-formation rate or efficiency – over shorter timescales (Silk 2005, 2013). Molecular gas could be entrained by expanding radio bubbles or condensed in-situ from the wake of the buoyant plasma via thermal instabilities, and blast waves could compress gas leading to enhanced star formation (Fragile et al. 2004, 2017; Gaibler et al. 2012; Ishibashi & Fabian 2012; Dugan et al. 2014). Star formation can also be induced by the jet interacting with pre-existing extra-nuclear gas. This positive form of AGN feedback is supported by resolved observations which find young stars and gas to be aligned with the radio jets, such as the nearby Centaurus A, 3C 285, Minkowski’s Object near NGC 541, central cluster galaxies, as well as 4C 41.47 at z = 3.7 (van Breugel et al. 1985; Dey et al. 1997; Rejkuba et al. 2002; Croft et al. 2006; Salomé et al. 2015; Russell et al. 2017a,b).
Several inherent challenges impede a direct inference of causality between the AGN activity and the star formation of host galaxies (Volonteri et al. 2015a,b; Harrison 2017). Emission of stellar populations dominated by O- and B-stars can appear similar to the direct or scattered light of the AGN. The difficulty of isolating star formation from other sources of emission is innate to most SFR indicators including the UV continuum emission, recombination lines as well as the reprocessed dust emission in the far-infrared. Uncertainties in measurements of the extinction further complicates the SFR estimate. Moreover, blackhole accretion rates fluctuate on timescales of <1 Myr, whereas star formation is essentially obscured during the first few Myr as newly formed stars are still deeply embedded in their natal molecular clouds. Typical SFR tracers are sensitive to stellar population ages of a few to 200 Myr (Kennicutt & Evans 2012). It is therefore difficult to establish, through observed correlations, how exactly the AGN influence the SFR of host galaxies.
Fortunately, many of these challenges can be mitigated by deep UV spectroscopy. Photospheric absorption lines in the UV are unambiguous signatures of the hot stellar atmospheres of young stars. When observed in galaxies, they provide constraints on the recent star-formation history (de Mello et al. 2000). Deep UV spectroscopy has been used to study nearby starburst galaxies using, for example, the Goddard High Resolution Spectrograph on board the Hubble Space Telescope (Conti et al. 1996; Leitherer et al. 1996; Heckman & Leitherer 1997). Although in principle rest-frame UV spectra are more readily accessible for high redshift objects as they shift to observed optical wavelengths, UV photospheric lines have only been detected in a handful of distant galaxies to date, as hours of integration time are required to reach the necessary sensitivity even with 8 m class telescopes. Common techniques to improve the signal-to-noise of photospheric lines in distant galaxies are gravitational lensing or stacking (Cabanac et al. 2008; Quider et al. 2009, 2010; Dessauges-Zavadsky et al. 2010; Bayliss et al. 2014; Steidel et al. 2016; Rigby et al. 2018).
The physics of AGN feedback can be better understood by studying the UV absorption line spectra of AGN host galaxies. High-redshift radio galaxies (HzRGs) are ideal for this purpose, as they are among the most massive and luminous objects at each redshift (Miley & De Breuck 2008). Moreover, unlike in quasars (type 1 AGN), their AGN emission does not completely outshine the host galaxy because the obscuring torus conveniently acts as a natural coronagraph. A remarkable example is 4C 41.17, a radio galaxy at z = 3.8, whose UV continuum is dominated by starlight rather than AGN light. Its UV spectrum contains at least one photospheric feature, namely the S Vλ1502 absorption line (Dey et al. 1997), originating from O stars and early B stars (Walborn et al. 1995a). The detection of the S V photospheric feature, together with the alignment of the star-forming regions along the radio jet axis (Steinbring 2014), makes 4C 41.17 a convincing example of AGN-triggered star formation. Despite the potential of using UV spectroscopy to study feedback physics, deep spectroscopy of other distant radio galaxies thus far have only resulted in tentative or no detection of photospheric features (Cimatti et al. 1998; Smith et al. 2010).
Here we present the most significant detection of multiple rest-frame UV photospheric absorption lines in PKS 0529-549, a radio galaxy at z = 2.57. PKS 0529-549 is a massive galaxy with a stellar mass M⋆ = (3 ± 2) × 1011 M⊙, (De Breuck et al. 2010) and a star-formation rate of  (Falkendal et al. 2019). Its Lyα emission extent (∼40 kpc; Roettgering et al. 1997) is well beyond its asymmetric double knot radio structure (two knots separated by ∼10 kpc; Broderick et al. 2007). The radio lobes are embedded within and aligned with the more extended warm emission line gas traced by [O III] and Hα, as expected for a bi-conical ionized gas outflow (Nesvadba et al. 2017; Lelli et al. 2018).
In addition to using the recent star-formation history to understand AGN feedback, it is equally important to investigate the cold molecular gas that fuels the on-going star formation. By comparing the molecular gas properties of PKS 0529-549 with those of other distant massive galaxies, we can infer how it evolves as massive galaxies quench their star formation. Moreover, the star-formation efficiency is the ratio of the cold gas mass and the SFR. Its inverse, the gas depletion time, is an important quantity as it provides a measure of its relative importance to other on-going processes such as AGN outflows. Here, we probe the cold gas in PKS 0529-549 by observing the atomic carbon [C I] 3P2−3P1 emission line, which is a tracer of relatively diffuse low-density H2, using the Atacama Large Millimeter/submillimeter Array (ALMA).
In this paper we present a detailed analysis of the star formation properties of PKS 0529-549. Section 2 provides an overview of the spectroscopic observations and the data reduction. Section 3 describes the analysis of the X-shooter spectrum, including the systemic redshift measurement, line identifications, and the characterization of the recent star formation. Section 4 presents the derivation of the molecular gas mass and star-formation efficiency based on the ALMA [C I] spectrum. In Sect. 5 we discuss PKS 0529-549 in context of the entire massive galaxy population, addressing outstanding questions like: How do galaxies form stars and eventually quench? What role do AGN play in this process? Our findings are summarized in Sect. 6.
Throughout this paper, we assume a Kroupa (2001) initial mass function (IMF)1. A cosmology of H0 = 70 km s−1 Mpc−1, ΩM = 0.3 and ΩΛ = 0.7 is adopted. We adopt the optical velocity definition.
2. Observations and reduction
2.1. VLT/X-shooter observations
Observations were obtained using the X-shooter echelle spectrograph (Vernet et al. 2011) mounted on UT 3 of the ESO Very Large Telescope through programme 092.B-0772 (PI: M. Lehnert). They were conducted in service mode over five separate nights between 2013 October 30 and 2014 January 29. The seeing full-width half-maximum (FWHM) was reported to range from  , on average
  . The science observations were taken in airmass range of 1.16–1.41, with median (mean) airmass of 1.21 (1.23). The atmospheric dispersion corrector (ADC) was dysfunctional and therefore disabled during this period. The X-shooter slit centroid, quoted as the median position of all exposures, is provided in Table 1. The slit was oriented at a position angle of −115° from N to E as shown in Fig. 1, near the parallatic angle to minimize slit losses. Each arm, UVB, VIS, and NIR, had different slit widths,
  ,
,  , and
, and  , corresponding to moderate spectral resolutions of λ/Δλ ∼ 3200, 5000, and 4300, which were sampled at 8.9, 10.3, and 22.6 pixels per FWHM, respectively. The slit was broad enough to cover both the host galaxy and the radio lobe of PKS 0529-549 (corresponding to the W and E components as presented in Broderick et al. 2007; Falkendal et al. 2019). The integration times per exposure in the UVB, VIS, and NIR arms were 1800, 900, 600 s, respectively. The dithering strategy was mostly done in NODDING mode, with a few exposures done in STARE mode. The total on-source exposure time was 8.5 h.
Properties of PKS 0549-529.
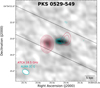 |
Fig. 1. The X-shooter slit shown as black lines superposed on the greyscale rendition of the ALMA Band 6 continuum image. The displayed image is |

2.2. X-shooter reduction
We used the EsoRex pipeline version 2.8.19 (Modigliani et al. 2010) through the Reflex interface (Freudling et al. 2013) to reduce the spectroscopic data. For optimal sky subtraction, the UVB and VIS arm exposures were reduced as STARE mode, while the NIR arm exposures were reduced in NOD mode. Default pipeline parameters were used, with the following modifications: (1) Median sky subtraction; (2) Rows of sky pixels were manually defined for each exposure; and (3) a constant sky background on the raw frames was assumed and fit with a line down each column.
The uncertainty in the wavelength calibration is dominated by the systematic uncertainties of 0.3, 0.2, and 0.04 Å in the UVB, VIS, and NIR arms, respectively, corresponding to 20 km s−1 at observed 450 nm and 0.6 km s−1 at 2 μm. The UVB arm native pixel scale 0.1 Å, which samples the resolution at our selected slit width over 8.9 pixels, corresponds to FWHM of 0.89 Å in the observed frame. This implies a velocity resolution of σinstr = 0.1 Å or 20 km s−1 at a rest-frame wavelength of 1500 Å for the redshift of PKS 0529-549, z = 2.57. The reduced X-shooter data are in topocentric velocity reference frame. Correction to barycentric velocity frame ranges from −5.6 to 3.4 km s−1 with a standard deviation of 2.5 km s−1 across exposures. This level of correction is below the spectral resolution. Correction to barycentric velocity frame was therefore not applied to avoid introducing errors by resampling the spectrum.
To spatially align the exposures across different dither positions, we used the brightest emission lines in each arm to determine their centroids. For the three arms, we used the blue peak of the Lyα emission at ∼4336.3 Å, C III] emission at ∼6815.2 Å, [O III] λ5008 emission at ∼1.7889 μm for the UVB, VIS, and NIR arms respectively. In each exposure, we determine the shift along the spatial direction by searching for the brightest row summed over 10 spectral pixels. The combined 2D spectrum is assembled using the median pixel value of different exposures, after applying the spatial shift. The orders were merged manually as the pipeline merged spectra had dips in the fluxes where orders overlap.
To extract the one-dimensional (1D) spectrum, we summed the flux densities contained in the central nine rows to optimize the signal-to-noise ratio (S/N) of the absorption line features. To correct for Galactic reddening, we use the Galactic extinction map2 of Schlafly & Finkbeiner (2011) to determine a value of E(B − V) = 0.0550 at the source position. We correct the spectrum with a reddening curve of AV = 0.1706 and the extinction curve of Cardelli et al. (1989), assuming AV/E(B − V) = 3.1.
2.3. ALMA Band 6 observations and reduction
PKS 0529-549 was observed with ALMA through the Cycle 2 programme 2013.1.00521.S (PI: C. De Breuck). The Band 6 observations were conducted on 2014 September 2 with 34 antennas, with a total on-source integration time of 5 min. We used four 1.875 GHz spectral windows, one of which was tuned to observe the [C I] 3P2−3P1 (hereafter [C I]) line in PKS 0529-549. The data were calibrated in the Common Astronomy Software Application (CASA; McMullin et al. 2007) with the supplied calibration script. To maximize S/N we used natural weighting and a coarse channel width of 50 km s−1 in the barycentric velocity frame. The root-mean-square (rms) noise was 48 μJy in the continuum image, and 0.5 mJy at channel width of 50 km s−1 around the region of the [C I] emission line. The restoring beam used was  at position angle of 65°. Full details about the calibration of the ALMA observations are provided in Falkendal et al. (2019) and Lelli et al. (2018).
3. Results I: Bursty recent star-formation history
3.1. Systemic redshift
We measured redshifts by fitting Gaussian profiles to the detected emission lines masking regions that are strongly influenced by sky line emission. In case of doublets, such as C IV, C III], and [O II], we fit each component of multiplets independently (Table A.1). The rest-frame wavelengths were taken from the atomic line list v 2.04 maintained by Peter van Hoof3 whenever available, and the rest were drawn from literature (de Mello et al. 2000; Pettini et al. 2000; Leitherer et al. 2011; Steidel et al. 2016). Reassuringly, the redshifts of most emission lines are consistent within their measurement uncertainties, with the exception of the resonant wind lines (i.e., N V, Si IV, and C IV; Fig. A.1). We therefore define the systemic redshift with the broad He II line emission (zsys = 2.5725 ± 0.0003), and therewith infer the velocity offsets. The high S/N and spectral resolution of the X-shooter spectrum, as well as its broad wavelength coverage, provides a wide range of lines for us to explore the reasons as to why some lines show velocities that are highly discrepant. Here, we simply note the lines with anomalous profiles and/or velocities to inform the discussion later in this paper.
-
The He II profile is asymmetric and appears to be multiply peaked (Fig. 5). While we expect the AGN scattered broad-line emission to dominate the He II profile, which justifies its use to define the systemic velocity, in Sects. 3.2 and 3.5.3 we discuss evidence that the intense star formation in PKS 0529-549 might contribute to the complexity of He II profile.
-
The spatially extended broad Lyα emission component has (surprisingly) consistent velocity with zsys. An additional narrower Lyα absorber is redshifted by 101 km s−1, having line widths which vary across the slit. This results in an asymmetric double-peaked profile.
-
The resonant doublets N V, Si IV, and C IV are redshifted with respect to zsys. This is due to the emission peaks being affected by blueshifted absorption, as these lines appear to have P-Cygni profiles. In Sect. 3.4, we discuss the nature of these resonant lines in more detail.
3.2. Strong stellar photospheric lines
Photospheric absorption lines are often used to characterize the photospheres of the stars that dominate the continuum emission. When observed in galaxies, they provide constraints on the star-formation history and metallicity of stellar populations. They arise from excited, mostly non-resonant, energy levels and therefore are generally not associated with interstellar gas. Rest-frame UV continuum emission is typically dominated by hot, massive stars in young populations (≲100 Myrs). In fact, only stars more massive than 5 M⊙ (corresponding to spectral type B5V) contribute significantly to the UV spectrum blue-ward of 2200 Å (Heckman & Leitherer 1997).
Photospheric features detected in PKS 0529-549 are listed in Table 2. As apparent in Fig. 2, the most prominent photospheric absorption lines detected are Si IIλ1485 and S Vλ1502 (excitation potentials of 6.83 and 15.76 eV, respectively). S Vλ1502 is observed in most types of O-stars of luminosity classes I–V, as well as early B-type stars (B0–B1). Si IIλ1485, unlike the other ground-state, interstellar Si absorption lines commonly seen in high-redshift galaxies (e.g., Si IIλλλλ1206, 1260, 1304, 1526; Steidel et al. 2016, and references therein), arise from an excited level in their ions. Therefore, these lines originates in the photospheres of hot stars – observed in mid- to late-B stars (B3–B8 and weaker in B-supergiants; Rountree & Sonneborn 1993; de Mello et al. 2000) – only appearing 20 Myr after a burst of star formation. The simultaneous appearance of these photospheric absorption lines is key to constrain the recent star-formation history of PKS 0529-549 in Sect. 3.5.1.
Properties of absorption features with stellar photospheric origins.
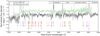 |
Fig. 2. Rest-frame continuum-normalized UV spectra of PKS 0529-549 (black; this work) and 4C 41.17 (green; Dey et al. 1997). We indicate the wavelengths of the most prominent lines in the spectra annotated with the ion responsible. The colours represent the likely dominant origin of the lines: red for stellar photospheric, blue for resonant doublets from stellar winds and AGN, green for low-ionization lines in the interstellar medium, olive for their associated excited fine-structure emission, and purple for bright emission lines. The blue shades show the absorption wings of the resonant lines originating from stellar winds. The dotted lines indicate possible ISM absorption of Fe IIλλ2587,2600 and Mg IIλλ2796,2804 at z = 0.64 (grey), z = 0.94 (brown), and z = 1.28 (olive). For easier visualization, the spectrum of PKS 0529-549 has been binned by twice the FWHM (i.e., variance-weighted mean for every 18/21 pixels for the UVB/VIS arms, respectively). The spectrum of 4C 41.17 has been smoothed by a Gaussian kernel, and shifted upwards by 0.5. The grey shade shows the noise as propagated from the X-shooter pipeline without accounting for correlated noise. The spectrum of PKS 0529-549 has been shifted to vacuum wavelengths. The gap at ∼1550 − 1570 Å is the noisy region between the UVB and VIS arms of X-shooter. |
While in principle the photospheric features could provide the best definition of zsys, it is not straightforward to accurately determine their redshifts for the following reason. Because X-shooter has a moderately high spectral resolution, both Si IIλ1485 and S Vλ1502 are resolved into multiplets (Table 2, Fig. 5). None of the observed spectra of nearby starburst galaxies and individual stars of which we are aware have sufficient spectral resolution to resolve these multiplets for accurate profile fitting. Knowledge of the surface gravity (log g) and temperature of the stars they arise in are necessary to determine the relative absorption line strengths of these multiplets. We note that assuming the zsys as determined from the broad He II emission line provides a satisfactory match between the stellar features we have observed and the model stellar spectra (Sect. 3.5, Fig. 3).
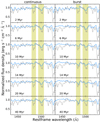 |
Fig. 3. Comparison of Starburst99 model spectra (in blue; Leitherer et al. 1999) to the observed spectrum of PKS 0529-549 (in grey) over the spectral region, 1435–1540 Å. Model spectra of continuous star formation are compared with the spectrum of PKS 0529-549 on the left and models with a single burst of star formation are compared on the right. We highlight in yellow the spectral regions containing the two most significantly detected photospheric lines, Si IIλ1485 and S Vλ1502. The ages of individual spectral models are indicated in the lower left of each panel. The spectra have been normalized to the continuum. For visualization both the model and observed spectra have been smoothed to matching resolution. |
The complex He IIλ1640 profile in the spectrum of PKS 0529-549 appears as if it could have redshifted absorption components (Fig. 5; Table 2). Although the broad He IIλ1640 emission is expected to be dominated by the scattered emission from the AGN, it is an absorption feature in O- and early B-type stars, and can be observed in emission and/or absorption (P-Cygni profile) in Wolf–Rayet stars and O-type supergiants (Fig. A.2; Willis 1982; Kinney et al. 1993; de Mello et al. 2000). We will further discuss the nature of the complex He II profile in Sect. 3.5.3.
At any rate, we conclude that we have accurately identified stellar photospheric lines as these absorption features have observed wavelengths consistent with the zsys of PKS 0529-549.
3.3. Identifying weaker photospheric absorption lines
There are other lines in the spectrum that could originate from stellar photospheres, but are blended with nearby features or could have non-stellar origins. They are listed as follows:
-
C IIIλ1247 is observed in stars of spectral types O3–O9 and B0–B9, and lies close to the N Vλλ1239, 1243 resonant doublet. It has a P-Cygni profile which is only seen in hyper-giant stars of types O9.5 Ia and B0 Ia (Fig. A.2).
-
Si IIλλλ1260, 1304, 1526 absorption are detected. They are strong features in B-type stars and their presence are expected given the significant detection of Si IIλ1485 (Sect. 3.2). However, these Si II lines are not particularly constraining as they are ground-state transitions that can also arise from the interstellar medium. Significant interstellar medium absorption is suggested by the depth of these absorption lines and their blueshifted absorption wings, when comparing the observed spectrum to model spectra of stellar populations (Fig. A.4).
-
A blend of photospheric lines at 1294–1299 Å (Si IIIλλλ1294, 1296, 1298, C IIIλ1296) originating from B-type stars are detected. They are however affected by the broad ISM O I and Si II absorption line blend at ∼1300 Å.
-
A blend of C IIλ1323 and N IIIλ1324 are detected as well. These features are strongest in late B-type stars (see Fig. 8 of de Mello et al. 2000).
-
Two line indices 1370 (covering 1360–1380 Å) and 1425 (covering 1415–1435 Å) have been calibrated as metallicity indicators, as they are not dependent on the age of the young stellar population (Leitherer et al. 2001; Rix et al. 2004; Maraston et al. 2009). The features O IVλ1342, O Vλ1371 and the nearby four Fe Vλλλλ1345, 1362, 1363 and 1364 lines fall into the 1370 index. The features Si IIIλ1417, C IIIλλ1426, 1427 and Fe Vλλ1427, 1430 fall into the 1425 index. These photospheric lines are typical of O and early B stars (Leitherer et al. 2001). The Fe V absorption features are strong, indicating substantial metallicity.
Interestingly, a number of fine-structure excited transitions features are in emission. They include the C IIIλλ1426, 1428 doublet, C IIIλ1620, and Si IIλλλ1265, 1309, 1533. The C III lines are expected to be in absorption if they originate from the photospheres of O-stars, and in emission in WN and WC stars (Kinney et al. 1993). The Si II lines are expected to be in absorption in B-stars (Sect. 3.5.1), and Si IIλ1533 can be seen in P-Cygni in some Wolf–Rayet stars (Willis 1982). The comparison with stars of various spectral types is shown in Fig. A.2. We will discuss their nature further in Sect. 3.5.1.
3.4. Stellar wind features
We detect the resonant doublets N Vλ1240, Si IVλ1400, and C IVλ1550, which appear to have P-Cygni profiles. These high-ionization lines are observed in stellar winds of O- and B-type stars (Fig. A.2; de Mello et al. 2000; Robert et al. 2003). In hot stars, these lines are observed to have broad absorption line components with a range of terminal velocities, of hundreds to thousands of km s−1, varying with spectral type. C IV is the strongest rest-frame UV stellar feature in O-type stars. Both C IV and Si IV are absent in stars later than B5 (de Mello et al. 2000). Si IV is typically weaker than the two other resonant stellar wind lines (Leitherer et al. 2011). These stellar wind features are expected given that OB-stars dominate the UV continuum emission, as suggested by the observed photospheric features discussed in Sects. 3.2 and 3.3.
The velocity profiles of N V, Si IV, and C IV are in accord with being winds. While the line emission is expected to originate from the broad line region of the AGN (Vernet et al. 2001), the observed blueshifted absorption profiles are indicative of a stellar origin rather than the interstellar medium for several reasons. First, their ionization energy is high: Ionization potentials of 33.5 and 77.5 eV are required to create Si+3 and N+4 ions, corresponding to the Si IV and N V absorption lines, respectively (Morton 2003). An interstellar origin is ruled out, as it is unlikely to have such hard photons and/or densities for collisional excitation. Second, the detection of photospheric features of massive stars, e.g., Si IIλ1485 and S Vλ1502 (Sect. 3.2), means that it is likely that the UV continuum emission is predominately due to massive stars. Thus we would expect to also observe the absorption of the UV continuum arising in the stellar winds of those same early-type stars that dominate the continuum. Lastly, their velocity structure is vastly different from the saturated, broad absorption lines without the accompanying redshifted emission seen in gamma-ray burst afterglows (Fox et al. 2008) that arise from the circumburst medium. All these arguments support our interpretation that the observed the broad absorption lines of the resonance doublets of N V, Si IV, and C IV, are due to stellar winds.
What evidence do we have to conclude that the winds arise from hot, massive stars rather than the quasar accretion disk? Qualitatively, stellar winds and quasar-driven winds are the same phenomenon: radiation pressure generated by the UV photons which are resonantly trapped by high column density ionized gas. The photon trapping extracts the momentum from the UV radiation field which drives stellar winds and accretion disk winds of highly ionized gas. There are, however, differences in physical scales and the structure of the surrounding medium leading to different line profiles. Winds from rotationally-supported quasar accretion disk viewed through the outflow are classified as broad absorption line (BAL) quasars (Elvis 2000). Models of quasar accretion disk wind predict that high-ionization absorption lines in BAL quasars are often saturated and at times black (Arav et al. 1999a,b; Higginbottom et al. 2013; Matthews et al. 2016). Observationally, absorption features in BAL quasars are seen to have discrete velocity structure that is indicative of regions where the outflows collide with the ambient interstellar medium or narrow-line region gas. In Fig. A.3, it is apparent that the high-ionization absorption lines of PKS 0529-549, N V, Si IV, and C IV, have notably distinct velocity structures compared to TXS J1908+7220, a radio galaxy at z = 3.54 with BAL features (Dey 1999; De Breuck et al. 2001). In PKS 0529-549 these wind features appear smooth and do not have discrete velocity components as is observed in accretion disk winds. Rather, they appear akin to a collection of OB-stars (Fig. A.2; Walborn et al. 1985, 1995b). Spectra of BAL quasars lack photospheric features that are abundantly seen in PKS 0529-549 (Sects. 3.2 and 3.3). Thus the wind features seen in PKS 0529-549 do not have the same origin as those in BAL quasars, i.e., they are not quasar accretion disk winds.
Making the reasonable assumption that stellar winds cause the broad absorption lines of the resonant doublets in PKS 0529-549, we can deduce the spectral types of stars contributing to these features. We define the terminal velocity, νterminal, as the maximum velocity reached of the blueshifted absorption component, as illustrated by the blue shades in Fig. 2. To estimate the measurement errors in νterminal, we produce 100 Monte-Carlo realizations of the X-shooter spectrum (0.5 Å binning) using the error spectrum, repeat the measurement, and report the mean and standard deviation of νterminal as listed in Table 3. The N V, Si IV, and C IV resonant doublets have absorption components with νterminal ∼ 2600 − 3000 km s−1 with errors of 400–500 km s−1. Such high terminal velocities are similar to those seen in O-stars over a full range of surface gravities (Prinja et al. 1990). We thus infer that O-stars are the main contributor to the winds observed in PKS 0529-549. B supergiants are unlikely to contribute to the stellar winds observed here, given that their winds are characterized by lower terminal velocities, νterminal < 200 km s−1. The characteristics of the broad absorption lines are consistent with very young, a few Myr old, massive stars in PKS 0529-549 as we will elaborate in Sect. 3.5.1.
Terminal velocities of resonant line absorptions estimated from their blue intercepts with the continuum, λedge quoted in the rest-frame.
3.5. Characterizing the young stellar population
Having identified signatures of young stars in the UV spectrum of PKS 0529-549 in the previous subsections, we now proceed to quantify its recent star-formation history by comparing to model spectra and observed spectra of galaxies.
3.5.1. Evidence for recent bursts of star formation
To derive constraints on the star-formation history of PKS 0529-549, we compare the stellar photospheric and wind features we observe to the model spectra generated with the Starburst99 tool v7.0.1 (Leitherer et al. 1999, 2014). As input parameters, we adopt a Kroupa (2001) initial mass function and the default values for supernova and blackhole cut-off masses. We use the Geneva stellar evolution tracks with zero stellar rotation, along with the mass loss rates, at solar metallicity Z⊙ = 0.014 (Ekström et al. 2012). All other parameters used are the recommended values.
The star-formation histories used to generate the model spectra probe two extreme cases: (1) an instantaneous burst creating a stellar population with an initial mass of 106 M⊙; and (2) a continuous star-formation rate of 1 M⊙ yr−1. A comparison of these model spectra at different ages to that of PKS 0529-549 is shown in Fig. 3, zoomed to the wavelength range containing the two most significantly detected photospheric features, namely Si IIλ1485 and S Vλ1502 having comparable equivalent widths (Sect. 3.2). In general, the instantaneous burst model provides a better, although still imperfect, match to the photospheric line depths than the continuous star formation model which is unable to reproduce the depth of the Si IIλ1485 absorption. Further inspection of the relative strengths of the two photospheric lines provides clues to a bursty star-formation history. A younger age of 3–6 Myr provides the deepest (although still insufficient) S Vλ1502 line, while an older age of ≳20 Myr is needed to reproduce the depth of the Si IIλ1485 line. This can be easily understood once the origins of these photospheric features are considered (Sect. 3.2): S Vλ1502 originates from O- and early B-type stars, whereas Si IIλ1485 originates from mid- and late B-type stars. The simultaneous occurrence of the two features with such depths implies that more than one burst took place in the recent past. The simplest explanation would be that two bursts of star formation took place in the past ∼100 Myr. To identify the best-fitting model, we heavily bin and resample the X-shooter spectrum to match the resolution of the model spectra, and use the associated variance to compute chi-square values in the wavelength ranges of 1480–1489 Å and 1494–1506 Å corresponding to the Si IIλ1485 and S Vλ1502 features. We determine that the models of a burst age of  Myr and ≳20 Myr provide the best fit to the S Vλ1502 and Si IIλ1485 features, respectively. Only a lower limit on the age based on the fit to the Si IIλ1485 feature is obtained due to the relatively longer lifetime of late B-type stars. Additional bursts cannot be entirely ruled out, but they are not necessary to reproduce the stellar features on the UV spectrum. In contrast, the model spectra of continuous star-formation history provide poor matches to the line depths of both absorption features, as confirmed by the higher chi-square values. At all ages the Si IIλ1485 is weaker than S Vλ1502. The comparable strengths of Si IIλ1485 and S Vλ1502 highlight the bursty nature of the recent star formation in PKS 0529-549, which is distinct from a continuous one observed in lower mass Lyman-break galaxies at comparable redshifts (de Mello et al. 2000; Pettini et al. 2000; Quider et al. 2009, 2010).
The absolute strengths of the Si IIλ1485 and S Vλ1502 photospheric lines provide additional evidence for a short star-formation timescale. Both features are observed to be deeper than predicted by any model spectra explored here. Given that both Si and S are α-elements, their over-abundance compared to the Sun is in accord with the expectation that PKS 0529-549 would evolve to become a massive elliptical – they are enhanced in α-elements due to their short star-formation timescales (Tinsley 1979; Greggio & Renzini 1983; Thomas et al. 1999, 2005). The high abundance is further corroborated by the presence of photospheric metal lines such as O IV, O V, and Fe V as discussed in Sect. 3.3.
The full comparison of the UV spectrum of PKS 0529-549 to models is illustrated in Figs. A.4 and A.5 for the respective star-formation histories. The model spectra only provide predictions of stellar features, while it is apparent that additional features from AGN and the interstellar medium are certainly present in PKS 0529-549. Below we make note of the anomalies in the comparison to the model spectra. None of the model stellar spectra can reproduce the strong resonant emission lines (N V, Si IV, and C IV) detected in PKS 0529-549. This implies that the AGN must be at least partially responsible for the emission of these resonant doublets. As for the absorption components of the resonant lines, it is difficult to conclusively determine the age with these features for two reasons. Firstly, absorption lines are partially filled by the emission components as well as nearby strong emission lines, e.g., Lyα is just blue-ward of N Vλ1238, and Si II*λ1533 is blue-ward of C IVλ1548. Secondly, stellar wind lines are stronger and have larger blueshifts in more metal-rich galaxies (Leitherer et al. 2001). These complications may explain why none of the model spectra over the age range 1–50 Myr can simultaneously reproduce the absorption components of all the resonance lines. Nonetheless, the Si IV resonant doublet is well-reproduced by a young stellar population of a few Myr-old burst. If the blue absorption edge of Si IV is attributed to stellar wind, evolved O-type supergiants are required to reproduce this feature. They only appear between 3–6 Myr after an instantaneous burst (see Sect. 3.5.2; Conti et al. 1996).
Some photospheric features that are expected to be in absorption are instead observed in emission in PKS 0529-549, as discussed in Sect. 3.3. Such features include the C IIIλλ1426,1428 and C IIIλ1620. Moreover, it appears that the N Vλλ1616,1621 doublet and N IVλ1718 may have P-Cygni profiles. Wolf–Rayet stars are known to show emission or P-Cygni profiles in some lines that are normally in absorption in O-stars (Willis 1982; Kinney et al. 1993). The presence of Wolf–Rayet stars is suggested by the possible absorption components in He II as discussed in Sects. 3.1 and 3.2. Unfortunately, the strongest Wolf–Rayet star features lie in the rest-frame optical, such as N IIIλ4640, He IIλ4686, and C IVλ5808 (Conti 1991). All these features are redshifted into the observed NIR, which is unfortunately plagued by sky emission lines and is not particularly sensitive. Although we are unable to unambiguously determine whether Wolf–Rayet stars are present in PKS 0529-549, given the dominance of young stars in its UV continuum emission and the young age of its UV-emitting stellar population, observing a contribution from Wolf–Rayet stars in the spectrum of PKS 0529-549 would not be a surprise. On the other hand, galactic winds have been suggested to be responsible for the emission of excited fine-structure lines in distant star-forming galaxies (Si II* and Fe II*; Shapley et al. 2003; Steidel et al. 2016; Finley et al. 2017; but see also Dessauges-Zavadsky et al. 2010). If these excited lines of different elements share a common origin, their presence in galaxies of all star-formation histories, whether bursty or continuous, might favour the interpretation that they originate from resonant scattering associated with galactic winds rather than from short-lived Wolf–Rayet stars. We will explore the nature of these excited lines in a forthcoming paper.
We note that the blends of photospheric lines Si III + C III at 1294–1296 Å, as well as C II + N III at 1324 Å, are poorly reproduced in Starburst99 models. A similar remark was made in the analysis of the composite UV spectrum of lensed star-forming galaxies at z ∼ 2 (Rigby et al. 2018).
3.5.2. Comparison with local starbursts: Starburst in knots
Only few nearby starburst galaxies have UV spectra of sufficiently high resolution to make for a useful comparison with our spectrum of PKS 0529-549. In Fig. 4 we illustrate the comparison to nearby starburst galaxies with detected photospheric features and have sufficiently high spectral resolution (< 0.5 Å), i.e., observed with the Goddard High Resolution Spectrograph aboard the HST (GHRS; Brandt et al. 1994)4. These starburst galaxies are all dwarf galaxies, where the spectra cover only the central starburst regions due to the limited field-of-view of the instrument. NGC 4214 is a barred irregular galaxy, while NGC 1741 is a merger with two clusters in the centres of the merging galaxies. The observed starburst knots in these two galaxies, NGC 4214-1 and NGC 1741B1, contain Wolf–Rayet stars and have best-fitting ages of 4–5 Myr (Conti et al. 1996; Leitherer et al. 1996). On the other hand, the super star cluster NGC 1705-1 has a slightly older age, ∼10 Myr (Heckman & Leitherer 1997; de Mello et al. 2000).
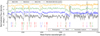 |
Fig. 4. Comparison of the UV spectra of PKS 0529-549 (black; this work) to three nearby dwarf galaxies with recent star formation. NGC 4214-1 (green) and NGC 1741-B1 (blue) are both aged ∼4 − 5 Myr, while NGC 1705-1 (yellow) is slightly older with age ∼10 Myr (Conti et al. 1996; Leitherer et al. 1996; Heckman & Leitherer 1997; de Mello et al. 2000). Following the colour scheme of Fig. 2, we indicate the wavelengths of various lines in the spectra annotated with the ion responsible, and show the error spectrum as a grey shade. Note that the blue absorption edge of Si IV, seen in all galaxies plotted here except the most evolved NGC 1705, suggests the presence of a population of O-type supergiants that appear at 3–6 Myr after an instantaneous burst (Conti et al. 1996). The spectra have been continuum normalized to unity, and shifted upwards in increments of 0.6 for visualization. |
The stellar features in the nearby starbursting dwarf galaxies are overall similar to those in PKS 0529-549 with small differences, as seen in Fig. 4. The Si IV absorption wing of PKS 0529-549 resembles that of the younger NGC 4214-1 and NGC 1741B1 rather than the slightly older NGC 1705-1. This is in line with our findings presented in Sect. 3.5.1 that PKS 0529-549 hosts a young stellar population of around 4–7 Myr old. Another noticeable difference between PKS 0529-549 and nearby starbursting dwarf galaxies is the strength of the metal lines (e.g., Fe V, O IV, O V, S V). These metal absorption lines are prominent features in PKS 0529-549 as discussed in Sect. 3.5.1, but are weak or absent in nearby starbursting dwarf galaxies. This is in accord with the expectation that the star formation in PKS 0529-549 likely took place in gas pre-enriched by previous episodes of star formation that assembled the bulk of its stellar mass (> 1011 M⊙). As stellar mass is observed to be correlated with the metallicity (Tremonti et al. 2004), the absence of metal lines in nearby dwarf galaxies, having only 1/4–1/2 solar metallicity, are as expected.
A remarkable observation is that the photospheric lines (e.g., C IIIλ1247, S Vλ1502) in PKS 0529-549 are as narrow as those in the starburst knots as shown in Fig. 4, despite a few orders of magnitude difference in mass. The intrinsic velocity dispersion of photospheric lines are σ⋆∼ 0.6–3.0 Å in the rest frame after correcting for velocity smearing by the instrument, as listed in Table 2. These line widths correspond to about σ⋆ ⩽ 55 km s−1, indeed comparable to those of the nearby starburst knots and in fact not much higher than those of Galactic giant H II regions (up to ∼25 km s−1; e.g., Melnick et al. 1987). The photospheric features have remarkably narrow dispersions when compared to similarly massive quiescent galaxies at z ∼ 2 (σ⋆ ⪆ 250 km s−1; e.g., Toft et al. 2012). The small stellar dispersions suggest that the recent star formation in PKS 0529-549 is concentrated in starburst knots on a smaller scale than the host galaxy, and are kinematically decoupled from the gravitational potential.
Multiple factors contribute to broadening the photospheric lines observed in PKS 0529-549. In addition to the bulk motion of stars, photospheric lines are also broadened by processes intrinsic to stellar atmospheres, such as thermal and pressure broadening, as well as rotation (see review in Gray 2008, Ch. 11). Disentangling the effects of these processes is clearly beyond the scope of this paper. Here, we take an educated guess of the most important processes that broaden the photospheric lines in PKS 0529-549. For the OB-type stars that dominate the UV spectrum of PKS 0529-549, the atmospheres of these individual stars can have intrinsic velocities of tens or up to a couple of hundreds of km s−1 (Slettebak 1956; Stoeckley 1968). Thermal broadening is likely more significant than pressure broadening to explain the line width of these hot stars, given the low density of the atmospheres of supergiants that dominate the UV spectrum of PKS 0529-549 (see Sect. 3.5.1). On the other hand, ALMA [C I] observations of the cold star-forming gas of PKS 0529-549 has narrow velocity dispersion of σ[C I] ≲ 30 km s−1, as we elaborated in Lelli et al. (2018) and shall further discuss in Sect. 4. These facts together suggest that the widths of the photospheric lines of PKS 0529-549 are dominated by the stellar atmosphere rather than their kinematics within the host galaxy. If true, the narrow intrinsic stellar dispersion may indicate gas compression in PKS 0529-549, as we shall discuss in detail in Sect. 5.2.
3.5.3. Multiple velocity components of star formation
X-shooter and ALMA have sufficient spectral resolution to resolve the profiles of the emission and absorption lines in PKS 0529-549. In order to better characterize the nature of the peculiar He II emission line profile as discussed in Sects. 3.1 and 3.2, we compare it with the [C I] emission as well as the photospheric lines that are not affected by nearby absorption features. The two narrow He IIλ1640 peaks coincide with the two ALMA [C I] (2–1) velocity components. The photospheric lines may also have at least two velocity components5. Most notably, C IIIλ1247, O Vλ1371, and Si IIλ1485 have two absorption components that coincide with the emission of He II and [C I]. The three absorption components of S Vλ1502, on the other hand, coincide with the absorption components of He II. These observations may suggest that part of both the He IIλ1640 emission and absorption could be due to young stars in addition to being photoionized by the AGN. Attributing the emission and absorption at least partially to young stars could alleviate the tension between the observed C III]/He II and Lyα/He II ratios of PKS 0529-549 compared to photoionization model predictions and other high-redshift radio galaxies (Humphrey et al. 2008). Deep, high-resolution spectroscopic observations in the UV and submillimeter are required to determine that the two velocity components in the UV correspond to two spatial components as suggested by the current data. Overall, multiple velocity components are consistent with our finding that PKS 0529-549 has undergone multiple bursts of star formation of different ages as discussed in Sect. 3.5.1.
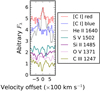 |
Fig. 5. A comparison of the profiles of photospheric absorption lines (C IIIλ1247, O Vλ1371, Si IIλ1485, and S Vλ1502) to He IIλ1640 and [C I] (2–1) emission lines. PKS 0529-549 has an asymmetric He IIλ1640 emission line profile, consisting of two possible absorbers over a broad emission line and/or multiple narrower emission line components. This is in stark contrast with other high-redshift radio galaxies whose He II emission is dominated by broad emission. Note that the He II absorption at ∼300 km s−1 is affected by faint sky lines and thus is not considered to be a real feature here. The red and blue lines are the [C I] spectra extracted from two separate regions from the ALMA cube (Table 4). Note that the photospheric lines might consist of multiple velocity components corresponding to the He II emission or absorption lines, or they might be resolved into multiplets. The X-shooter spectrum has been normalized to its continuum, Gaussian smoothed, and arbitrarily shifted upwards for easier visualization. |
3.5.4. Obscuration of the young stars in PKS 0529-549
The slope and the polarization of the UV continuum inform us whether the UV photons originate from massive stars or the AGN. Spectropolarmetric observations of PKS 0529-549 have placed a stringent upper-limit on the polarization of < 12.3% (from a deep VLT/FORS spectrum taken by JDRV; D. Buchard 2008 M.Sc. thesis). Therefore, the lack of polarization implies that, unlike other radio galaxies (Cimatti et al. 1993, 1997, 1998; Dey et al. 1996; Vernet et al. 2001), the UV continuum of PKS 0529-549 is dominated by starlight as in 4C 41.17 (Dey et al. 1997) and that its slope can be used to estimate the unobscured star-formation rate.
Best-fitting parameters to the [C I] 3P2−3P1 emission line as measured from the ALMA spectrum of PKS 0529-549.
By fitting the continuum with a power law while excluding regions with strong emission and absorption lines, we estimate the best-fitting continuum between rest-frame 1245–1534 Å (UVB arm, roughly between Lyα and C IV) to be  , where fλ, the observed flux density, is in units of erg s−1 cm−2 Å−1, and λobs is the observed wavelength in Å. On the other hand, the continuum between rest-frame 1668 and 2300 Å (VIS arm, roughly between O III] and [O III]) is best-fitted with fλ = (1.3 ± 0.2) × 10−16
 . The UV slope6, β1500 Å, is redder than other HzRGs which have been observed (Vernet et al. 2001).
We make use of the spectral constraints of the stellar age to break the dust-age degeneracy. The rest-frame 1500 Å luminosity is given by  . Using the best-fit power law to the continuum, we estimate that the specific luminosity at rest-frame 1500 Å to be 4.7 × 1040 erg s−1 Å−1. This specific luminosity corresponds to an unobscured SFR of ∼40, 90, and 1590 M⊙ yr−1 for a stellar population with ages of 4, 6, and 44 Myr-old for a single burst, or 6–8 M⊙ yr−1 for continuous star formation at the same age interval (Leitherer et al. 1999). The high star-formation rate and high infrared luminosity estimated by Falkendal et al. 2019 (see Table 1), 1020 M⊙ yr−1, is highly discrepant with our estimate from the UV continuum, implying that the UV continuum must be heavily obscured.
So what fraction of star formation is obscured? First, we use Starburst99 model spectra for the relationship between the UV continuum slope and the age of a stellar population. For both instantaneous burst and continuous star-formation history, the intrinsic β1500 Å is ∼ − 2.5 for all ages ≲10 Myr, and is about −1.5 for a single ∼45 Myr burst for our explored models (Leitherer et al. 1999). Comparing these values to the observed β1500 Å ∼ −0.3, we infer an extinction of 1.2–2.2 mag. This extinction estimate is much lower than that of the dust torus obscuring the AGN in PKS 0529-549 (AV = 34.1; Drouart et al. 2012) and consistent with that estimated for the narrow-line region (AV = 1.6 ± 1.0; Humphrey et al. 2008). This supports our interpretation that the UV continuum traces region far beyond the AGN proper and is embedded within the narrow-line region on galaxy-wide scale.
To understand the implication of the dust attenuation, we compare PKS 0529-549 to the empirical IRX-β relation (Meurer et al. 1999). The infrared excess IRX is defined as LIR/L1500 Å. The IRX of PKS 0529-549 is ∼102.6, which is significantly above any standard dust attenuation conventionally considered for the Milky Way and the Magellanic Clouds, and falls well in the region of dusty star-forming galaxies at z = 2 − 3 (Nordon et al. 2013; Casey et al. 2014). Possible explanations for the boosted IRX/β ratio compared to conventional dust attenuation laws include a bursty star formation history, high turbulence, low obscuration fraction of stellar light, a mixed distribution of stars and dust (as opposed to a dust screen geometry), and high optical depth in birth clouds surrounding young stars (Calzetti 2001; Kong et al. 2004; Boquien et al. 2009; Wild et al. 2011; Casey et al. 2014; Popping et al. 2017b). All these effects are plausible in PKS 0529-549, and most certainly we have evidence for bursty star formation (Sect. 3.5.1). Determining the relative importance of these effects is beyond the scope of this paper.
While high LIR/L1500 Å ratio is usually attributed to highly obscured star formation, this inference assumes implicitly that star formation has been continuous, such that the SFRs measured at UV and IR can be inferred from each other. In Sect. 3.5.1 we have shown that PKS 0529-549 has undergone bursts of star formation in the past ∼100 Myr. An alternative and equally viable explanation for its discrepant IR and UV luminosities is a rapid decline of star formation in the recent past. UV continuum traces recent star formation while FIR is sensitive to longer timescales (Hayward et al. 2014). This is because A-stars can continue to heat the dust and thereby power the FIR emission, while contributing little to the UV emission. The implication of this interpretation will be further discussed in Sect. 5.3.
3.6. Resemblance to 4C 41.17
The rest-frame UV spectrum of PKS 0529-549 is strikingly similar to that of 4C 41.17 (Fig. 2), a high-redshift radio galaxy that has been widely cited as an example of AGN-triggered star formation (Dey et al. 1997; Bicknell et al. 2000). The evidence for triggered star formation is the detection of a young stellar population through the photospheric absorption line S Vλ1502 and the blue absorption wing of Si IV. Both of these features are strongly detected in PKS 0529-549, along with additional photospheric features thanks to the high signal-to-noise ratio and spectral resolution of the X-shooter spectrum. In addition to the stellar UV absorption lines, there are several other similarities between PKS 0529-549 and 4C 41.17. Both UV continua show very low polarization and relatively flat slopes consistent with intense, heavily obscured star formation. The resonant lines, N V, Si IV and C IV, have similar structure in both HzRGs. The two sources are comparably radio-luminous. Although 4C 41.17 is the only radio galaxy with both a high star-formation rate and a deep rest-frame UV spectrum to compare with, this does show that it is possible for other high-redshift radio galaxies to exhibit a spectrum as we have observed. Summing up, these similarities suggest that PKS 0529-549 is likely in a similar evolutionary stage of high-redshift radio galaxies as 4C 41.17. We will discuss the implications in a broader context in Sect. 5.
4. Result II: Low cold gas-mass fraction and high star-formation efficiency
The atomic carbon [C I] 3P2−3P1 emission line at νrest = 809.34197 GHz, hereafter [C I] (2–1), is a tracer for the H2 gas mass (Weiß et al. 2003; Papadopoulos et al. 2004; Walter et al. 2011). [C I] (2–1) has a critical density of (1.2 × 10³) cm−3, comparable to CO J = 1–0 and probes diffuse molecular gas. [C I] is thought to be a better tracer of H2 mass than CO, because it is less sensitive to variations in metallicity and evolutionary stage of the giant molecular clouds (Glover & Clark 2016). In particular [C I] is argued to be a preferred tracer of molecular H2 in vigorously star-forming galaxies like PKS 0529-549, in which the lower J level CO lines may become optically thick, and the cosmic ray intensity in starburst galaxies or AGN hosts may be high enough to dissociate CO molecules (Papadopoulos et al. 2004; Bisbas et al. 2015, 2017).
Properties of efficiently star-forming, high-redshift radio galaxies.
In Fig. 6 we show the ALMA [C I] (2–1) spectrum, extracted using an elliptical aperture centered at  , with major and minor axes corresponding to
  at a position angle of 20°. The extraction aperture was defined using the continuum-subtracted moment-0 map around the [C I] (2–1) line. The [C I] (2–1) emission is clearly detected at the H-band continuum position and therefore encompassed by the X-shooter slit (Fig. 1). The [C I] emission is near, but not exactly co-spatial with the western radio lobe. No [C I] (2–1) emission is detected at the position of the eastern lobe. While the CO (7-6) line is observed in the same spectral window, it is too close to the edge of the bandpass to be useful. The [C I] (2–1) emission on the western lobe is double-horned, and the two velocity peaks are separated by
  or ∼4 kpc in projection on the sky. We have already presented a detailed dynamical model of the [C I] (2–1) emission in Lelli et al. (2018). The [C I] (2–1) emission is well-described by a dynamically cold rotating disk with rotation velocity of ∼310 km s−1 and intrinsic dispersion of σ[C I] ≲ 30 km s−1 (see Sect. 3.5.2).
To measure the [C I] (2–1) line flux for PKS 0529-549, we fit the extracted 1D spectrum with two Gaussian components and a continuum as shown in Fig. 6. The ALMA Band 6 continuum of the host galaxy is (1.33 ± 0.16) mJy (Falkendal et al. 2019, Table A.13 western component), which was estimated using the full bandwidth of four spectral windows with line channels excluded. Given the narrow bandwidth covered by each ALMA spectral window, the continuum can be approximated as a flat, straight line. The best-fitting parameters of the two Gaussian components are listed in Table 4. Integrating the line emission, we find a total velocity-integrated flux SΔν = (2.0 ± 0.5) Jy km s−1.
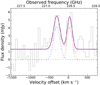 |
Fig. 6. The integrated [C I] (2–1) spectrum of PKS 0529-549. The best-fitting model (solid purple) is superposed on the Band 6 ALMA spectrum (grey histogram). The individual components are plotted as dashed lines, including the two independent Gaussian components (blue and red) and the continuum (grey horizontal). |
We first estimate the neutral atomic carbon mass from the [C I] (2–1) line luminosity, following the approach derived in Papadopoulos et al. (2004). We assume local thermodynamic equilibrium, that the [C I] lines are optically thin, and that the excitation factor Q21 = 0.5. The excitation factor Q21, defined as the fraction of the column density originating from the upper level transition, is a factor ranging from 0 to 1. Q21 is a function of the temperature, density and radiation field, none of which we can directly constrain without observations of other lines such as [C I] 3P1−3P0 or multiple CO lines. We note, however, that the uncertainty in Q21 can only affect the gas mass estimate by a factor of two at most, comparable to measurement errors.
To convert the neutral carbon mass to global molecular hydrogen mass MH2, we adopt an [C I]-to-H2 abundance, X[C I] = 3 × 10⁻⁵ following the value derived for M82 (Weiß et al. 2003) and adopted in subsequent studies (Papadopoulos & Greve 2004; Wagg et al. 2006; Gullberg et al. 2016b). The conversion to molecular mass includes the mass in Helium by a correction factor of 1.36 (e.g., Solomon & Vanden Bout 2005). The adopted value of X[C I] agrees well with that predicted for metal-rich galaxies like PKS 0529-549 (Glover & Clark 2016). The systematic uncertainties to measuring the H2 gas mass with [C I] are discussed in detail in Papadopoulos et al. (2004), and appear comparable to the measurement uncertainty in our case. Noting the linear dependence of MH2 on X[C I] and Q21, we estimate based on theoretical studies (Glover et al. 2015; Glover & Clark 2016) that the [C I]-to-H2 conversion has a systematic uncertainty of at most ∼3. Indeed, H2 masses inferred from [C I] and CO agree within a factor of 2–3 for dusty star-forming galaxies with properties similar to PKS 0529-549 (Alaghband-Zadeh et al. 2013; Bothwell et al. 2017). The derived MH2 values are listed in Table 4 for the two velocity components, amounting to a total molecular mass of MH2 = (3.9 ± 1.0) × 1010 M⊙. Its molecular gas fraction, defined as fgas ≡ MH2/(MH2 + M⋆), is only (12 ± 7)%. This implies that PKS 0529-549 is nearing the end of its star formation and will soon run out of fuel7 and quench.
We estimate the star-formation efficiency, SFE ≡ SFR/MH2, of the entire system. Using MH2 derived here and the SFR, we find SFE = (26 ± 8) Gyr−1. The depletion timescale, defined as the inverse of SFE, is then tdepl ≡ SFE−1 = (38 ± 12) Myr. We provide these values in Table 5. These results imply that PKS 0529-549 is forming stars more efficiently than the Milky Way by at least an order-of-magnitude. In Sect. 5.2.1 we further derive the relation between the surface densities of gas and star formation in PKS 0529-549, and discuss it in context with other galaxies at comparable redshifts and stellar masses.
5. Discussion
Our multi-wavelength analysis makes PKS 0529-549 one of the high-redshift galaxies with best-constrained star-formation history and conditions. What can we learn about AGN feedback and star formation quenching from this detailed investigation? What is the relation between its radio jets and extreme star formation – a mere coincidence, a co-evolution, or a causality? In this Section, we address these questions by making use of the exquisite insights from our analysis of PKS 0529-549 and compare its properties with various galaxy populations.
5.1. A synthetic picture: quenching via gas depletion
The relationship between the radio jets and star formation, if any, can be investigated through the star-formation efficiency, the star-formation rate per unit cold gas mass. To understand the implications of the SFE derived in Sect. 4, in Fig. 7 we plot the SFE and tdepl as a function of fgas together with several galaxy populations at z = 1.3−4.1 with SFR, M⋆, and MH2 measurements through [C I], CO, or dust continuum. Whenever relevant, the masses have been adjusted to the cosmology and IMF used in this work. We also estimate the SFE for other radio galaxies with high SFRs and compact radio sources. The high-redshift radio galaxy (HzRG) sample includes PKS 0529-549 (this work; Falkendal et al. 2019), 4C 41.17 (Dey et al. 1997; De Breuck et al. 2005, 2010; Drouart et al. 2016), the Dragonfly galaxy (MRC 0152-209; De Breuck et al. 2010; Emonts et al. 2015a; Falkendal et al. 2019), the Spiderweb galaxy (MRC 1138-262; Hatch et al. 2009; Gullberg et al. 2016b), 4C 60.07 (Greve et al. 2004; De Breuck et al. 2010), and MRC 0943-242 (Gullberg et al. 2016a). In the case of the Dragonfly and MRC 0943-242, only the host galaxies are considered rather than the extended gas reservoir and nearby companions. All six HzRGs have MH2 estimated from either the [C I] or low J-level CO emission lines.
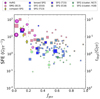 |
Fig. 7. Star-formation efficiency (SFE ≡ SFR/MH2) as a function of molecular gas fraction fgas ≡ MH2/(MH2 + M⋆) of PKS 0529-549 and other galaxies at z = 1.3−4.1. High-redshift radio galaxies are plotted as magenta circles, individually labeled as (1) PKS 0529-549, the subject of this work; (2) 4C 41.17; (3) MRC 0152-209, the Dragonfly; (4) MRC 1138-262, the Spiderweb; (5) 4C 60.07; and (6) MRC 0943-242. Submillimeter galaxies are plotted as pink squares. Star-forming galaxies are plotted as blue squares, with different shades referring to the respective samples. Compact star-forming galaxies are plotted as yellow diamonds. Cluster galaxies are plotted as green circles. Full references are provided in Sect. 5.1. The symbol size denotes the stellar mass of each galaxy split in three bins of M⋆ ⩾ 3 × 10¹¹ M⊙, 1−3 × 10¹¹ M⊙, and <1011 M⊙, where larger symbols represent more massive galaxies. The edge colours of each symbol indicate the MH2 tracer: black for [C I], grey for CO, and brown for dust continuum. The grey dashed lines mark the corner for the efficiently star-forming and gas-poor galaxies. |
We also overplot a compilation of star-forming galaxies at z = 1.3−4 with MH2 measurements. These include the colour-selected sample8 of Daddi et al. (2010) and the PHIBBS sample (Tacconi et al. 2013) which are both CO surveys, the ALMA dust continuum samples of SFGs at z = 1.3−3.2 (Elbaz et al. 2018) and at z = 2.53 (Tadaki et al. 2015), as well as several lensed SFGs with dust continuum and CO detections (Bothwell et al. 2013a; Sharon 2013; Dessauges-Zavadsky et al. 2015; Nayyeri et al. 2017). Compact SFGs (Tadaki et al. 2015, 2017; Spilker et al. 2016; Barro et al. 2017; Popping et al. 2017a) and luminous submillimeter galaxies (SMGs) from the sample of Bothwell et al. (2013a) are also plotted. To investigate potential effects due to environment, we also plot two cluster galaxy samples at z = 1.5−1.6 (Noble et al. 2017; Hayashi et al. 2018).
Several observations can be made from Fig. 7. The HzRGs plotted here in general have lower fgas than most star-forming galaxies at high redshifts. The first four HzRGs including PKS 0529-549 have fgas ≲ 20% that puts them on par with local spiral galaxies (e.g., Leroy et al. 2008). Considering the broader population of HzRGs including those that do not have gas mass measurements and therefore not shown in Fig. 7, HzRGs overall likely have even lower fgas as most of them are undetected in [C I] searches (T. Falkendal, priv. comm.). Since HzRGs are the most massive galaxies at z = 0−4 (Miley & De Breuck 2008), their low fgas is as expected if they would soon quench their star formation. Another observation is that HzRGs plotted in Fig. 7 appear more efficiently star-forming than normal disk galaxies at z ∼ 2 by an order-of-magnitude. The difference is larger than any systematic uncertainty inherent to estimates of H2 mass (such as abundance, excitation correction) or SFR (such as the IMF, dust correction, calibration). Lastly, we find no evidence for the environment in driving the star formation activity and gas depletion, other than perhaps enhancing the merger rate, given that HzRGs reside in dense environments and are relatively gas depleted compared to the brightest, ALMA-detected cluster galaxies.
Restricting our comparison to massive galaxies (M⋆ > 1011 M⊙), high SFE (>10 Gyr−1), and low gas fractions (fgas ⩽ 20%), we identify other classes of galaxies which are as depleted in gas and yet as efficiently star-forming. A subset of SMGs match these criteria (Bothwell et al. 2013b; see also Ivison et al. 2011). including the lensed dusty star-forming galaxy, NA.v1.489, which is also a SMG (Nayyeri et al. 2017), as well as most compact star-forming galaxies. While it can be argued that their higher SFE and lower fgas might be attributed to the choice of CO-to-H2 conversion factor that could vary by a factor of ∼4, we highlight that the discrepancy still stands if we only consider the galaxies with [C I] measurements and thus unaffected by this systematic uncertainty. What all these galaxies have in common is their high cold gas surface densities, with extreme star formation confined to only a few kpc, likely driven by compressive gas flows and/or mergers, as we shall discuss in Sect. 5.2.1. In fact, several of these galaxies are shown to be ongoing mergers or merger remnants, including the Dragonfly galaxy (Emonts et al. 2015b,a), the Spiderweb galaxy (Gullberg et al. 2016b), 4C 41.17 (De Breuck et al. 2005), and one of the four SMGs in this region (SMMJ123711+622212; Bothwell et al. 2013b). In Sect. 5.2.3 we discuss the possibility of PKS 0529-549 as an interacting system. This merger fraction of ∼4/12 is significantly higher than comparably massive galaxies at z ∼ 2 (Man et al. 2016a; Silva et al. 2018). In addition to the HzRGs, there is at least another galaxy in that region that hosts an AGN (SMMJ030227+000653; Bothwell et al. 2013b). Therefore the AGN fraction is also high, at least 5/12. Our findings corroborate several studies reporting low fgas and short tdepl among z > 1 AGN host galaxies compared to matched non-AGN samples (Brusa et al. 2015; Fiore et al. 2017; Kakkad et al. 2017). While the data at hand are insufficient for us to infer whether AGN or mergers are responsible for compressive gas motions, their prevalence among galaxies with high SFE and low fgas suggests that both are plausible mechanisms. We will discuss possible triggers of gas compression in Sect. 5.2.3.
5.2. Gas compression as the key to efficient star formation
5.2.1. Clues from observations
Aside from star-formation efficiency arguments, we can discern the role of jets in influencing star formation through the Schmidt–Kennicutt relation (Kennicutt 1998b). If jets can induce star formation, one might expect the surface density of star formation, ΣSFR, to be enhanced relative to the surface density of the molecular gas, Σgas. We estimate ΣSFR and Σgas for PKS 0529-549 using the SFR estimate from Table 5, gas mass inferred from the [C I] emission (Sect. 4), and use the deconvolved radius of the [C I] disk as the size of the star-forming region (R ∼ 4 kpc; Lelli et al. 2018). As in Fig. 7, we also estimate ΣSFR and Σgas for 4C 41.17 and the Dragonfly galaxy as listed on Table 5. For the Dragonfly galaxy we estimate R to be 1.5 kpc based on high-resolution CO (6-5) imaging (Emonts et al. 2015b). For 4C 41.17, we estimate R to be half of the extent of the optical emission (Miley et al. 1992, adjusted to the same cosmology). Although the Spiderweb galaxy is comparable in terms of SFE and fgas to these three HzRGs, there are only upper limits on both the SFR and the size (Gullberg et al. 2016b) and therefore no meaningful constraint on ΣSFR can be obtained with present data. We compare these results to other studies of the Schmidt–Kennicutt relations presented in the literature (Kennicutt 1998b; Daddi et al. 2010; Genzel et al. 2010).
Our sample of high-redshift radio galaxy hosts lie above the standard relationship as shown in Fig. 8. Their ΣSFR is on par with the most efficiently star-forming regions within the Milky Way (massive dense clumps and young stellar objects; Wu et al. 2010; Heiderman et al. 2010). This suggests that star formation in these HzRGs is governed by a process that dominates the disk-averaged self-gravity picture outlined in Kennicutt (1998b), wherein disk-wide star formation is assumed to scale with the growth rate of perturbation in the gas disk. As the free-fall timescale is inversely proportional to density, the offset of the HzRGs from the Schmidt–Kennicutt relation lends further support to our interpretation that the efficient star formation in radio galaxies including PKS 0529-549 is localized in regions of compressed gas (Sect. 3.5.2).
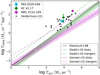 |
Fig. 8. The surface density of gas, Σgas, versus the surface density of the star-formation rate, ΣSFR (the “Schmidt–Kennicutt relation”; Kennicutt 1998b). We show the locations of three high-redshift radio galaxies: PKS 0529-549 (blue diamond; this work); 4C 41.17 (green circle), and MRC 0152-209 (magenta pentagon). The black squares denote the Galactic massive HCN clumps from Heiderman et al. (2010). The lines indicate the best-fit to the data presented in the respective works, including local star-forming galaxies and circum-nuclear starbursts (black; Kennicutt 1998b), gas-rich galaxies at z ∼ 1−3 (magenta; Genzel et al. 2010), and colour-selected star-forming galaxies at z ∼ 1.5 (green; Daddi et al. 2010). Solid and dashed lines refer to the best-fit for disk star-forming galaxies and mergers, respectively. |
5.2.2. Theory
Strong gas compression and the concomitant rapid dissipation of mechanical energy of the gas flows would necessarily result in stellar systems with low velocity dispersions if the young stars formed coherently. This is regardless of whether the gas flows are driven by gravity (in case of mass transfer during a merger), or radio jets passing through the medium inducing instabilities, shocks or back flows. Our findings of PKS 0529-549 support this scenario: the young stellar population of PKS 0529-549 has narrow intrinsic dispersion of only a few tens of km s−1 as deduced from the stellar photospheric absorption lines (Sect. 3.5.2), and similarly for the cold, star-forming gas from the [C I] spectrum (Sect. 4 and Lelli et al. 2018). These narrow lines suggest strong and rapid dissipation of the mechanical energy in the gas.
We can quantify this scenario of efficient star formation due to rapid compression and dissipation in the context of recent theoretical studies on the subject (Semenov et al. 2017, 2018; Elmegreen 2018). The analytic framework of Semenov et al. (2017, 2018) is used here to guide our interpretation for the efficient star formation in PKS 0529-549 and other radio galaxies. Their model uses simple relations between the gas depletion timescale and the mass-loading factor (the mass rate of return of the gas to a non-star-forming state relative to the star-formation rate), and three timescales: (1) the time for gas to become star-forming (τ+); (2) the free-fall time of the cloud (τff); and (3) the time for star-forming gas to become non-star-forming (τ−, d).
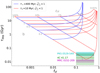 |
Fig. 9. An analytic model for the relation between the star-forming fraction of the total gas mass (fsf) and the gas depletion time (tdepl) reproduced from Semenov et al. (2018, Fig. 7). The grids show the predicted fsf and tdepl for various values of the star-formation efficiency per free-fall time (εff; how much of the gas is converted to stars on a cloud dynamical time), and the boost factor of momentum gain per supernova (b). We only show the b-values for the red grid lines. The key parameters of this model are the timescale for gas to become star-forming (τ+) and the timescale for the star-forming gas to be rendered non-star forming (τ−, d). The blue grid is for local disk galaxies with long τ+ (400 Myr) and the high ratio of τ+/τ−, d (5). The red grid shows the case where τ+ is short (10 Myr) and τ+/τ−, d is low (0.1). It is apparent that local disk galaxy models are inconsistent with the short tdepl (⩽100 Myr) observed in the three high redshift radio galaxies including PKS 0529-549. Gas compression can shorten tdepl by reducing τ+ (therefore low τ+/τ−, d), resulting in high fsf, i.e., high dense molecular gas fraction. |
In Fig. 9, we show two grids based on this analytic model. The first model describes local star-forming disk galaxies: the timescale for gas to become star-forming is long (τ+= 400 Myr, on the order of their disk orbital timescales), relative to the timescale to become non-star forming (τ−, d ⩽ 100 Myr). This results in long gas depletion timescales and a relatively low fraction of dense molecular gas, in agreement with observations of nearby spiral galaxies (e.g., Leroy et al. 2013; Usero et al. 2015). The second model describes starburst galaxies such as PKS 0529-549 that are undergoing strong compressional flows: the timescale for a molecular cloud to collapse remains the same, 4 Myr, but now, the timescale to become star-forming is very short, 10 Myr. This follows previous studies suggesting that under high pressure the conversion rate of gas to becoming molecular would be very high (e.g., Lehnert et al. 2009, 2013; Guillard et al. 2015, and many other studies). The additional pressure and compression would also imply that the mechanical and radiative energy output from the massive stars would be injected into an overall denser, higher filling factor environment, leading to less effective feedback. In summary, the two models vary mostly by τ+, with roughly similar τ−, d values. The short tdepl of the three radio galaxies discussed in detail is inconsistent with the first model based on local star-forming disk galaxies. Rather, these radio galaxies require the starburst model to explain their short tdepl, under the following conditions: the star-formation efficiency per free-fall time9, εff, is high (between a few % to 100%); the impact of feedback from massive stars appears weak, 0 ⩽ b ≪ 0.2; with a high fraction of star-forming gas, fsf ≳10% (i.e., high dense molecular gas fraction).
In summation, star formation is made more efficient by compressional gas flows, which are key to both changing the phase distribution of the ISM to be mostly molecular and high density and also, at least temporarily, quench the feedback from massive stars. The compression of the gas then results in stellar populations with modest velocity dispersions of tens of km s−1 as we observe in the young stars and cold gas of PKS 0529-549. Thus this rules out the predictions of high-velocity motions in the clouds or stars often seen in theoretical models or simulations (e.g., Zubovas et al. 2013b; Dugan et al. 2014).
5.2.3. Possible triggers for gas compression and depletion
In previous subsections we have argued for the significant role of gas compression in increasing the efficiency of star formation. More specifically, we argued that the gas compression likely leads to a higher fraction of dense gas compared to normal star-forming galaxies which then leads to a higher efficiency. It is therefore interesting to identify mechanisms that might trigger galaxy-wide gas compression and gas depletion. Multiple processes are taking place simultaneously in PKS 0529-549, including intense star formation, accretion onto the galactic nucleus and jets and ionized gas outflows associated with the supermassive blackhole, and a possible merger. The multiplicity of processes makes it challenging to attribute any galaxy-wide gas compression to a single process. Here, we discuss plausible mechanisms of gas compression and depletion, and use timescale arguments to estimate their relative importance.
Radio jets have been suggested by many theoretical studies to compress the interstellar medium to high densities (Fragile et al. 2004, 2017; Silk 2005, 2013; Gaibler et al. 2012; Dugan et al. 2014). This form of positive feedback effectively consumes the molecular H2 in the galaxy through episodes of efficient star formation. This appears to explain the efficient star formation of the HzRGs plotted in Fig. 7, all of which are compact radio sources. If we use typical scaling of the speed at which hot spots advance (Carilli et al. 1991), it is clear that the radio source of PKS 0529-549 is young (≲Myr old). The most recent burst of star formation may be consistent with the age of radio source, a few Myr, but not the much older burst of tens of Myr old. Observations of the warm ionized gas [O III] and Hα have already confirmed the existence of fast AGN-driven outflows in PKS 0529-549 (Nesvadba et al. 2017), although we note that the warm ionized gas mass is only ∼6% of the H2 mass as we derived in Sect. 4. In addition, the outflow of warm ionized gas likely does not play a role in triggering star formation in PKS 0529-549. This is because the star-forming ALMA [C I] gas is misaligned with the ionization cone probed by [O III] and Hα (Lelli et al. 2018) and the narrow stellar dispersion is at odds with the divergent gas outflows in AGN models. Overall, while the young radio jet may have triggered the most recent burst, the AGN is unlikely to have triggered gas compression due to its divergent nature of gas flows.
This is not to say that the outflow has no impact on the star formation. In addition to gas consumption through star formation, AGN outflows may work in concert to clear out the remaining gas and make quenching effective over a longer term. The AGN and star formation in PKS 0529-549 have comparable bolometric luminosities (LAGN = 6 × 10¹² L⊙ and LSF = 9 × 10¹² L⊙; Falkendal et al. 2019). Thus, if radiation pressure is effective in driving outflows then this would imply that the AGN and massive stars appear to have roughly equal contribution in dispersing the gas. The timescale estimated to disperse the warm ionized gas (Nesvadba et al. 2017) is much longer than the gas depletion timescale suggesting that star formation plays a more important role in consuming the gas than the outflow does in dispersing it. And of course, this estimate only includes the mass of the warm ionized gas. If we include the mass of the molecular gas, the timescale for the outflow to drive out of the gas would increase substantially.
Galaxy interaction, if PKS 0529-549 is an on-going merger, can be an additional trigger of compressive gas motions. As discussed in Falkendal et al. (2019, Sect. 6.1) and shown in Fig. 1, the dust continuum of PKS 0529-549 has an elongated morphology which is different from the synthesized beam, suggesting an ongoing merger. If the [C I] spectrum of PKS 0529-549 is interpreted as a two-component system rather than a rotating disk (Sect. 4), it suggests that PKS 0529-549 is undergoing a late-stage merger that is prevalent among starbursting radio galaxies at high redshift (De Breuck et al. 2005; Ivison et al. 2012). In that case, PKS 0529-549 may be analogous to MRC 0152-209 (Emonts et al. 2015b), wherein the timescale to transfer all the gas is shorter than that of the gas outflow or orbital timescales. This timescale comparison would again be consistent with a merger playing a key role in redistributing and likely compressing the gas. Although we do not have a complete census of the sources of momentum and energy in the gas of PKS 0529-549 or any of the radio galaxies in our various samples (see, e.g., Dey 1999; De Breuck et al. 2010; Ivison et al. 2013; Emonts et al. 2014, 2015b; Nesvadba et al. 2017; Falkendal et al. 2019), it is clear from PKS 0529-549 that both radio jets and the gravitational potential can induce compressive gas motions. Deciding which one is more important depends on the timescales over which they have and can operate.
5.3. Implications on the evolution of massive galaxies
PKS 0529-549 is likely nearing the end of its star formation by depleting its molecular gas reservoir. Although its current star-formation rate is high but perhaps less than it was during the past several 100 Myrs (see Sect. 3.5.4), when compared to similarly massive galaxies, in the long run, it will not significantly grow as the host galaxy is already massive. This is true even when assuming 100% efficiency in converting H2 to stars, the available gas reservoir can only increase the stellar mass by ∼12% at most. In conjunction with star formation, the active galactic nucleus helps to clear the galaxy of gas as evidenced by the fast, multi-phase outflow. The obscured quasar slows down accretion onto PKS 0529-549 during this “blowout” phase (Di Matteo et al. 2005; Hopkins et al. 2006), eventually bringing the end to the star formation and blackhole growth in this massive galaxy when it runs of out fuel.
What, then, can we learn about the overall evolution of massive galaxies from this analysis of PKS 0529-549? Falkendal et al. (2019) reported that most high-redshift radio galaxies (21 out of 25) are on their way to being quenched, meaning, their specific star formation rates are within, or below, those of “normal” galaxies at comparable masses and redshifts. Only four radio galaxies of the sample, including the subject of this work, PKS 0529-549, have specific star-formation rates higher than “normal” galaxies. At first glance, these findings could be considered as evidence for feedback from AGN removing the gas and quenching star formation. The difficulty with this hypothesis, as Falkendal et al. (2019) found, is that the majority of sources had both powerful AGN and no apparent star formation (upper limits less than about 100–200 M⊙ yr−1). Of course, one could argue that in the case of short periods of time, AGN feedback is positive and then turns negative as it blows the gas away. However, that would mean that the dusty gas would have to be removed completely in less than a lifetime of luminous radio sources (∼10 Myr), otherwise Falkendal et al. (2019) would have detected residual infrared emission. All the dust would have to be evacuated because any remaining dust would be heated by non-ionizing photons of the stellar population older than the radio source lifetime.
Given the difficulty with AGN feedback scenario, a more logical explanation is that the radio-loud AGN in these sources turn on during the “final throes” of the rapid growth of massive galaxies: massive stars heat up and disperse gas, creating favourable conditions in the ISM for AGN feedback to be efficient (Biernacki & Teyssier 2018). It is only when the gas fraction becomes relatively low that the feeding of the supermassive blackhole becomes significant (see Schawinski et al. 2009; Dubois et al. 2015; Volonteri et al. 2015a,b). Starbursting radio galaxies therefore represents a brief but not unique phase in the life of massive galaxies, as they transition toward radio-mode feedback wherein AGN prevents quiescent galaxies from gas cooling and star formation (Croton et al. 2006; Best et al. 2014; Man et al. 2016b; Barišić et al. 2017). The other, non-star forming radio galaxies have likely already entered this phase.
6. Conclusions
Our spectroscopic analysis of PKS 0529-549 has enabled us to obtain unprecedented constraints on the recent star-formation history and conditions of a massive, highly star-forming radio galaxy at z = 2.57. A plethora of absorption line features are detected in the deep X-shooter spectrum, including stellar photospheric and wind features indicative of OB-type stars, in additional to emission lines and low-ionization absorption lines that are commonly seen in high-redshift star-forming galaxies.
The most significantly detected photospheric features, Si IIλ1485 and S Vλ1502, are used to constrain the nature of the recent star formation of PKS 0529-549 through a comparison with Starburst99 model spectra. The star-formation history is inconsistent with a single burst or being continuous. Rather, more than one burst of star formation took place in the past ∼100 Myr: the most recent burst took place 4–7 Myr ago explaining the presence of O- and early B-type stars, and an older burst of at least 20 Myr ago is needed to explain the presence of late B-type stars. Evidence for the presence of stellar winds and weaker stellar absorption features in this spectrum corroborates these results. A short star-formation timescale is further supported by the super-solar metallicity and alpha-element enhancement, as indicated by the presence and strengths of metal photospheric lines such as S, Si, O and Fe.
The photospheric lines are narrow and perhaps appear to have more than one velocity component. Both of these properties are also seen in the ALMA [C I] emission line tracing the cold, star-forming gas. This indicates that the stars formed in knots or clumps confined to small physical regions, rather than dispersed throughout the host galaxy.
The detection of the ALMA [C I] emission line of PKS 0529-549 enables us to characterize the star-forming gas. We derive a molecular gas mass of MH2 = (3.9 ± 1.0)×1010 M⊙, which is only 12% of its stellar mass. The fraction of molecular-to-stellar mass is lower than galaxies at similar stellar mass and redshift. Combining the gas mass with its high star-formation rate of  yr−1, we estimate its star-formation efficiency to be (26 ± 8) Gyr−1, or equivalently a gas depletion time of tdepl = (38 ± 12) Myr. Its high star-formation efficiency is on par with the most efficiently star-forming galaxies at comparable mass and redshifts. The surface density of the star-formation rate is as high as the dense clumps within molecular clouds and starburst galaxies, significantly higher than that of disk galaxies. These observations lead us to attribute the efficient star formation to gas compression, which naturally explains the modest velocity dispersions (⩽55 km s−1 ) of the young stars and of the cold gas. Compressive gas flows can be triggered by radio jets and/or galaxy interaction.
The striking similarity between PKS 0529-549 and other starbursting radio galaxies (e.g., 4C 41.17, the Dragonfly and the Spiderweb) suggests that they may well represent a brief but not unique phase in the last active stage of massive galaxies. Highly efficient star formation and AGN act together to deplete the cold gas reservoir as well as disperse it, eventually quenching the star formation in these massive galaxies.
When comparing to SFR and M⋆ from literature data derived assuming the Salpeter (1955) IMF, we divide the masses by a factor of 1.5 to convert to Kroupa (2001) IMF following Madau & Dickinson (2014).
The spectra of nearby starbursting dwarf galaxies were retrieved from http://www.stsci.edu/science/starburst99/docs/templ.html.
We note, however, the challenge of determining velocity components based on photospheric lines alone, given that all the photospheric lines plotted in Fig. 5 could be multiplets based on atomic line calculations (Footnote 3). Without a reference high-resolution UV spectrum of a nearby galaxy or knowledge of their physical conditions, we are unable to distinguish between multiple velocity components or multiplets.
As the ADC in VLT/X-shooter was disabled during the observations, slit losses could potentially affect the observed continuum slope in the UVB and VIS arms despite observing close to the parallactic angle for all observations. Reassuringly, a comparison of our spectrum with a shallower, lower resolution NTT spectrum (Broderick et al. 2007) shows that the slopes are consistent and suggests that slit losses do not severely affect our measurement of the rest-frame UV continuum slope.
The depletion of cold (T ≲ 50 K), star-forming gas does not imply the lack of warm (T ∼ 104 K) gas. On the contrary, giant Lyα reservoir is a common feature of HzRGs including in PKS 0529-549 (Sect. 3.1).
Their MH2 have been adjusted to a Milky Way CO-to-H2 conversion factor to match the conversion factor of Tacconi et al. (2013).
Note that εff is not equivalent to SFE. The former is defined using the free-fall time of a cloud in simulations, while the latter is an observational definition based on the molecular H2 mass.
Acknowledgments
We wish to express our sincerest gratitude to the ESO data reduction pipeline developers, especially Andrea Modigliani and Sabine Moehler from the user support department for their considerable help with the data reduction. We thank Arjun Dey, Max Pettini, and Chuck Steidel for making their spectra available for comparison, and Guillaume Drouart for providing the NIR photometry of this source, and all for discussions during the early stages of this work. We thank the anonymous referee for helpful comments and criticisms that improved this study. AM expresses her appreciation for the helpful discussions on stellar atmospheres with Rolf-Peter Kudritzki and Joachim Puls and for the useful conversations on a wide range of topics with Federico Lelli, Johannes Zabl, Tina Peters, Sthabile Kowla, Zhi-Yu Zhang, Laura Zschaechner, James Matthews and Salvatore Cielo. Based on observations collected at the European Southern Observatory under ESO programme 092.B-0772(A). This paper makes use of data from ALMA program ADS/JAO.ALMA#2013.1.00521.S. ALMA is a partnership of ESO (representing its member states), NSF (USA) and NINS (Japan), together with NRC (Canada) and NSC and ASIAA (Taiwan) and KASI (Republic of Korea), in cooperation with the Republic of Chile. The Joint ALMA Observatory is operated by ESO, AUI/NRAO and NAOJ. The Dunlap Institute is funded through an endowment established by the David Dunlap family and the University of Toronto.
References
- Alaghband-Zadeh, S., Chapman, S. C., Swinbank, A. M., et al. 2013, MNRAS, 435, 1493 [Google Scholar]
- Arav, N., Becker, R. H., Laurent-Muehleisen, S. A., et al. 1999a, ApJ, 524, 566 [NASA ADS] [CrossRef] [Google Scholar]
- Arav, N., Korista, K. T., de Kool, M., Junkkarinen, V. T., & Begelman, M. C. 1999b, ApJ, 516, 27 [NASA ADS] [CrossRef] [Google Scholar]
- Barišić, I., van der Wel, A., Bezanson, R., et al. 2017, ApJ, 847, 72 [NASA ADS] [CrossRef] [Google Scholar]
- Barro, G., Kriek, M., Pérez-González, P. G., et al. 2017, ApJ, 851, L40 [NASA ADS] [CrossRef] [Google Scholar]
- Bayliss, M. B., Rigby, J. R., Sharon, K., et al. 2014, ApJ, 790, 144 [NASA ADS] [CrossRef] [Google Scholar]
- Best, P. N., Ker, L. M., Simpson, C., Rigby, E. E., & Sabater, J. 2014, MNRAS, 445, 955 [NASA ADS] [CrossRef] [Google Scholar]
- Bicknell, G. V., Sutherland, R. S., van Breugel, W. J. M., et al. 2000, ApJ, 540, 678 [NASA ADS] [CrossRef] [Google Scholar]
- Biernacki, P., & Teyssier, R. 2018, MNRAS, 475, 5688 [NASA ADS] [CrossRef] [Google Scholar]
- Bisbas, T. G., Papadopoulos, P. P., & Viti, S. 2015, ApJ, 803, 37 [NASA ADS] [CrossRef] [Google Scholar]
- Bisbas, T. G., van Dishoeck, E. F., Papadopoulos, P. P., et al. 2017, ApJ, 839, 90 [NASA ADS] [CrossRef] [Google Scholar]
- Boquien, M., Calzetti, D., Kennicutt, R., et al. 2009, ApJ, 706, 553 [NASA ADS] [CrossRef] [Google Scholar]
- Bothwell, M. S., Aguirre, J. E., Chapman, S. C., et al. 2013a, ApJ, 779, 67 [NASA ADS] [CrossRef] [Google Scholar]
- Bothwell, M. S., Smail, I., Chapman, S. C., et al. 2013b, MNRAS, 429, 3047 [NASA ADS] [CrossRef] [Google Scholar]
- Bothwell, M. S., Aguirre, J. E., Aravena, M., et al. 2017, MNRAS, 466, 2825 [Google Scholar]
- Bower, R. G., Schaye, J., Frenk, C. S., et al. 2017, MNRAS, 465, 32 [NASA ADS] [CrossRef] [Google Scholar]
- Brandt, J. C., Heap, S. R., Beaver, E. A., et al. 1994, PASP, 106, 890 [NASA ADS] [CrossRef] [Google Scholar]
- Broderick, J. W., De Breuck, C., Hunstead, R. W., & Seymour, N. 2007, MNRAS, 375, 1059 [NASA ADS] [CrossRef] [Google Scholar]
- Brusa, M., Feruglio, C., Cresci, G., et al. 2015, A&A, 578, A11 [NASA ADS] [CrossRef] [EDP Sciences] [Google Scholar]
- Cabanac, R. A., Valls-Gabaud, D., & Lidman, C. 2008, MNRAS, 386, 2065 [NASA ADS] [CrossRef] [Google Scholar]
- Calzetti, D. 2001, PASP, 113, 1449 [NASA ADS] [CrossRef] [Google Scholar]
- Cardelli, J. A., Clayton, G. C., & Mathis, J. S. 1989, ApJ, 345, 245 [NASA ADS] [CrossRef] [Google Scholar]
- Carilli, C. L., Perley, R. A., Dreher, J. W., & Leahy, J. P. 1991, ApJ, 383, 554 [NASA ADS] [CrossRef] [Google Scholar]
- Casey, C. M., Scoville, N. Z., Sanders, D. B., et al. 2014, ApJ, 796, 95 [NASA ADS] [CrossRef] [Google Scholar]
- Cimatti, A., Zamorani, G., & Marano, B. 1993, MNRAS, 263, 236 [NASA ADS] [CrossRef] [Google Scholar]
- Cimatti, A., Dey, A., van Breugel, W., Hurt, T., & Antonucci, R. 1997, ApJ, 476, 677 [NASA ADS] [CrossRef] [Google Scholar]
- Cimatti, A., di Serego Alighieri, S., Vernet, J., Cohen, M. H., & Fosbury, R. A. E. 1998, ApJ, 499, L21 [NASA ADS] [CrossRef] [Google Scholar]
- Conti, P. S. 1991, ApJ, 377, 115 [NASA ADS] [CrossRef] [Google Scholar]
- Conti, P. S., Leitherer, C., & Vacca, W. D. 1996, ApJ, 461, L87 [NASA ADS] [CrossRef] [Google Scholar]
- Croft, S., van Breugel, W., de Vries, W., et al. 2006, ApJ, 647, 1040 [NASA ADS] [CrossRef] [Google Scholar]
- Croton, D. J., Springel, V., White, S. D. M., et al. 2006, MNRAS, 365, 11 [NASA ADS] [CrossRef] [Google Scholar]
- Croton, D. J., Stevens, A. R. H., Tonini, C., et al. 2016, ApJS, 222, 22 [NASA ADS] [CrossRef] [Google Scholar]
- Daddi, E., Elbaz, D., Walter, F., et al. 2010, ApJ, 714, L118 [Google Scholar]
- Davidzon, I., Ilbert, O., Laigle, C., et al. 2017, A&A, 605, A70 [NASA ADS] [CrossRef] [EDP Sciences] [Google Scholar]
- De Breuck, C., van Breugel, W., Röttgering, H., et al. 2001, AJ, 121, 1241 [NASA ADS] [CrossRef] [Google Scholar]
- De Breuck, C., Downes, D., Neri, R., et al. 2005, A&A, 430, L1 [NASA ADS] [CrossRef] [EDP Sciences] [Google Scholar]
- De Breuck, C., Seymour, N., Stern, D., et al. 2010, ApJ, 725, 36 [NASA ADS] [CrossRef] [Google Scholar]
- de Mello, D. F., Leitherer, C., & Heckman, T. M. 2000, ApJ, 530, 251 [NASA ADS] [CrossRef] [Google Scholar]
- Dessauges-Zavadsky, M., D’Odorico, S., Schaerer, D., et al. 2010, A&A, 510, A26 [NASA ADS] [CrossRef] [EDP Sciences] [Google Scholar]
- Dessauges-Zavadsky, M., Zamojski, M., Schaerer, D., et al. 2015, A&A, 577, A50 [NASA ADS] [CrossRef] [EDP Sciences] [Google Scholar]
- Dey, A. 1999, in The Most Distant Radio Galaxies, eds. H. J. A. Röttgering, P. N. Best, & M. D. Lehnert, 19 [Google Scholar]
- Dey, A., Cimatti, A., van Breugel, W., Antonucci, R., & Spinrad, H. 1996, ApJ, 465, 157 [NASA ADS] [CrossRef] [Google Scholar]
- Dey, A., van Breugel, W., Vacca, W. D., & Antonucci, R. 1997, ApJ, 490, 698 [NASA ADS] [CrossRef] [Google Scholar]
- Di Matteo, T., Springel, V., & Hernquist, L. 2005, Nature, 433, 604 [NASA ADS] [CrossRef] [PubMed] [Google Scholar]
- Drouart, G., De Breuck, C., Vernet, J., et al. 2012, A&A, 548, A45 [NASA ADS] [CrossRef] [EDP Sciences] [Google Scholar]
- Drouart, G., Rocca-Volmerange, B., De Breuck, C., et al. 2016, A&A, 593, A109 [NASA ADS] [CrossRef] [EDP Sciences] [Google Scholar]
- Dubois, Y., Devriendt, J., Slyz, A., & Teyssier, R. 2012, MNRAS, 420, 2662 [NASA ADS] [CrossRef] [Google Scholar]
- Dubois, Y., Volonteri, M., Silk, J., et al. 2015, MNRAS, 452, 1502 [NASA ADS] [CrossRef] [Google Scholar]
- Dugan, Z., Bryan, S., Gaibler, V., Silk, J., & Haas, M. 2014, ApJ, 796, 113 [NASA ADS] [CrossRef] [Google Scholar]
- Ekström, S., Georgy, C., Eggenberger, P., et al. 2012, A&A, 537, A146 [NASA ADS] [CrossRef] [EDP Sciences] [Google Scholar]
- Elbaz, D., Leiton, R., Nagar, N., et al. 2018, A&A, 616, A110 [NASA ADS] [CrossRef] [EDP Sciences] [Google Scholar]
- Elmegreen, B. G. 2018, ApJ, 854, 16 [NASA ADS] [CrossRef] [Google Scholar]
- Elvis, M. 2000, ApJ, 545, 63 [NASA ADS] [CrossRef] [Google Scholar]
- Emonts, B. H. C., Norris, R. P., Feain, I., et al. 2014, MNRAS, 438, 2898 [NASA ADS] [CrossRef] [Google Scholar]
- Emonts, B. H. C., Mao, M. Y., Stroe, A., et al. 2015a, MNRAS, 451, 1025 [CrossRef] [Google Scholar]
- Emonts, B. H. C., De Breuck, C., Lehnert, M. D., et al. 2015b, A&A, 584, A99 [NASA ADS] [CrossRef] [EDP Sciences] [Google Scholar]
- Falkendal, T., De Breuck, C., Lehnert, M. D., et al. 2019, A&A, 621, A27 [NASA ADS] [CrossRef] [EDP Sciences] [Google Scholar]
- Ferland, G. J. 1981, ApJ, 249, 17 [NASA ADS] [CrossRef] [Google Scholar]
- Finley, H., Bouché, N., Contini, T., et al. 2017, A&A, 608, A7 [NASA ADS] [CrossRef] [EDP Sciences] [Google Scholar]
- Fiore, F., Feruglio, C., Shankar, F., et al. 2017, A&A, 601, A143 [NASA ADS] [CrossRef] [EDP Sciences] [Google Scholar]
- Fox, A. J., Ledoux, C., Vreeswijk, P. M., Smette, A., & Jaunsen, A. O. 2008, A&A, 491, 189 [NASA ADS] [CrossRef] [EDP Sciences] [Google Scholar]
- Fragile, P. C., Murray, S. D., Anninos, P., & van Breugel, W. 2004, ApJ, 604, 74 [NASA ADS] [CrossRef] [Google Scholar]
- Fragile, P. C., Anninos, P., Croft, S., Lacy, M., & Witry, J. W. L. 2017, ApJ, 850, 171 [NASA ADS] [CrossRef] [Google Scholar]
- Freudling, W., Romaniello, M., Bramich, D. M., et al. 2013, A&A, 559, A96 [NASA ADS] [CrossRef] [EDP Sciences] [Google Scholar]
- Gaibler, V., Khochfar, S., Krause, M., & Silk, J. 2012, MNRAS, 425, 438 [NASA ADS] [CrossRef] [Google Scholar]
- Genzel, R., Tacconi, L. J., Gracia-Carpio, J., et al. 2010, MNRAS, 407, 2091 [NASA ADS] [CrossRef] [Google Scholar]
- Glover, S. C. O., & Clark, P. C. 2016, MNRAS, 456, 3596 [NASA ADS] [CrossRef] [Google Scholar]
- Glover, S. C. O., Clark, P. C., Micic, M., & Molina, F. 2015, MNRAS, 448, 1607 [NASA ADS] [CrossRef] [Google Scholar]
- Gray, D. F. 2008, The Observation and Analysis of Stellar Photospheres (Cambridge, UK: Cambridge University Press) [Google Scholar]
- Greggio, L., & Renzini, A. 1983, A&A, 118, 217 [NASA ADS] [Google Scholar]
- Greve, T. R., Ivison, R. J., & Papadopoulos, P. P. 2004, A&A, 419, 99 [NASA ADS] [CrossRef] [EDP Sciences] [Google Scholar]
- Guillard, P., Boulanger, F., Lehnert, M. D., et al. 2015, A&A, 574, A32 [NASA ADS] [CrossRef] [EDP Sciences] [Google Scholar]
- Gullberg, B., De Breuck, C., Lehnert, M. D., et al. 2016a, A&A, 586, A124 [NASA ADS] [CrossRef] [EDP Sciences] [Google Scholar]
- Gullberg, B., Lehnert, M. D., De Breuck, C., et al. 2016b, A&A, 591, A73 [NASA ADS] [CrossRef] [EDP Sciences] [Google Scholar]
- Harrison, C. M. 2017, Nat. Astron., 1, 0165 [NASA ADS] [CrossRef] [Google Scholar]
- Hatch, N. A., Overzier, R. A., Kurk, J. D., et al. 2009, MNRAS, 395, 114 [NASA ADS] [CrossRef] [Google Scholar]
- Hayashi, M., Tadaki, K.-I., Kodama, T., et al. 2018, ApJ, 856, 118 [NASA ADS] [CrossRef] [Google Scholar]
- Hayward, C. C., Lanz, L., Ashby, M. L. N., et al. 2014, MNRAS, 445, 1598 [NASA ADS] [CrossRef] [Google Scholar]
- Heckman, T. M., & Leitherer, C. 1997, AJ, 114, 69 [NASA ADS] [CrossRef] [Google Scholar]
- Heckman, T. M., Dahlem, M., Lehnert, M. D., et al. 1995, ApJ, 448, 98 [NASA ADS] [CrossRef] [Google Scholar]
- Heiderman, A., Evans, II., N. J., Allen, L. E., Huard, T., & Heyer, M. 2010, ApJ, 723, 1019 [NASA ADS] [CrossRef] [Google Scholar]
- Higginbottom, N., Knigge, C., Long, K. S., Sim, S. A., & Matthews, J. H. 2013, MNRAS, 436, 1390 [NASA ADS] [CrossRef] [Google Scholar]
- Hopkins, P. F., Hernquist, L., Cox, T. J., et al. 2006, ApJS, 163, 1 [Google Scholar]
- Humphrey, A., Villar-Martín, M., Vernet, J., et al. 2008, MNRAS, 383, 11 [NASA ADS] [CrossRef] [Google Scholar]
- Ishibashi, W., & Fabian, A. C. 2012, MNRAS, 427, 2998 [NASA ADS] [CrossRef] [Google Scholar]
- Ivison, R. J., Papadopoulos, P. P., Smail, I., et al. 2011, MNRAS, 412, 1913 [NASA ADS] [CrossRef] [Google Scholar]
- Ivison, R. J., Smail, I., Amblard, A., et al. 2012, MNRAS, 425, 1320 [NASA ADS] [CrossRef] [Google Scholar]
- Ivison, R. J., Swinbank, A. M., Smail, I., et al. 2013, ApJ, 772, 137 [NASA ADS] [CrossRef] [Google Scholar]
- Kakkad, D., Mainieri, V., Brusa, M., et al. 2017, MNRAS, 468, 4205 [NASA ADS] [CrossRef] [Google Scholar]
- Keenan, F. P., Feibelman, W. A., & Berrington, K. A. 1992, ApJ, 389, 443 [NASA ADS] [CrossRef] [Google Scholar]
- Kennicutt, Jr., R. C. 1998a, ARA&A, 36, 189 [Google Scholar]
- Kennicutt, Jr., R. C. 1998b, ApJ, 498, 541 [NASA ADS] [CrossRef] [Google Scholar]
- Kennicutt, R. C., & Evans, N. J. 2012, ARA&A, 50, 531 [NASA ADS] [CrossRef] [Google Scholar]
- Kinney, A. L., Bohlin, R. C., Calzetti, D., Panagia, N., & Wyse, R. F. G. 1993, ApJS, 86, 5 [CrossRef] [Google Scholar]
- Kong, X., Charlot, S., Brinchmann, J., & Fall, S. M. 2004, MNRAS, 349, 769 [NASA ADS] [CrossRef] [Google Scholar]
- Kroupa, P. 2001, MNRAS, 322, 231 [NASA ADS] [CrossRef] [Google Scholar]
- Lehnert, M. D., & Heckman, T. M. 1996, ApJ, 462, 651 [NASA ADS] [CrossRef] [Google Scholar]
- Lehnert, M. D., Heckman, T. M., & Weaver, K. A. 1999, ApJ, 523, 575 [NASA ADS] [CrossRef] [Google Scholar]
- Lehnert, M. D., Nesvadba, N. P. H., Le Tiran, L., et al. 2009, ApJ, 699, 1660 [NASA ADS] [CrossRef] [Google Scholar]
- Lehnert, M. D., Le Tiran, L., Nesvadba, N. P. H., et al. 2013, A&A, 555, A72 [NASA ADS] [CrossRef] [EDP Sciences] [Google Scholar]
- Leitherer, C., Vacca, W. D., Conti, P. S., et al. 1996, ApJ, 465, 717 [NASA ADS] [CrossRef] [Google Scholar]
- Leitherer, C., Schaerer, D., Goldader, J. D., et al. 1999, ApJS, 123, 3 [NASA ADS] [CrossRef] [Google Scholar]
- Leitherer, C., Leão, J. R. S., Heckman, T. M., et al. 2001, ApJ, 550, 724 [NASA ADS] [CrossRef] [Google Scholar]
- Leitherer, C., Tremonti, C. A., Heckman, T. M., & Calzetti, D. 2011, AJ, 141, 37 [Google Scholar]
- Leitherer, C., Ekström, S., Meynet, G., et al. 2014, ApJS, 212, 14 [NASA ADS] [CrossRef] [Google Scholar]
- Lelli, F., De Breuck, C., Falkendal, T., et al. 2018, MNRAS, 479, 5440 [NASA ADS] [CrossRef] [Google Scholar]
- Leroy, A. K., Walter, F., Brinks, E., et al. 2008, AJ, 136, 2782 [NASA ADS] [CrossRef] [Google Scholar]
- Leroy, A. K., Walter, F., Sandstrom, K., et al. 2013, AJ, 146, 19 [NASA ADS] [CrossRef] [Google Scholar]
- Madau, P., & Dickinson, M. 2014, ARA&A, 52, 415 [NASA ADS] [CrossRef] [Google Scholar]
- Man, A. W. S., Zirm, A. W., & Toft, S. 2016a, ApJ, 830, 89 [NASA ADS] [CrossRef] [Google Scholar]
- Man, A. W. S., Greve, T. R., Toft, S., et al. 2016b, ApJ, 820, 11 [NASA ADS] [CrossRef] [Google Scholar]
- Maraston, C., Nieves Colmenárez, L., Bender, R., & Thomas, D. 2009, A&A, 493, 425 [NASA ADS] [CrossRef] [EDP Sciences] [Google Scholar]
- Matthews, J. H., Knigge, C., Long, K. S., et al. 2016, MNRAS, 458, 293 [NASA ADS] [CrossRef] [Google Scholar]
- McMullin, J. P., Waters, B., Schiebel, D., Young, W., & Golap, K. 2007, ASP Conf. Ser., 376, 127 [Google Scholar]
- Melnick, J., Moles, M., Terlevich, R., & Garcia-Pelayo, J.-M. 1987, MNRAS, 226, 849 [NASA ADS] [CrossRef] [Google Scholar]
- Meurer, G. R., Heckman, T. M., & Calzetti, D. 1999, ApJ, 521, 64 [NASA ADS] [CrossRef] [Google Scholar]
- Miley, G., & De Breuck, C. 2008, A&ARv, 15, 67 [NASA ADS] [CrossRef] [Google Scholar]
- Miley, G. K., Chambers, K. C., van Breugel, W. J. M., & Macchetto, F. 1992, ApJ, 401, L69 [NASA ADS] [CrossRef] [Google Scholar]
- Modigliani, A., Goldoni, P., & Royer, F. 2010, Proc. SPIE, 7737, 773728 [Google Scholar]
- Morton, D. C. 2003, ApJS, 149, 205 [NASA ADS] [CrossRef] [MathSciNet] [Google Scholar]
- Nayyeri, H., Cooray, A., Jullo, E., et al. 2017, ApJ, 844, 82 [NASA ADS] [CrossRef] [Google Scholar]
- Nesvadba, N. P. H., Drouart, G., De Breuck, C., et al. 2017, A&A, 600, A121 [NASA ADS] [CrossRef] [EDP Sciences] [Google Scholar]
- Noble, A. G., McDonald, M., Muzzin, A., et al. 2017, ApJ, 842, L21 [Google Scholar]
- Nordon, R., Lutz, D., Saintonge, A., et al. 2013, ApJ, 762, 125 [NASA ADS] [CrossRef] [Google Scholar]
- Papadopoulos, P. P., & Greve, T. R. 2004, ApJ, 615, L29 [NASA ADS] [CrossRef] [Google Scholar]
- Papadopoulos, P. P., Thi, W.-F., & Viti, S. 2004, MNRAS, 351, 147 [NASA ADS] [CrossRef] [Google Scholar]
- Pettini, M., Steidel, C. C., Adelberger, K. L., Dickinson, M., & Giavalisco, M. 2000, ApJ, 528, 96 [NASA ADS] [CrossRef] [Google Scholar]
- Popping, G., Decarli, R., Man, A. W. S., et al. 2017a, A&A, 602, A11 [NASA ADS] [CrossRef] [EDP Sciences] [Google Scholar]
- Popping, G., Puglisi, A., & Norman, C. A. 2017b, MNRAS, 472, 2315 [NASA ADS] [CrossRef] [Google Scholar]
- Prinja, R. K., Barlow, M. J., & Howarth, I. D. 1990, ApJ, 361, 607 [NASA ADS] [CrossRef] [Google Scholar]
- Quider, A. M., Pettini, M., Shapley, A. E., & Steidel, C. C. 2009, MNRAS, 398, 1263 [NASA ADS] [CrossRef] [Google Scholar]
- Quider, A. M., Shapley, A. E., Pettini, M., Steidel, C. C., & Stark, D. P. 2010, MNRAS, 402, 1467 [NASA ADS] [CrossRef] [Google Scholar]
- Rejkuba, M., Minniti, D., Courbin, F., & Silva, D. R. 2002, ApJ, 564, 688 [NASA ADS] [CrossRef] [Google Scholar]
- Rigby, J. R., Bayliss, M. B., Chisholm, J., et al. 2018, ApJ, 853, 87 [NASA ADS] [CrossRef] [Google Scholar]
- Rix, S. A., Pettini, M., Leitherer, C., et al. 2004, ApJ, 615, 98 [NASA ADS] [CrossRef] [Google Scholar]
- Robert, C., Pellerin, A., Aloisi, A., et al. 2003, ApJS, 144, 21 [NASA ADS] [CrossRef] [Google Scholar]
- Roettgering, H. J. A., van Ojik, R., Miley, G. K., et al. 1997, A&A, 326, 505 [NASA ADS] [Google Scholar]
- Rosario, D. J., Trakhtenbrot, B., Lutz, D., et al. 2013, A&A, 560, A72 [NASA ADS] [CrossRef] [EDP Sciences] [Google Scholar]
- Rountree, J., & Sonneborn, G. 1993, NASA Ref. Publ., 1312 [Google Scholar]
- Russell, H. R., McDonald, M., McNamara, B. R., et al. 2017a, ApJ, 836, 130 [NASA ADS] [CrossRef] [Google Scholar]
- Russell, H. R., McNamara, B. R., Fabian, A. C., et al. 2017b, MNRAS, 472, 4024 [NASA ADS] [CrossRef] [Google Scholar]
- Salomé, Q., Salomé, P., & Combes, F. 2015, A&A, 574, A34 [NASA ADS] [CrossRef] [EDP Sciences] [Google Scholar]
- Salpeter, E. E. 1955, ApJ, 121, 161 [Google Scholar]
- Schawinski, K., Virani, S., Simmons, B., et al. 2009, ApJ, 692, L19 [NASA ADS] [CrossRef] [Google Scholar]
- Schlafly, E. F., & Finkbeiner, D. P. 2011, ApJ, 737, 103 [NASA ADS] [CrossRef] [Google Scholar]
- Semenov, V. A., Kravtsov, A. V., & Gnedin, N. Y. 2017, ApJ, 845, 133 [NASA ADS] [CrossRef] [Google Scholar]
- Semenov, V. A., Kravtsov, A. V., & Gnedin, N. Y. 2018, ApJ, 861, 4 [NASA ADS] [CrossRef] [Google Scholar]
- Shapley, A. E., Steidel, C. C., Pettini, M., & Adelberger, K. L. 2003, ApJ, 588, 65 [NASA ADS] [CrossRef] [Google Scholar]
- Sharon, C. E. 2013, PhD Thesis, Rutgers The State University of New Jersey - New Brunswick [Google Scholar]
- Sijacki, D., Vogelsberger, M., Genel, S., et al. 2015, MNRAS, 452, 575 [NASA ADS] [CrossRef] [Google Scholar]
- Silk, J. 2005, MNRAS, 364, 1337 [NASA ADS] [CrossRef] [Google Scholar]
- Silk, J. 2013, ApJ, 772, 112 [NASA ADS] [CrossRef] [Google Scholar]
- Silva, A., Marchesini, D., Silverman, J. D., et al. 2018, ApJ, 868, 46 [NASA ADS] [CrossRef] [Google Scholar]
- Slettebak, A. 1956, ApJ, 124, 173 [NASA ADS] [CrossRef] [Google Scholar]
- Smith, D. J. B., Simpson, C., Swinbank, A. M., Rawlings, S., & Jarvis, M. J. 2010, MNRAS, 404, 1089 [NASA ADS] [Google Scholar]
- Solomon, P. M., & Vanden Bout, P. A. 2005, ARA&A, 43, 677 [NASA ADS] [CrossRef] [Google Scholar]
- Spilker, J. S., Bezanson, R., Marrone, D. P., et al. 2016, ApJ, 832, 19 [NASA ADS] [CrossRef] [Google Scholar]
- Springel, V., Di Matteo, T., & Hernquist, L. 2005, ApJ, 620, L79 [NASA ADS] [CrossRef] [Google Scholar]
- Stanley, F., Harrison, C. M., Alexander, D. M., et al. 2015, MNRAS, 453, 591 [NASA ADS] [CrossRef] [Google Scholar]
- Steidel, C. C., Strom, A. L., Pettini, M., et al. 2016, ApJ, 826, 159 [NASA ADS] [CrossRef] [Google Scholar]
- Steinbring, E. 2014, AJ, 148, 10 [NASA ADS] [CrossRef] [Google Scholar]
- Stoeckley, T. R. 1968, MNRAS, 140, 141 [NASA ADS] [Google Scholar]
- Tacconi, L. J., Neri, R., Genzel, R., et al. 2013, ApJ, 768, 74 [Google Scholar]
- Tadaki, K.-I., Kohno, K., Kodama, T., et al. 2015, ApJ, 811, L3 [NASA ADS] [CrossRef] [Google Scholar]
- Tadaki, K.-I., Kodama, T., Nelson, E. J., et al. 2017, ApJ, 841, L25 [NASA ADS] [CrossRef] [Google Scholar]
- Thomas, D., Greggio, L., & Bender, R. 1999, MNRAS, 302, 537 [NASA ADS] [CrossRef] [Google Scholar]
- Thomas, D., Maraston, C., Bender, R., & de Mens Oliveira, C. 2005, ApJ, 621, 673 [NASA ADS] [CrossRef] [Google Scholar]
- Tinsley, B. M. 1979, ApJ, 229, 1046 [NASA ADS] [CrossRef] [Google Scholar]
- Toft, S., Gallazzi, A., Zirm, A., et al. 2012, ApJ, 754, 3 [NASA ADS] [CrossRef] [Google Scholar]
- Tremonti, C. A., Heckman, T. M., Kauffmann, G., et al. 2004, ApJ, 613, 898 [NASA ADS] [CrossRef] [Google Scholar]
- Usero, A., Leroy, A. K., Walter, F., et al. 2015, AJ, 150, 115 [NASA ADS] [CrossRef] [Google Scholar]
- van Breugel, W., Filippenko, A. V., Heckman, T., & Miley, G. 1985, ApJ, 293, 83 [NASA ADS] [CrossRef] [Google Scholar]
- Vernet, J., Fosbury, R. A. E., Villar-Martín, M., et al. 2001, A&A, 366, 7 [NASA ADS] [CrossRef] [EDP Sciences] [Google Scholar]
- Vernet, J., Dekker, H., D’Odorico, S., et al. 2011, A&A, 536, A105 [NASA ADS] [CrossRef] [EDP Sciences] [Google Scholar]
- Volonteri, M., Capelo, P. R., Netzer, H., et al. 2015a, MNRAS, 452, L6 [NASA ADS] [CrossRef] [Google Scholar]
- Volonteri, M., Capelo, P. R., Netzer, H., et al. 2015b, MNRAS, 449, 1470 [NASA ADS] [CrossRef] [Google Scholar]
- Wagg, J., Wilner, D. J., Neri, R., Downes, D., & Wiklind, T. 2006, ApJ, 651, 46 [NASA ADS] [CrossRef] [Google Scholar]
- Wagner, A. Y., Bicknell, G. V., & Umemura, M. 2012, ApJ, 757, 136 [NASA ADS] [CrossRef] [Google Scholar]
- Walborn, N. R., Nichols-Bohlin, J., & Panek, R. J. 1985, NASA Ref. Publ., 1155 [Google Scholar]
- Walborn, N. R., Lennon, D. J., Haser, S. M., Kudritzki, R.-P., & Voels, S. A. 1995a, PASP, 107, 104 [NASA ADS] [CrossRef] [Google Scholar]
- Walborn, N. R., Parker, J. W., & Nichols, J. S. 1995b, NASA Ref. Publ., 1363 [Google Scholar]
- Walter, F., Weiß, A., Downes, D., Decarli, R., & Henkel, C. 2011, ApJ, 730, 18 [NASA ADS] [CrossRef] [Google Scholar]
- Weiß, A., Henkel, C., Downes, D., & Walter, F. 2003, A&A, 409, L41 [NASA ADS] [CrossRef] [EDP Sciences] [Google Scholar]
- Wild, V., Charlot, S., Brinchmann, J., et al. 2011, MNRAS, 417, 1760 [NASA ADS] [CrossRef] [Google Scholar]
- Willis, A. J. 1982, MNRAS, 198, 897 [NASA ADS] [CrossRef] [Google Scholar]
- Wu, J., Evans, II., N. J., Shirley, Y. L., & Knez, C. 2010, ApJS, 188, 313 [NASA ADS] [CrossRef] [Google Scholar]
- Zirm, A. W., Overzier, R. A., Miley, G. K., et al. 2005, ApJ, 630, 68 [NASA ADS] [CrossRef] [Google Scholar]
- Zubovas, K., Nayakshin, S., King, A., & Wilkinson, M. 2013a, MNRAS, 433, 3079 [NASA ADS] [CrossRef] [Google Scholar]
- Zubovas, K., Nayakshin, S., Sazonov, S., & Sunyaev, R. 2013b, MNRAS, 431, 793 [NASA ADS] [CrossRef] [Google Scholar]
Appendix A: Additional materials
Redshift measurements of PKS 0529-549 based on the strongest emission lines detected in the X-shooter spectrum.
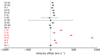 |
Fig. A.1. Velocity offsets of emission lines in Table A.1 with respect to zsys = 2.5725 defined by the He II broad emission line. The resonant doublets (in red) are affected by blueshifted absorption from the stellar winds in addition to the emission, explaining their redshifted velocities. |
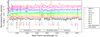 |
Fig. A.2. Rest-frame UV spectra of various types of O- and B-stars (Walborn et al. 1985, 1995b) drawn from the International Ultraviolet Explorer (IUE) Atlas (http://vizier.u-strasbg.fr) and that of PKS 0529-549. At the top, we show the spectrum of a strong N-line Wolf–Rayet star, WN7-A, and as one moves down the plot, the stellar spectra are of stars of progressively later types from O3 main sequence stars to a B3 main sequence star (the specific types are indicated in the legend on the right). For easier visualization, the stellar spectra have been smoothed by a Gaussian kernel and shifted upwards in increments of 0.5. |
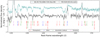 |
Fig. A.3. Rest-frame UV spectrum of PKS 0529-549 (this work) and TXS J1908+7220, a radio galaxy at z = 3.5356 with broad absorption lines (Dey 1999; De Breuck et al. 2001). The characteristics of the broad absorption lines in TXS J1908+7220 are generally consistent with those of BAL quasars. The spectrum of TXS J1908+7220 has been shifted upward by 1.3 for easier visualization. |
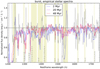 |
Fig. A.4. The UV spectrum of a stellar population that experienced a single burst as it ages (Leitherer et al. 1999), compared with the observed spectrum of PKS 0529-549 (grey line; this work) over the spectral region, 1200–1750 Å. We highlight in yellow the spectral regions of containing possible photospheric signatures of young stars and stellar wind features. The times since the initial burst of individual spectral models are indicated in the legend on the top. The spectrum is normalized to the continuum and heavily smoothed for easier visualization. |
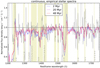 |
Fig. A.5. Same as Fig. A.4, but for continuous star formation at a constant rate as a function of age. |
All Tables
Terminal velocities of resonant line absorptions estimated from their blue intercepts with the continuum, λedge quoted in the rest-frame.
Best-fitting parameters to the [C I] 3P2−3P1 emission line as measured from the ALMA spectrum of PKS 0529-549.
Redshift measurements of PKS 0529-549 based on the strongest emission lines detected in the X-shooter spectrum.
All Figures
|
Fig. 1. The X-shooter slit shown as black lines superposed on the greyscale rendition of the ALMA Band 6 continuum image. The displayed image is |
| In the text | |
|
Fig. 2. Rest-frame continuum-normalized UV spectra of PKS 0529-549 (black; this work) and 4C 41.17 (green; Dey et al. 1997). We indicate the wavelengths of the most prominent lines in the spectra annotated with the ion responsible. The colours represent the likely dominant origin of the lines: red for stellar photospheric, blue for resonant doublets from stellar winds and AGN, green for low-ionization lines in the interstellar medium, olive for their associated excited fine-structure emission, and purple for bright emission lines. The blue shades show the absorption wings of the resonant lines originating from stellar winds. The dotted lines indicate possible ISM absorption of Fe IIλλ2587,2600 and Mg IIλλ2796,2804 at z = 0.64 (grey), z = 0.94 (brown), and z = 1.28 (olive). For easier visualization, the spectrum of PKS 0529-549 has been binned by twice the FWHM (i.e., variance-weighted mean for every 18/21 pixels for the UVB/VIS arms, respectively). The spectrum of 4C 41.17 has been smoothed by a Gaussian kernel, and shifted upwards by 0.5. The grey shade shows the noise as propagated from the X-shooter pipeline without accounting for correlated noise. The spectrum of PKS 0529-549 has been shifted to vacuum wavelengths. The gap at ∼1550 − 1570 Å is the noisy region between the UVB and VIS arms of X-shooter. |
| In the text | |
|
Fig. 3. Comparison of Starburst99 model spectra (in blue; Leitherer et al. 1999) to the observed spectrum of PKS 0529-549 (in grey) over the spectral region, 1435–1540 Å. Model spectra of continuous star formation are compared with the spectrum of PKS 0529-549 on the left and models with a single burst of star formation are compared on the right. We highlight in yellow the spectral regions containing the two most significantly detected photospheric lines, Si IIλ1485 and S Vλ1502. The ages of individual spectral models are indicated in the lower left of each panel. The spectra have been normalized to the continuum. For visualization both the model and observed spectra have been smoothed to matching resolution. |
| In the text | |
|
Fig. 4. Comparison of the UV spectra of PKS 0529-549 (black; this work) to three nearby dwarf galaxies with recent star formation. NGC 4214-1 (green) and NGC 1741-B1 (blue) are both aged ∼4 − 5 Myr, while NGC 1705-1 (yellow) is slightly older with age ∼10 Myr (Conti et al. 1996; Leitherer et al. 1996; Heckman & Leitherer 1997; de Mello et al. 2000). Following the colour scheme of Fig. 2, we indicate the wavelengths of various lines in the spectra annotated with the ion responsible, and show the error spectrum as a grey shade. Note that the blue absorption edge of Si IV, seen in all galaxies plotted here except the most evolved NGC 1705, suggests the presence of a population of O-type supergiants that appear at 3–6 Myr after an instantaneous burst (Conti et al. 1996). The spectra have been continuum normalized to unity, and shifted upwards in increments of 0.6 for visualization. |
| In the text | |
|
Fig. 5. A comparison of the profiles of photospheric absorption lines (C IIIλ1247, O Vλ1371, Si IIλ1485, and S Vλ1502) to He IIλ1640 and [C I] (2–1) emission lines. PKS 0529-549 has an asymmetric He IIλ1640 emission line profile, consisting of two possible absorbers over a broad emission line and/or multiple narrower emission line components. This is in stark contrast with other high-redshift radio galaxies whose He II emission is dominated by broad emission. Note that the He II absorption at ∼300 km s−1 is affected by faint sky lines and thus is not considered to be a real feature here. The red and blue lines are the [C I] spectra extracted from two separate regions from the ALMA cube (Table 4). Note that the photospheric lines might consist of multiple velocity components corresponding to the He II emission or absorption lines, or they might be resolved into multiplets. The X-shooter spectrum has been normalized to its continuum, Gaussian smoothed, and arbitrarily shifted upwards for easier visualization. |
| In the text | |
|
Fig. 6. The integrated [C I] (2–1) spectrum of PKS 0529-549. The best-fitting model (solid purple) is superposed on the Band 6 ALMA spectrum (grey histogram). The individual components are plotted as dashed lines, including the two independent Gaussian components (blue and red) and the continuum (grey horizontal). |
| In the text | |
|
Fig. 7. Star-formation efficiency (SFE ≡ SFR/MH2) as a function of molecular gas fraction fgas ≡ MH2/(MH2 + M⋆) of PKS 0529-549 and other galaxies at z = 1.3−4.1. High-redshift radio galaxies are plotted as magenta circles, individually labeled as (1) PKS 0529-549, the subject of this work; (2) 4C 41.17; (3) MRC 0152-209, the Dragonfly; (4) MRC 1138-262, the Spiderweb; (5) 4C 60.07; and (6) MRC 0943-242. Submillimeter galaxies are plotted as pink squares. Star-forming galaxies are plotted as blue squares, with different shades referring to the respective samples. Compact star-forming galaxies are plotted as yellow diamonds. Cluster galaxies are plotted as green circles. Full references are provided in Sect. 5.1. The symbol size denotes the stellar mass of each galaxy split in three bins of M⋆ ⩾ 3 × 10¹¹ M⊙, 1−3 × 10¹¹ M⊙, and <1011 M⊙, where larger symbols represent more massive galaxies. The edge colours of each symbol indicate the MH2 tracer: black for [C I], grey for CO, and brown for dust continuum. The grey dashed lines mark the corner for the efficiently star-forming and gas-poor galaxies. |
| In the text | |
|
Fig. 8. The surface density of gas, Σgas, versus the surface density of the star-formation rate, ΣSFR (the “Schmidt–Kennicutt relation”; Kennicutt 1998b). We show the locations of three high-redshift radio galaxies: PKS 0529-549 (blue diamond; this work); 4C 41.17 (green circle), and MRC 0152-209 (magenta pentagon). The black squares denote the Galactic massive HCN clumps from Heiderman et al. (2010). The lines indicate the best-fit to the data presented in the respective works, including local star-forming galaxies and circum-nuclear starbursts (black; Kennicutt 1998b), gas-rich galaxies at z ∼ 1−3 (magenta; Genzel et al. 2010), and colour-selected star-forming galaxies at z ∼ 1.5 (green; Daddi et al. 2010). Solid and dashed lines refer to the best-fit for disk star-forming galaxies and mergers, respectively. |
| In the text | |
|
Fig. 9. An analytic model for the relation between the star-forming fraction of the total gas mass (fsf) and the gas depletion time (tdepl) reproduced from Semenov et al. (2018, Fig. 7). The grids show the predicted fsf and tdepl for various values of the star-formation efficiency per free-fall time (εff; how much of the gas is converted to stars on a cloud dynamical time), and the boost factor of momentum gain per supernova (b). We only show the b-values for the red grid lines. The key parameters of this model are the timescale for gas to become star-forming (τ+) and the timescale for the star-forming gas to be rendered non-star forming (τ−, d). The blue grid is for local disk galaxies with long τ+ (400 Myr) and the high ratio of τ+/τ−, d (5). The red grid shows the case where τ+ is short (10 Myr) and τ+/τ−, d is low (0.1). It is apparent that local disk galaxy models are inconsistent with the short tdepl (⩽100 Myr) observed in the three high redshift radio galaxies including PKS 0529-549. Gas compression can shorten tdepl by reducing τ+ (therefore low τ+/τ−, d), resulting in high fsf, i.e., high dense molecular gas fraction. |
| In the text | |
|
Fig. A.1. Velocity offsets of emission lines in Table A.1 with respect to zsys = 2.5725 defined by the He II broad emission line. The resonant doublets (in red) are affected by blueshifted absorption from the stellar winds in addition to the emission, explaining their redshifted velocities. |
| In the text | |
|
Fig. A.2. Rest-frame UV spectra of various types of O- and B-stars (Walborn et al. 1985, 1995b) drawn from the International Ultraviolet Explorer (IUE) Atlas (http://vizier.u-strasbg.fr) and that of PKS 0529-549. At the top, we show the spectrum of a strong N-line Wolf–Rayet star, WN7-A, and as one moves down the plot, the stellar spectra are of stars of progressively later types from O3 main sequence stars to a B3 main sequence star (the specific types are indicated in the legend on the right). For easier visualization, the stellar spectra have been smoothed by a Gaussian kernel and shifted upwards in increments of 0.5. |
| In the text | |
|
Fig. A.3. Rest-frame UV spectrum of PKS 0529-549 (this work) and TXS J1908+7220, a radio galaxy at z = 3.5356 with broad absorption lines (Dey 1999; De Breuck et al. 2001). The characteristics of the broad absorption lines in TXS J1908+7220 are generally consistent with those of BAL quasars. The spectrum of TXS J1908+7220 has been shifted upward by 1.3 for easier visualization. |
| In the text | |
|
Fig. A.4. The UV spectrum of a stellar population that experienced a single burst as it ages (Leitherer et al. 1999), compared with the observed spectrum of PKS 0529-549 (grey line; this work) over the spectral region, 1200–1750 Å. We highlight in yellow the spectral regions of containing possible photospheric signatures of young stars and stellar wind features. The times since the initial burst of individual spectral models are indicated in the legend on the top. The spectrum is normalized to the continuum and heavily smoothed for easier visualization. |
| In the text | |
|
Fig. A.5. Same as Fig. A.4, but for continuous star formation at a constant rate as a function of age. |
| In the text | |
Current usage metrics show cumulative count of Article Views (full-text article views including HTML views, PDF and ePub downloads, according to the available data) and Abstracts Views on Vision4Press platform.
Data correspond to usage on the plateform after 2015. The current usage metrics is available 48-96 hours after online publication and is updated daily on week days.
Initial download of the metrics may take a while.