Fig. A.4.
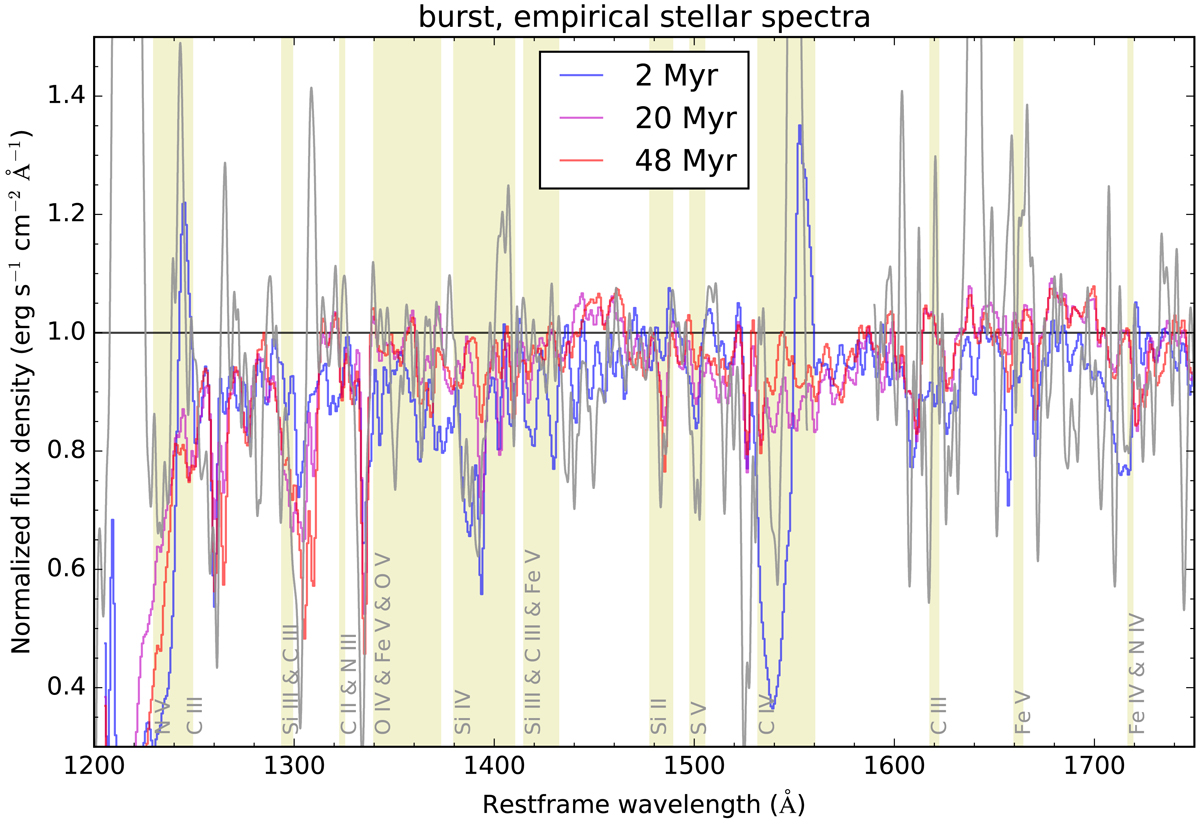
The UV spectrum of a stellar population that experienced a single burst as it ages (Leitherer et al. 1999), compared with the observed spectrum of PKS 0529-549 (grey line; this work) over the spectral region, 1200–1750 Å. We highlight in yellow the spectral regions of containing possible photospheric signatures of young stars and stellar wind features. The times since the initial burst of individual spectral models are indicated in the legend on the top. The spectrum is normalized to the continuum and heavily smoothed for easier visualization.
Current usage metrics show cumulative count of Article Views (full-text article views including HTML views, PDF and ePub downloads, according to the available data) and Abstracts Views on Vision4Press platform.
Data correspond to usage on the plateform after 2015. The current usage metrics is available 48-96 hours after online publication and is updated daily on week days.
Initial download of the metrics may take a while.