Fig. 3.
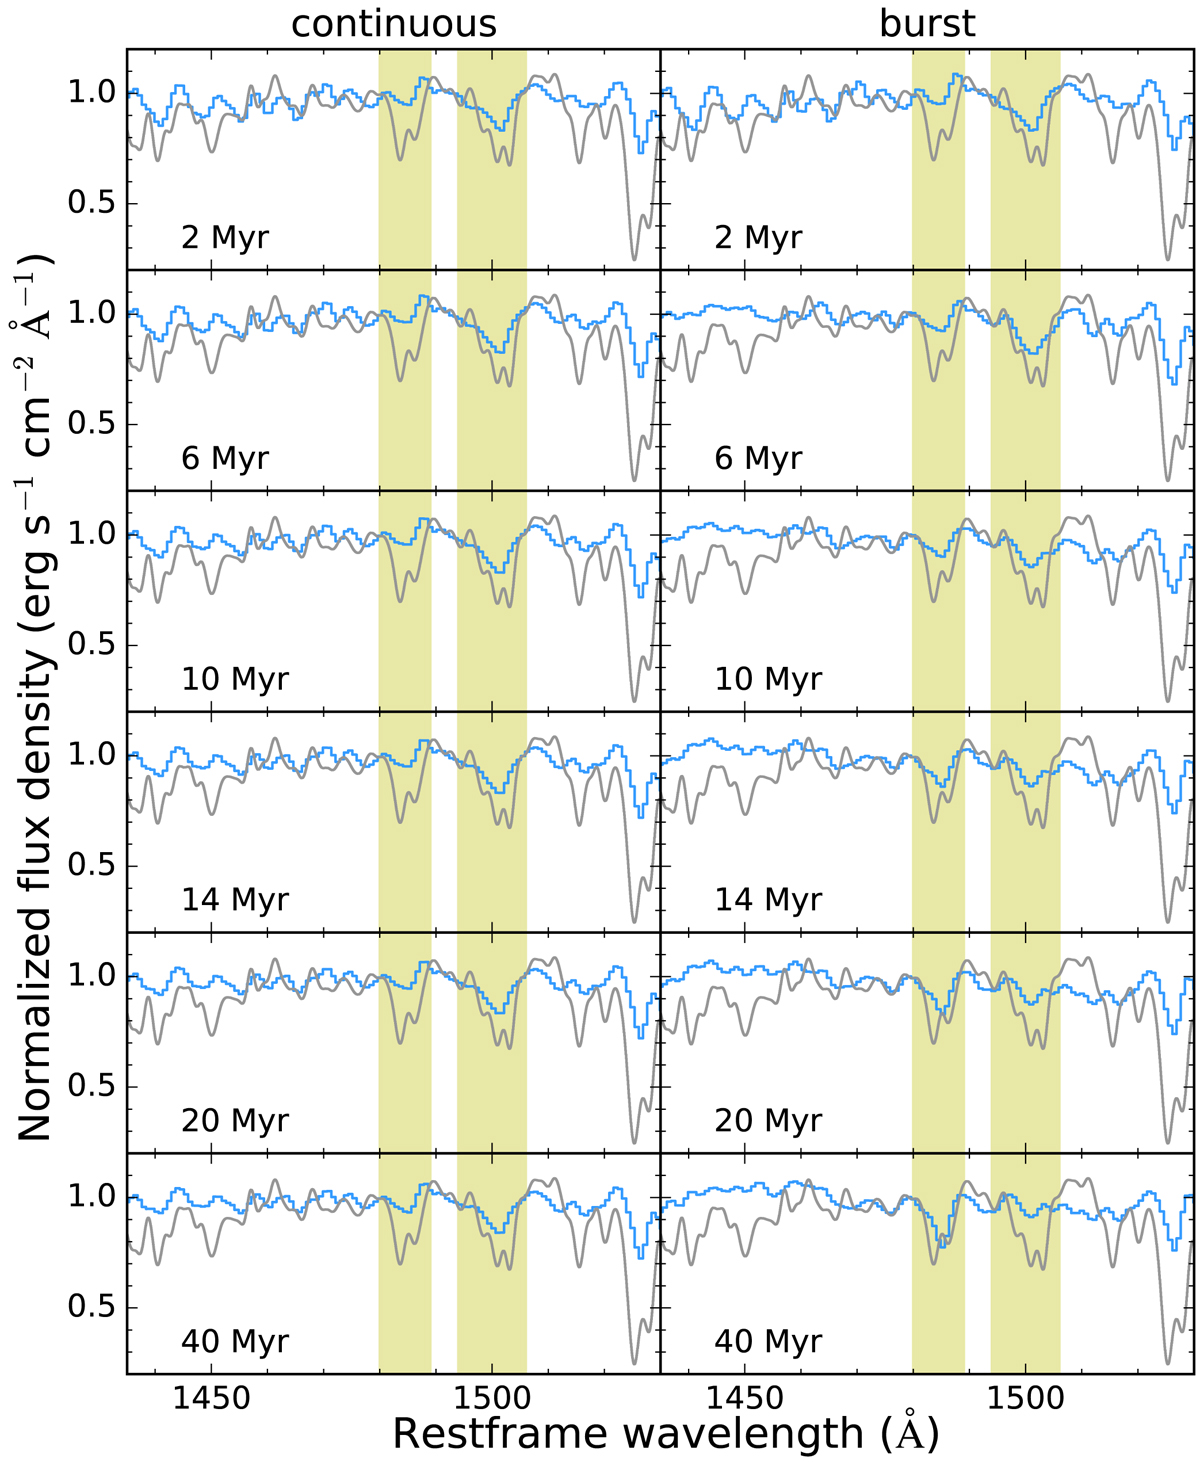
Comparison of Starburst99 model spectra (in blue; Leitherer et al. 1999) to the observed spectrum of PKS 0529-549 (in grey) over the spectral region, 1435–1540 Å. Model spectra of continuous star formation are compared with the spectrum of PKS 0529-549 on the left and models with a single burst of star formation are compared on the right. We highlight in yellow the spectral regions containing the two most significantly detected photospheric lines, Si IIλ1485 and S Vλ1502. The ages of individual spectral models are indicated in the lower left of each panel. The spectra have been normalized to the continuum. For visualization both the model and observed spectra have been smoothed to matching resolution.
Current usage metrics show cumulative count of Article Views (full-text article views including HTML views, PDF and ePub downloads, according to the available data) and Abstracts Views on Vision4Press platform.
Data correspond to usage on the plateform after 2015. The current usage metrics is available 48-96 hours after online publication and is updated daily on week days.
Initial download of the metrics may take a while.