Free Access
Fig. 6.
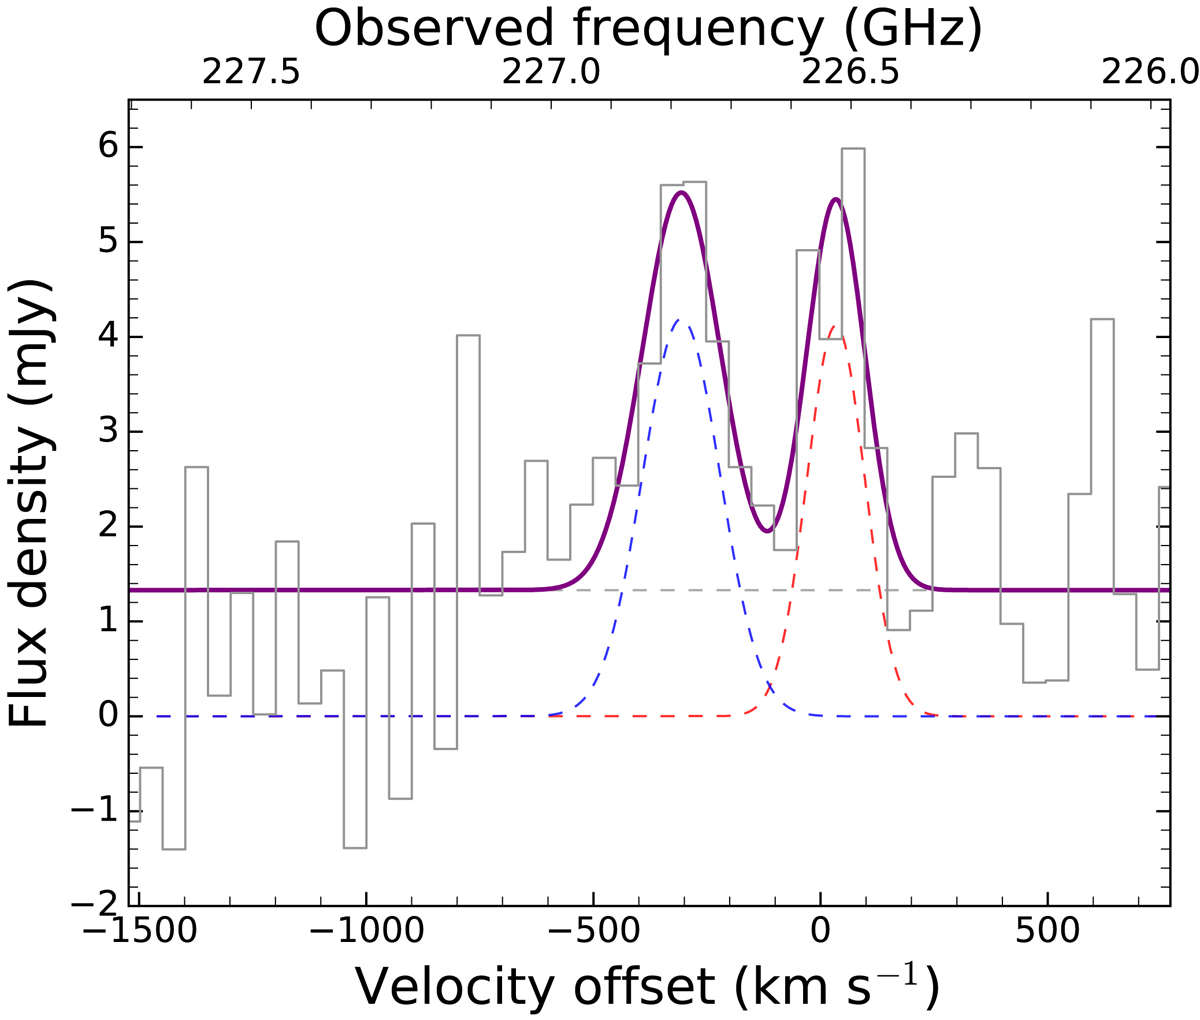
The integrated [C I] (2–1) spectrum of PKS 0529-549. The best-fitting model (solid purple) is superposed on the Band 6 ALMA spectrum (grey histogram). The individual components are plotted as dashed lines, including the two independent Gaussian components (blue and red) and the continuum (grey horizontal).
Current usage metrics show cumulative count of Article Views (full-text article views including HTML views, PDF and ePub downloads, according to the available data) and Abstracts Views on Vision4Press platform.
Data correspond to usage on the plateform after 2015. The current usage metrics is available 48-96 hours after online publication and is updated daily on week days.
Initial download of the metrics may take a while.