Fig. 9.
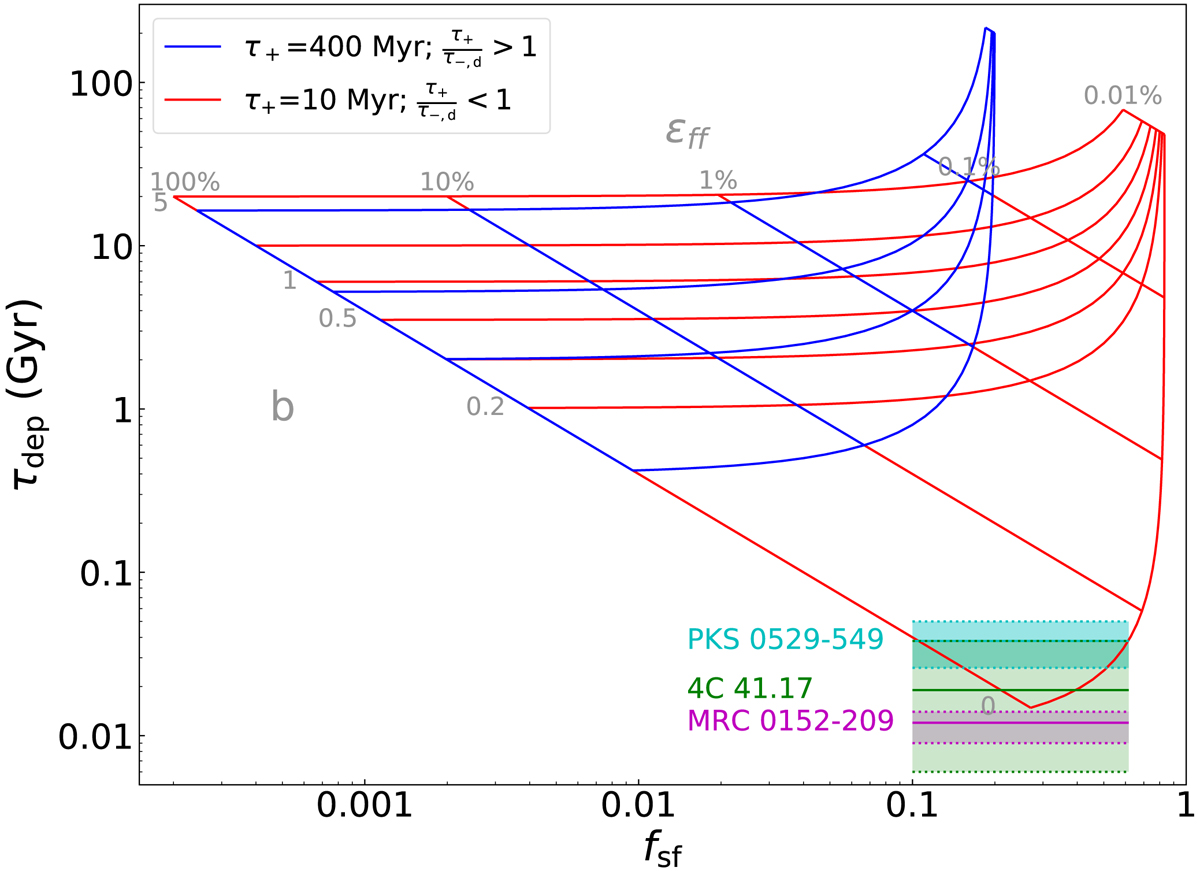
An analytic model for the relation between the star-forming fraction of the total gas mass (fsf) and the gas depletion time (tdepl) reproduced from Semenov et al. (2018, Fig. 7). The grids show the predicted fsf and tdepl for various values of the star-formation efficiency per free-fall time (εff; how much of the gas is converted to stars on a cloud dynamical time), and the boost factor of momentum gain per supernova (b). We only show the b-values for the red grid lines. The key parameters of this model are the timescale for gas to become star-forming (τ+) and the timescale for the star-forming gas to be rendered non-star forming (τ−, d). The blue grid is for local disk galaxies with long τ+ (400 Myr) and the high ratio of τ+/τ−, d (5). The red grid shows the case where τ+ is short (10 Myr) and τ+/τ−, d is low (0.1). It is apparent that local disk galaxy models are inconsistent with the short tdepl (⩽100 Myr) observed in the three high redshift radio galaxies including PKS 0529-549. Gas compression can shorten tdepl by reducing τ+ (therefore low τ+/τ−, d), resulting in high fsf, i.e., high dense molecular gas fraction.
Current usage metrics show cumulative count of Article Views (full-text article views including HTML views, PDF and ePub downloads, according to the available data) and Abstracts Views on Vision4Press platform.
Data correspond to usage on the plateform after 2015. The current usage metrics is available 48-96 hours after online publication and is updated daily on week days.
Initial download of the metrics may take a while.