| Issue |
A&A
Volume 623, March 2019
|
|
|---|---|---|
| Article Number | A123 | |
| Number of page(s) | 23 | |
| Section | Extragalactic astronomy | |
| DOI | https://doi.org/10.1051/0004-6361/201834661 | |
| Published online | 18 March 2019 | |
Dark matter–baryon scaling relations from Einasto halo fits to SPARC galaxy rotation curves⋆
1
Université de Strasbourg, CNRS, UMR 7550, Observatoire astronomique de Strasbourg, Strasbourg, France
2
Department of Physics, Institute for Advanced Studies in Basic Sciences, 11365-9161 Zanjan, Iran
e-mail: amir.ghari@iasbs.ac.ir
3
Departement of Physics and Astronomy, University of Victoria, Victoria, BC V8P 1A1, Canada
4
Helmholtz-Institut für Strahlen- und Kernphysik (HISKP), Universität Bonn, Bonn, Germany
Received:
15
November
2018
Accepted:
26
January
2019
Dark matter–baryon scaling relations in galaxies are important in order to constrain galaxy formation models. Here, we provide a modern quantitative assessment of these relations by modelling the rotation curves of galaxies from the Spitzer Photometry and Accurate Rotation Curves (SPARC) database with the Einasto dark halo model. We focus in particular on the comparison between the original SPARC parameters, with constant mass-to-light ratios for bulges and discs, and the parameters for which galaxies follow the tightest radial acceleration relation. We show that fits are improved in the second case, and that the pure halo scaling relations also become tighter. We report that the density at the radius where the slope is −2 is strongly anti-correlated to this radius and to the Einasto index. The latter is close to unity for a large number of galaxies, indicative of large cores. In terms of dark matter–baryon scalings, we focus on relations between the core properties and the extent of the baryonic component, which are relevant to the cusp-core transformation process. We report a positive correlation between the core size of halos with small Einasto index and the stellar disc scale-length, and between the averaged dark matter density within 2 kpc and the baryon-induced rotational velocity at that radius. This finding is related to the consequence of the radial acceleration relation on the diversity of rotation curve shapes, quantified by the rotational velocity at 2 kpc. While a tight radial acceleration relation slightly decreases the observed diversity compared to the original SPARC parameters, the diversity of baryon-induced accelerations at 2 kpc is sufficient to induce a large diversity, incompatible with current hydrodynamical simulations of galaxy formation, while maintaining a tight radial acceleration relation.
Key words: galaxies: kinematics and dynamics / galaxies: spiral / dark matter
Table A.1 is only available at the CDS via anonymous ftp to cdsarc.u-strasbg.fr (130.79.128.5) or via http://cdsarc.u-strasbg.fr/viz-bin/qcat?J/A+A/623/A123
© ESO 2019
1. Introduction
The nature of the dark sector of the Universe arguably represents one of the deepest mystery of modern physics. Despite earlier hints (e.g. Zwicky 1933), it is the flattening of rotation curves (RCs) of disc galaxies which provided the first clean observational evidence of mass discrepancies in galactic systems (Bosma 1978; Rubin et al. 1978). Many different observational probes, especially on cosmological scales (e.g. Planck Collaboration XIII 2016), then led to the development of the current standard cosmological framework (ΛCDM), where it is necessary to add non-baryonic dark matter (DM) particles to the baryonic content of the Universe, which can thus in principle explain the RC shapes.
While arguably very successful on large scales, the current ΛCDM picture nevertheless, at face value, presents some challenges (e.g. Bullock & Boylan-Kolchin 2017), notably in explaining the shapes of RCs in some galaxies. From a theoretical perspective, the standard paradigm proposes that galaxies form and evolve in virialised halos (e.g. White & Rees 1978) of cold DM (CDM). Quantum fluctuations from the vacuum state create the seed perturbations in the early universe which are stretched by inflation, and because DM forms a collisionless and pressureless fluid, it is then able to collapse under gravity, providing the first potential wells in which the baryons later cool. The evolution of the DM fluid is modelled by numerical simulations (Davis et al. 1985). DM-only (DMO) cosmological simulations treat 100% of the matter in the Universe as collisionless DM. CDM halos simulated with DMO numerical models have density profiles that are well described to first order by the NFW profile (Navarro et al. 1996b) with a central cusp (d ln ρ/d ln r = −1 in the centre, where ρ is the DM density); instead, observations point to large constant density cores of DM in the central parts of a large number of (but not all) rotationally supported galaxies (de Blok et al. 2001; Gentile et al. 2004). This problem of DMO simulations becomes even more stringent when realising that galaxies residing in halos of similar maximum circular velocity display a wide range of RC shapes in the central parts (Oman et al. 2015). This diversity of rotation curve shapes is to be contrasted with the uniformity found in the relation between the baryonic gravitational acceleration and the total gravitational acceleration (McGaugh et al. 2016; Lelli et al. 2017; Li et al. 2018; Desmond 2017a,b).
Despite the NFW profile being widely used, it should be noted that Navarro et al. (2004) and Macciò et al. (2008) have proposed another model that fits the density profiles of halos in DMO simulations better in the inner regions, a profile which had been previously introduced for the distribution of stellar light and mass in galaxies by Einasto (1965), and which does not harbour a central cusp but a slope d ln ρ/d ln r ∝ −r1/n in the centre, meaning that the slope is indeed zero very close to the nucleus. For halos of the order of and below the typical mass of the Milky Way halo in DMO simulations, the Einasto index is n ∼ 6. Nevertheless, as first shown by Chemin et al. (2011), fitting such profiles to observed rotation curves often leads to values of n in disagreement with DMO simulations, implying much larger cores in observations than in simulations, as expected from the previously known core-cusp issue. Here we reproduce a similar study by using the latest and most up-to-date database on galaxy rotation curves, the Spitzer Photometry and Accurate Rotation Curves (SPARC) database compiled by Lelli et al. (2016a).
During completion of this manuscript, Li et al. (2019) presented a study on scaling relations between DM halo parameters and disc galaxy luminosities from the SPARC database. The authors chose two DM density profile parametrisations for their exploration: the Einasto profile, like us, and general (α, β, γ) models (Zhao 1996) with parameters motivated by empirical relations as functions of stellar-to-halo mass described in Di Cintio et al. (2014), who analysed results from hydrodynamical cosmological simulations of galaxies drawn from the MAGICC project (Brook et al. 2012; Stinson et al. 2013). Using these models they fit their rotations curves through a Markov chain Monte Carlo method, taking lognormal priors on near-infrared stellar mass-to-light ratios, Gaussian priors on the inclinations and distances, and ΛCDM priors for the DM halos. The authors in particular showed that the density at the radius where the slope of the Einasto profiles becomes −2 displays no correlation with luminosity.
Our work, while sharing many similarities in data and methodology with Li et al. (2019), takes a different turn instead in examining the correlations of inferred DM halo parameters with the extent of the baryonic components. Such scaling relations are highly relevant to constraining the cusp-core transformation process. We also chose to fix the baryonic galactic parameters in two extreme cases, which we compare: (i) the original SPARC parameters with constant mass-to-light ratios for bulges and discs (Lelli et al. 2016a; McGaugh et al. 2016) and (ii) the parameters for which galaxies follow a very tight radial acceleration relation (RAR, Li et al. 2018). In Sect. 2 we briefly present the SPARC sample, while we present the form of the Einasto profile and our fitting procedure in Sect. 3. We then present our results on scaling relations in Sect. 4, and conclude in Sect. 5.
2. Data
The SPARC database (Lelli et al. 2016a) comprises ∼200 extended HI rotation curves compiled from the literature, for which near-infrared photometry at 3.6 microns is available from SpitzerSheth et al. (2010) and Schombert & McGaugh (2014). It forms a representative sample of disc galaxies in the local Universe in terms of various properties such as luminosity, size, and surface brightness. Here, we exclude from the sample the galaxies that have been given a low-quality label (Q = 3) in the original database, leaving us with a sample of 160 galaxies.
The availability of near-infrared photometry allows, in principle, the stellar mass-to-light ratio to be fixed, as it is known that this quantity does not vary much in that band. Schombert & McGaugh (2014) constructed stellar population synthesis models of disc galaxies to show that the stellar mass-to-light ratio does not depend strongly on age, metallicity, or colour for a large range of models with different star formation histories. As a first step, and following McGaugh et al. (2016), we adopt here a mass-to-light ratio Υd = 0.5 M⊙/L⊙ for discs and Υb = 0.7 M⊙/L⊙ for bulges. In a subsequent paper, Li et al. (2018, hereafter L18a) adjusted, with well-chosen priors, the mass-to-light ratio Υd for discs and Υb for bulges, distances, and inclinations for galaxies in the SPARC sample, showing that the radial acceleration relation (RAR) between the gravitational acceleration generated by baryons and the total gravitational acceleration could have a scatter as small as 0.057 dex, compatible with observational uncertainties on measured velocities themselves. As a second step, we adopt these parameters, such that in both cases only the DM halo parameters are left as free parameters.
3. Einasto profile fits
The Einasto halo model has been proposed by Navarro et al. (2004) as a density profile for CDM halos in DMO ΛCDM simulations, and had been previously introduced for the distribution of stellar light and mass in early-type galaxies (Einasto 1965, 1968, 1969). Its density profile reads
where r−2 is the radius at which the density profile has a slope of −2 and ρ−2 is the density at that radius. The third parameter, n, is the Einasto index and sets the general shape of the density profile. As shown in Chemin et al. (2011), among others, increasing the Einasto index at fixed r−2 and ρ−2 increases and steepens the density profile in the central part of the halo, making it more cuspy, the central density being given by ρ0 = ρ−2 exp(2n). Hence, n ∼ 6 DMO halos are indeed cuspy, even though they display a tiny core very close to the centre. Conversely, at fixed n ∼ 1 the profile is more cored, and the characteristic radius r−2 is a good proxy for the core-size.
Chemin et al. (2011) used the Einasto model for the first time for mass decompositions of RCs on a sample of spiral galaxies from the THINGS survey. They found that the RCs are a significantly better fit with the Einasto halo than with either the isothermal or NFW halo models. Here, in the same spirit, we use the Einasto DM halo profile for the decomposition of rotation curves of the SPARC database. This will allow us to display up-to-date scaling relations for DM and baryons, complementary to the recent study of Li et al. (2019).
To find the structural parameters of the fitted DM halo model, we decompose the observed rotation curves into four components: the stellar disc and bulge, the gaseous disc, and the DM halo. Only the (spherical) DM halo parameters are free in our fits. The observed rotation curves can be written as
where Vd is the rotation velocity of the stellar disc, and Vb of the stellar bulge, both for a stellar mass-to-light ratio of one. Finally, Vhalo is the rotation velocity of the DM halo which we fit to the data with three free parameters. We fix all the other galaxy parameters (including distance and inclination) to the original SPARC values (Lelli et al. 2016a) with fixed mass-to-light ratios Υd = 0.5 M⊙/L⊙ and Υb = 0.7 M⊙/L⊙ (hereafter the MLconst case) and to the L18a galaxy parameters.
3.1. DMO-inspired fits with virial mass as only parameter
For illustrative purposes, first we fixed the Einasto index to n = 6 and used the c − M200 relation of DMO simulations in Dutton & Macciò (2014):
Then the virial mass M200 is the only free parameter, which we can use to fit the last observed point of the rotation curve. We note that there is non-negligible scatter in this DMO relation, as well as small variations in n, which we do not account for here. These fits are mainly made here for illustrative purposes, to show the typical rotation curve shape expected at a given virial mass in the absence of any feedback from the baryons. As expected, this leads to halos that are generally too cuspy. We show this curve for the L18a case in Fig. A.1 as the blue dashed curve. It is clear that many of these fits are not satisfactory, especially for low-mass galaxies.
3.2. Three-parameter fits
We then use the Einasto DM halo profile from Eq. (1) with all three parameters being free in the fit. We use the affine Invariant Markov chain Monte Carlo Ensemble sampler, from the open source Python package emcee (Foreman-Mackey et al. 2013) to fit the observational velocity curve to the theoretical model by finding the peak of the likelihood function. Here, we do not use any ΛCDM inspired prior, and thus simply assume a flat linear prior for the three free parameters. The MCMC sampler then estimates the posterior probability distribution for all these parameters.
The best fit values of the parameters ρ−2, r−2, and n are chosen at the maximum likelihood for each galaxy. We can then compare the quality of fits in the MLconst and L18a cases by comparing the global likelihoods. Interestingly, the MLconst case, which is most often used in the literature to compare simulations to data, gives less good fits than the L18a case, even though the L18a marginalisation makes absolutely no assumptions on the dark matter halo parameters themselves. The global likelihood ratio is of the order of 3 (and there are 15 galaxies with a likelihood ratio higher than 10) in favour of the L18a case, which is not highly significant but still indicates a slight global preference for the L18a parameters.
The results of the best fit parameters in the L18a case, together with their associated uncertainties, for all 160 galaxies are listed in Table A.1 (available at CDS). The rotation curves of these galaxies are shown in Fig. A.1.
4. Scaling relations
We now explore the scaling relations between the free parameters of the DM halo itself, as well as DM-baryon scaling relations.
4.1. Dark matter halo scaling relations
We start by plotting the histogram of Einasto indices in Fig. 1, for both cases. The first interesting thing to note here is that the majority of Einasto indices are between 0 and 2, even though the number of very small n is slightly reduced in the L18a case. This is in line with the findings of Chemin et al. (2011) and indicates that the profiles tend to be more cored than in DMO simulations.
 |
Fig. 1. Histogram of Einasto indices n for the fits to the 160 galaxies with Q < 3 in the SPARC sample. Left panel: original SPARC parameters with constant mass-to-light ratios for bulges and discs (MLconst, Lelli et al. 2016a; McGaugh et al. 2016). Right panel: parameters from Li et al. (2018, L18a). |
Second, as in Chemin et al. (2011), we find a tight and strong anti-correlation between the characteristic halo radius r−2 and the characteristic halo density ρ−2 (Fig. 2). Interestingly, the slope of this relation becomes closer to the Chemin et al. (2011) value for the L18a parameters. The scatter of the relation also becomes smaller in the L18a case, decreasing from 0.35 dex in the MLconst case to 0.28 dex in the L18a case.
 |
Fig. 2. Anti-correlation between the characteristic halo radius r−2 and the characteristic halo density ρ−2 for the 160 galaxies of the SPARC sample (left panel: MLconst; right panel: L18a). In this plot the black dots with error bars are the best fit parameters derived from fitting the rotation curves, the red dotted line is the line of Chemin et al. (2011), and the green solid line is the best fit to the data. The green shaded area represents the 1σ uncertainty on this best fit line (confidence interval, which does not represent the intrinsic scatter around the relation). |
The best fit relation for the L18a parameters is
This anti-correlation is reminiscent of the scaling relation found with Burkert halos between the central density and core radius (Donato et al. 2009), although, as also shown by Li et al. (2019), it does not imply a constant surface density scale ρ−2 × r−2 independent of luminosity. We find a linear relation between the value of log(ρ−2 × r−2) and the log of the 3.6 micron luminosity, with a slope 0.13 in the MLconst case, and a slope of 0.1 in the L18a case. This relation is related to the absence of any significant correlation between the ρ−2 density scale and the luminosity, already put forward by Li et al. (2019) (see Fig. 3). However, we also note that, contrary to ρ−2, the central volume density of DM halos, ρ0, does display some correlation with luminosity, due to the higher prevalence of high Einasto indices n (and hence more cuspy halos) among galaxies of higher luminosities, as shown in the lower panels of Fig. 3.
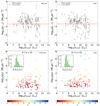 |
Fig. 3. Top panels: characteristic density ρ−2 at the radius of density slope −2 vs. 3.6 micron luminosity (left panel: MLconst; right panel: L18a), compared to the density scale of Li et al. (2019). Bottom panels: central density ρ0 vs. 3.6 micron luminosity (left panel: MLconst; right panel: L18a), colour-coded by the value of the Einasto index n. |
This result brings us to the correlation of the Einasto index n with ρ−2 and r−2, displayed in Fig. 4. The correlation between r−2 and n is rather weak in the MLconst case, with a slope consistent with zero and a scatter of 0.4 dex, but it becomes steeper with a scatter of 0.3 dex for the L18a parameters:
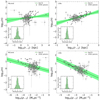 |
Fig. 4. Correlation between Einasto index n and dark matter halo parameters r−2 (top panels) and ρ−2 (bottom panels) in the MLconst (left panels) and L18a (right panels) cases. |
Similarly, the anti-correlation between ρ−2 and n has a small slope, with a large scatter of 0.4 dex in the MLconst case, but it becomes steeper and with a smaller scatter of 0.23 dex for the L18a parameters:
4.2. Dark matter–baryon scaling relations: diversity and uniformity
We now concentrate on scaling relations between DM and baryons. The first well-known scaling relation of this kind, not reproduced here, is of course the baryonic Tully–Fisher relation (BTFR) between the baryonic mass of disc galaxies and the asymptotic circular velocity, which has an intrinsic scatter smaller than 0.1 dex (McGaugh et al. 2000; Lelli et al. 2016b), a priori posing a fine-tuning problem in the ΛCDM context (Desmond 2017b). Semi-empirical models with cored DM halos can reproduce the observed slope and normalisation, but not this small scatter (Di Cintio & Lelli 2016). In addition, galaxies with the same asymptotic circular velocity – hence twins of identical baryonic mass on the BTFR – can display a very broad range of rotation curve shapes, which we could call the “BTFR twins paradox”. This unexpected diversity of shapes of rotation curves has been nicely put forward in Oman et al. (2015), among others, where the circular velocity at 2 kpc from the centre was shown to be extremely diverse for a given maximum circular velocity of the halo. We reproduce this diversity plot in Fig. 5 for both sets of galaxy parameters. It should be noted that the MLconst parameters are often used in the literature to compare the data directly to simulations. However, as we showed above, the L18a parameters yield better fits to the SPARC galaxy rotation curves. It is therefore interesting to compare the diversity of rotation curve shapes in the two cases: whilst the global picture remains the same, it is still interesting to note that some of the most extreme low values of Vrot(2 kpc) in the MLconst case become more in line with the general population when switching to the L18a parameters. Hence, some of the most extreme cored DM profile cases, which are challenging to reproduce in simulations, can be easier to reproduce with the L18a parameters.
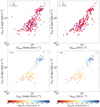 |
Fig. 5. Top panels: measured circular velocity at 2 kpc from the centre Vrot (2 kpc) vs. the maximum circular velocity of the DM halo Vmax (halo) (left panel) and the last observed point of the rotation curve VRlast (right panel). The MLconst values are shown with red diamonds and the L18a values with blue circles. The grey dotted line is the 1:1 line. Bottom panels: same plots for the L18a points colour-coded by the log of the baryon-induced velocity at 2 kpc, log[Vb(2 kpc)]. |
Nevertheless, one important piece of information missing from the usually presented diversity plot is the close relation between the value of the observed velocity at 2 kpc and the baryon-induced velocity at this radius, produced in the absence of DM. This is illustrated in the bottom row of Fig. 5, where the points are colour-coded by log[Vb(2 kpc)]. We can clearly see how smaller baryonic velocities at 2 kpc are associated with smaller total velocities Vrot(2 kpc) at this radius. While this figure clearly shows that the baryons are an important part of the story, the fact remains that the central mass deficit is enormous relative to a cuspy DM halo, sometimes higher than the total baryonic mass of the galaxy itself (Oman et al. 2015).
In order to display a few concrete examples of this relation between the baryon-induced velocities and the diversity of measured velocities at 2 kpc, we show for the L18a parameters (and on the same R-axis scale) in Fig. 6 the rotation curves of three galaxy pairs with similar asymptotic velocities, hence “BTFR twins”, but very different measured velocities at 2 kpc from the centre. In the case of IC 2574, we added a prior on the size of the core not being larger than 5 times the last observed point of the rotation curve. We alternatively added to the SPARC data one outer data point, coming from the THINGS survey (Oh et al. 2008) at large radius, recalibrated for the same distance and inclination as quoted in L18a. These two approaches gave almost exactly the same fit.
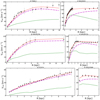 |
Fig. 6. Baryonic Tully–Fisher relation twins “paradox”. Rotation curves of three pairs of galaxies with L18a parameters, each pair having very similar asymptotic circular velocities, but very different velocities at 2 kpc from the centre. The black dots with error bars are the observed rotation curves of each galaxy; the green dotted curves are the baryonic contribution to the rotation curves; the violet dot-dashed curves are the rotation curves of the DM halo; and the red solid curves are the resulting best fit rotation curves to the observed data. |
What is immediately striking in Fig. 6 is that the more compact galaxies in terms of baryons are also more compact in terms of their DM distribution. This is of course expected from adiabatic contraction of DM halos, but the problem is that this must happen after an efficient core formation mechanism, and that going back to very steep DM distributions for the highest baryonic surface densities, through adiabatic contraction, can then be complicated, as we discuss below in the context of hydrodynamical simulations of galaxy formation. Here, the gravitational acceleration generated by baryons at 2 kpc is much smaller in F568–3, UGC 5750, and IC 2574 than in NGC 024, UGC 5721, and UGC 7690, and so is the measured circular velocity, and hence the total gravitational acceleration at 2 kpc. This is highly suggestive of the fact that the diversity of rotation curve shapes is driven by the diversity of baryonic distributions at a given maximum velocity scale, together with a tight baryon-DM scaling relation. This relation is the RAR. This means that while a tight RAR as obeyed in the L18a case slightly decreases the diversity compared to the original MLconst case, the diversity of baryon-induced accelerations at 2 kpc of the SPARC galaxies is sufficient to induce a large diversity of rotation curve shapes with a tight RAR.
By fitting the function proposed by McGaugh (2008), Famaey & McGaugh (2012), and McGaugh & Schombert (2014),
with the only free parameter g†, McGaugh et al. 2016 and Lelli et al. (2017) found a good fit to the RAR of the SPARC sample of galaxies with g† = (1.20 ± 0.02)×10−10 m s−2. With the L18a parameters, the RAR scatter is as small as 0.057 dex. In the outer flat part of rotation curves, this relation is equivalent to the BTFR (e.g. Lelli et al. 2016b), but it is important to remember that the BTFR does not imply the RAR in the central parts of galaxies where the rotation curves are rising and where the RAR is more closely connected to the size of the DM cores.
The RAR implies that the rotation curve shape is actually correlated with the surface density of the baryons (see Fig. 15 of Famaey & McGaugh 2012), for instance as illustrated in Lelli et al. (2013, 2016c). Also, the rotation curve shapes of late-type spiral galaxies in the low-acceleration regime should all be similar when expressed in units of disc scale-length (Swaters et al. 2009; McGaugh 2014), at least for perfect exponential discs. In other words, we also expect that the size of the DM core will be directly correlated with the disc scale-length, a finding already put forward by Donato et al. (2004). However, gaseous distributions are not exponential, so that any plotted correlation using the stellar disc scale-length as a proxy for the extent and “fluffiness” of a disc with a certain baryonic mass will be much less tight than the RAR itself.
Figure 7 shows the correlation between the DM halo parameter r−2 and the stellar disc scale-length Rd in the MLconst and L18a cases. The scatter is similar in both cases, of the order of 0.35 dex. The L18a relation is
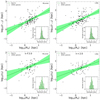 |
Fig. 7. Top panels: correlation between the stellar disc scale-length Rd and the dark matter halo parameter r−2 (left panel: MLconst; right panel: L18a). Bottom panels: cored profiles with n < 2, correlation between Rd and the core size r0 defined as the radius at which the DM density becomes half the central one (left panel: MLconst; right panel: L18a). |
If we restrict ourselves to cored profiles with n < 2, and define the core size r0 as the radius at which the density becomes half the central one ρ0, we end up with a similar correlation, which we display in the lower panels of Fig. 7, where the scatter is reduced from 0.5 dex in the MLconst case to 0.4 dex in the L18a case. The L18a correlation in the lower right panel of Fig. 7 for n < 2 reads
Finally, a way to illustrate the influence of baryons on the diversity of central DM profiles in rotationally supported galaxies is to look at the averaged DM density within 2 kpc, and compare it to the baryon-induced velocity at that radius. We indeed found in Fig. 8, in both the MLconst and L18a cases, a very well-defined relation for galaxies with baryonic velocities that were low enough at 2 kpc, Vb(2 kpc) < 80 km s−1, meaning that the baryons do not heavily dominate the measured circular velocity at 2 kpc (which would imply a very bad constraint on the enclosed DM mass). The log-log slope of the relation is 0.93 in the MLconst case with a scatter of 0.3 dex, and 0.87 in the L18a case with a scatter of only 0.08 dex. In the L18a case the relation for  reads
reads
 |
Fig. 8. “Strong” version of the old core-cusp problem. Correlation between the averaged DM density within 2 kpc |
We note that this relation can actually be directly inferred from the RAR, a relation which we overplot as a dotted red curve in Fig. 8. We note that this figure is in fact closely related to the colour gradient visible in Fig. 5, as the average DM density within 2 kpc also reads  , where R = 2 kpc.
Equations (9) and (10) can be considered to represent the strong version of the old core-cusp problem. Late-type low-mass galaxies often require DM cores; in addition, the averaged density and size of these cores are closely correlated to the baryonic distribution. Together with the diversity of baryonic surface density distributions at a given DM halo mass scale, this is at the root of the diversity of rotation curve shapes.
This diversity of rotation curve shapes is actually an important constraint to take into account in hydrodynamical simulations of galaxy formation, closely related to the ability of simulations to transform initially cuspy DM profiles into cores (e.g. Navarro et al. 1996a; Pontzen & Governato 2012). As shown in Oman et al. (2015), cosmological hydrodynamical simulations from the EAGLE and APOSTLE projects are unable to produce large cores as required by the low values of Vrot(2 kpc) in a large number of galaxies. This issue was explored further by Benitez-Llambay et al. (2018) who showed that the core formation crucially depends on the star formation gas density threshold. They showed that high thresholds are needed for baryons to collapse at the centre at densities comparable to DM, before being ejected by feedback, in order for cores to form under the influence of a small number of distinctive gas blowouts. A simulation with high star formation gas density threshold resulted in galaxies with sizeable cores over a limited halo mass range, but still insufficient variety in mass profiles to explain the observed diversity of galaxy rotation curves. Other simulations create cores more easily than those based on EAGLE. For instance, Di Cintio et al. (2014) used a suite of simulated galaxies drawn from the MaGICC project to investigate the effects of baryonic feedback on the density profiles of DM halos, producing cored profiles. Read et al. (2016); Read et al. (2019) also used high resolution simulations of isolated dwarf galaxies to study the physics of DM cusp-core transformation, which was argued to be linked to short potential fluctuations associated with bursty star formation over a long period (in contradiction to Benitez-Llambay et al. 2018). Most of these simulations also showed how the general shape of the RAR was naturally obtained when including baryonic feedback (e.g. Ludlow et al. 2017; Keller & Wadsley 2017). Perhaps the most impressive simulations in that sense are the recent NIHAO simulations (e.g. Santos-Santos et al. 2018), which are argued to produce a tight RAR with a scatter of order 0.08 dex over the entire distance range (Dutton et al., in prep.)1. Nevertheless, we argue hereafter that the real challenge is to produce both a tight RAR and the observed diversity of rotation curve shapes. To illustrate the relation between a tight RAR and the diversity problem, in Fig. 9 we plot 124 galaxies with L18a parameters (rejecting galaxies with uncertainty > 10% in Vrot(2 kpc) and those with gobs < gbar at 2 kpc), compared to the RAR at only 2 kpc. This means that, contrary to the traditional RAR plot, each point on this plot represents a different galaxy. Equation (7) is overplotted together with those points. The scatter around the relation is ∼0.06 dex. The six representative galaxies plotted in Fig. 6 are shown in this plot. These selected galaxies can then illustrate the effect of the RAR on the diversity plot, which we reproduce for the same set of 124 galaxies in the right panel of Fig. 9. We note that in this case the scatter of Vrot around the median at a given VRlast is ∼0.2 dex. This can then be compared directly to the points from Fig. 2 of Santos-Santos et al. (2018). Interestingly, it appears that the NIHAO simulations are very efficient at producing cores reproducing the right Vrot(2 kpc) for galaxies at the bottom of the RAR, with a low baryonic acceleration at 2 kpc. However, the three high-baryonic acceleration galaxies in Fig. 6, NGC 024, UGC 5721, and UGC 7690 all seem to have observed Vrot(2 kpc) too high to be reproduced by the NIHAO simulations. In the left panel of Fig. 9, we also overplot the NIHAO points on the RAR at 2 kpc from Dutton et al. (in prep.), spanning the same baryonic acceleration range as our sample. Interestingly, the NIHAO simulations seem to slightly underpredict the observed RAR at 2 kpc in the regime of baryonic accelerations ranging from ∼10−11 to 10−10 m s−2, corresponding to the regime of our three representative high baryonic acceleration galaxies. One interesting thing to note is that Oman et al. (2019) showed that observing and modelling the same simulated galaxies as in Oman et al. (2015) to measure their rotation curves–rather than simply measuring the rotation curve from the mass profile–introduced an additional downward scatter in the diversity plot. Interestingly, when considering the observed RAR for the same galaxies as in Fig. 9 at different radii, the scatter clearly increases downwards when the quoted observational errors increase (Fig. 10). At 1 kpc, the observational errors become quite important (whilst non-circular motions might also become more important than in the outskirts), and many galaxies scatter down in the RAR. At 5 kpc, on the other hand, the quoted observational errors are smaller, and the tightness of the RAR becomes impressive. In terms of diversity, this could mean that results such as those from NIHAO are actually worse than they appear; if the galaxies were realistically observed and modelled they could scatter down even more in terms of Vrot(2 kpc). Additionally, it would be important to check whether the relation between Vmax and VRlast in NIHAO are in line with observational fits. Interestingly, as originally shown by Oman et al. (2015), galaxies such as NGC 024, UGC 5721, and UGC 7690 can in principle be more closely reproduced in the diversity plot by simulations from the EAGLE and APOSTLE projects, which in turn cannot reproduce the smaller Vrot(2 kpc) galaxies. This is illustrated in Fig. 11 where the diversity plot of the NIHAO and APOSTLE/EAGLE simulations are compared. Even taking into account observational errors, it is unlikely that the APOSTLE/EAGLE points will scatter down far enough. On the other hand, NIHAO points will probably scatter down too much once such errors are taken into account. This might indicate that the answer lies somewhere between the two types of simulations, combining cores slightly more modest than in NIHAO with some contribution from rotation curve errors (to add some scatter and downward shift). In either case, reproducing both a tight RAR and the observed diversity of rotation curve shapes thus raises an interesting challenge for simulations of galaxy formation.
 |
Fig. 9. Left panel: radial acceleration relation (RAR) at 2 kpc (see text) with L18a parameters. The six representative galaxies plotted in Fig. 6 are displayed as green, magenta, and orange squares and stars in this plot. The grey dotted line is the 1:1 line. The red dashed curve is the RAR from Eq. (7). UGC 7690 and NGC 024 fall particularly well on the relation. Also overplotted as cyan triangles are the points of the RAR at 2 kpc from the NIHAO simulations of Dutton et al. (in prep.). Right panel: diversity plot: circular velocity at 2 kpc from the centre Vrot(2 kpc) vs. circular velocity at the last observed point VRlast for the same galaxies. The cyan triangles are the predictions of the NIHAO simulations from Fig. 2 in Santos-Santos et al. (2018). UGC 7690 and NGC 024 appear to have too high velocities Vrot(2 kpc) and hence too high central DM concentrations (n = 5.5 and 4.7, respectively) compared to simulations with very efficient core formation. |
 |
Fig. 10. Left panel: RAR at 1 kpc with the L18a parameters. Observational errors from the rotation curve measurements are also plotted. The large errors seem to be associated with a downward scatter in gobs with respect to the RAR. Right panel: RAR at 5 kpc. The observational errors are small and the RAR is particularly tight at this radius. The six representative galaxies in Fig. 6 are displayed as in Fig. 9. |
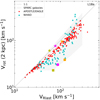 |
Fig. 11. Diversity plot from simulations: Circular velocity at 2 kpc from the centre Vrot(2 kpc) vs. circular velocity at the last observed point VRlast from the NIHAO (cyan triangles) and APOSTLE/EAGLE (red points) projects. The grey shaded area indicates the region spanned by observed galaxies in SPARC (i.e. the black points in Fig. 9). The six representative galaxies are plotted as in Fig. 9. |
5. Discussion and conclusion
In this paper, we used the Einasto DM halo profile for the decomposition of rotation curves, in the same spirit as Chemin et al. (2011) and Li et al. (2019). Our study is complementary to the latter, as we compared here the quality of the fits and the scaling relations obtained for different sets of galaxy parameters, and focused in particular on scaling relations between the characteristics of the DM core of low-mass galaxies and their baryonic distributions.
The two sets of galaxy parameters used in this study were the original SPARC parameters with constant mass-to-light ratios for bulges and discs (Lelli et al. 2016a; McGaugh et al. 2016), and the parameters for which galaxies follow the tightest radial acceleration relation (RAR, L18a). We found that the fits were globally slightly better in the latter case, and that the dark halo parameter scaling relations also became a bit tighter. In particular, we found for both sets of parameters a tight and strong anti-correlation between the characteristic halo radius r−2 and the characteristic halo density ρ−2. The latter is also anti-correlated with the Einasto index n, but in a tighter and steeper way for the L18a parameters than for the MLconst ones.
In terms of dark matter–baryon scaling relations, we focused on relations between the core properties and the extent of the baryonic component, which are highly relevant to the cusp-core transformation process. For galaxies with Einasto index n < 2, we found a positive correlation between the core size, defined as the radius where the density reaches half of its central value, and the stellar disc scale-length (Eq. (9)), albeit with some significant scatter. A tighter relation has been found between the averaged dark matter density within 2 kpc and the baryon-induced rotational velocity at that radius (Eq. (10)) for galaxies not too strongly dominated by baryons in the centre, namely where this velocity does not exceed 80 km s−1. These scaling relations could be referred to as the strong version of the old core-cusp problem.
These scaling relations are directly related to the consequence of the RAR on the diversity of rotation curve shapes (Oman et al. 2015), quantified by the observed rotational velocity at 2 kpc, at a given maximum or asymptotic velocity scale. This diversity of rotation curve shapes could be referred to as the BTFR twins paradox since the a priori expectation, without efficient feedback, would have been a tight relation between the rotational velocity at 2 kpc and the maximum halo velocity for dark matter dominated galaxies. We confirmed this observed diversity of rotation curve shapes, but pointed out how it was directly related to the tightness of the radial acceleration relation together with the diversity of baryon distributions in galactic discs. While we showed that a tight RAR with the L18a parameters slightly decreases the observed diversity compared to the MLconst case, in the L18a case we also showed that the diversity of baryon-induced accelerations at 2 kpc toghether with the RAR are sufficient to induce a large diversity of rotation curve shapes.
Reproducing all the scaling relations displayed in this paper together, and in particular the RAR and the diversity of rotation curve shapes side by side, is still challenging for current hydrodynamical simulations of galaxy formation in a cosmological context, as we illustrated in Figs. 9–11. This challenge could perhaps imply something fundamental on the nature of dark matter (Kamada et al. 2017; Famaey et al. 2018) or even gravity (Milgrom 1983; Famaey & McGaugh 2012; Smolin 2017; Verlinde 2017). In the standard context, it might seem to call for an apparently fine-tuned feedback from the baryons, where galaxies would self-regulate their star formation, implying an interplay between gas inflow, star formation, feedback, and the final DM distribution, which would have to conspire to make galaxies find an attractor acceleration relation with little scatter over the entire acceleration range, while maintaining a high diversity of rotation curve shapes.
Acknowledgments
The authors thank the referee, Kyle Oman, for the excellent suggestions and for providing us with the APOSTLE/EAGLE VRlast and Vrot(2 kpc) simulated data points. We also thank Aaron Dutton for providing us with the NIHAO RAR at 2 kpc. We acknowledge useful discussions with Federico Lelli and Stacy McGaugh.
References
- Benitez-Llambay, A., Frenk, C. S., Ludlow, A. D., & Navarro, J. F. 2018, MNRAS submitted [arXiv:1810.04186] [Google Scholar]
- Bosma, A. 1978, PhD Thesis, Groningen Univ. [Google Scholar]
- Brook, C. B., Stinson, G., Gibson, B. K., Wadsley, J., & Quinn, T. 2012, MNRAS, 424, 1275 [NASA ADS] [CrossRef] [Google Scholar]
- Bullock, J. S., & Boylan-Kolchin, M. 2017, ARA&A, 55, 343 [NASA ADS] [CrossRef] [Google Scholar]
- Chemin, L., de Blok, W. J. G., & Mamon, G. A. 2011, AJ, 142, 109 [NASA ADS] [CrossRef] [Google Scholar]
- Davis, M., Efstathiou, G., Frenk, C. S., & White, S. D. M. 1985, ApJ, 292, 371 [NASA ADS] [CrossRef] [Google Scholar]
- de Blok, W. J. G., McGaugh, S. S., & Rubin, V. C. 2001, AJ, 122, 2396 [NASA ADS] [CrossRef] [Google Scholar]
- Desmond, H. 2017a, MNRAS, 464, 4160 [CrossRef] [Google Scholar]
- Desmond, H. 2017b, MNRAS, 472, L35 [NASA ADS] [CrossRef] [Google Scholar]
- Di Cintio, A., & Lelli, F. 2016, MNRAS, 456, L127 [NASA ADS] [CrossRef] [Google Scholar]
- Di Cintio, A., Brook, C. B., Dutton, A. A., et al. 2014, MNRAS, 441, 2986 [NASA ADS] [CrossRef] [Google Scholar]
- Donato, F., Gentile, G., & Salucci, P. 2004, MNRAS, 353, L17 [NASA ADS] [CrossRef] [MathSciNet] [Google Scholar]
- Donato, F., Gentile, G., Salucci, P., et al. 2009, MNRAS, 397, 1169 [NASA ADS] [CrossRef] [Google Scholar]
- Dutton, A. A., & Macciò, A. V. 2014, MNRAS, 441, 3359 [NASA ADS] [CrossRef] [Google Scholar]
- Einasto, J. 1965, Tr. Astrofiz. Inst. Alma-Ata, 5, 87 [Google Scholar]
- Einasto, J. 1968, Pub. Tartu Astrofiz. Obs., 36, 414 [NASA ADS] [Google Scholar]
- Einasto, J. 1969, Astron. Nachr., 291, 97 [NASA ADS] [CrossRef] [Google Scholar]
- Famaey, B., & McGaugh, S. S. 2012, Liv. Rev. Rel., 15, 10 [Google Scholar]
- Famaey, B., Khoury, J., & Penco, R. 2018, J. Cosmol. Astropart. Phys., 3, 038 [Google Scholar]
- Foreman-Mackey, D., Hogg, D. W., Lang, D., & Goodman, J. 2013, PASP, 125, 306 [CrossRef] [Google Scholar]
- Gentile, G., Salucci, P., Klein, U., Vergani, D., & Kalberla, P. 2004, MNRAS, 351, 903 [NASA ADS] [CrossRef] [MathSciNet] [Google Scholar]
- Kamada, A., Kaplinghat, M., Pace, A. B., & Yu, H.-B. 2017, Phys. Rev. Lett., 119, 111102 [NASA ADS] [CrossRef] [Google Scholar]
- Keller, B. W., & Wadsley, J. W. 2017, ApJ, 835, L17 [NASA ADS] [CrossRef] [Google Scholar]
- Lelli, F., Fraternali, F., & Verheijen, M. 2013, MNRAS, 433, L30 [NASA ADS] [CrossRef] [Google Scholar]
- Lelli, F., McGaugh, S. S., & Schombert, J. M. 2016a, AJ, 152, 157 [Google Scholar]
- Lelli, F., McGaugh, S. S., & Schombert, J. M. 2016b, ApJ, 816, L14 [Google Scholar]
- Lelli, F., McGaugh, S. S., Schombert, J. M., & Pawlowski, M. S. 2016c, ApJ, 827, L19 [NASA ADS] [CrossRef] [Google Scholar]
- Lelli, F., McGaugh, S. S., Schombert, J. M., & Pawlowski, M. S. 2017, ApJ, 836, 152 [Google Scholar]
- Li, P., Lelli, F., McGaugh, S., & Schombert, J. 2018, A&A, 615, A3 [NASA ADS] [CrossRef] [EDP Sciences] [Google Scholar]
- Li, P., Lelli, F., McGaugh, S. S., Starkman, N., & Schombert, J. M. 2019, MNRAS, 482, 5106 [NASA ADS] [CrossRef] [Google Scholar]
- Ludlow, A. D., Benítez-Llambay, A., Schaller, M., et al. 2017, Phys. Rev. Lett., 118, 161103 [NASA ADS] [CrossRef] [Google Scholar]
- Macciò, A. V., Dutton, A. A., & van den Bosch, F. C. 2008, MNRAS, 391, 1940 [NASA ADS] [CrossRef] [Google Scholar]
- McGaugh, S. 2014, Galaxies, 2, 601 [NASA ADS] [CrossRef] [Google Scholar]
- McGaugh, S. S. 2008, ApJ, 683, 137 [NASA ADS] [CrossRef] [Google Scholar]
- McGaugh, S. S., & Schombert, J. M. 2014, AJ, 148, 77 [NASA ADS] [CrossRef] [Google Scholar]
- McGaugh, S. S., Lelli, F., & Schombert, J. M. 2016, Phys. Rev. Lett., 117, 201101 [NASA ADS] [CrossRef] [Google Scholar]
- McGaugh, S. S., Schombert, J. M., Bothun, G. D., & de Blok, W. J. G. 2000, ApJ, 533, L99 [NASA ADS] [CrossRef] [PubMed] [Google Scholar]
- Milgrom, M. 1983, ApJ, 270, 365 [NASA ADS] [CrossRef] [Google Scholar]
- Navarro, J. F., Eke, V. R., & Frenk, C. S. 1996a, MNRAS, 283, L72 [NASA ADS] [Google Scholar]
- Navarro, J. F., Frenk, C. S., & White, S. D. M. 1996b, ApJ, 462, 563 [NASA ADS] [CrossRef] [Google Scholar]
- Navarro, J. F., Hayashi, E., Power, C., et al. 2004, MNRAS, 349, 1039 [NASA ADS] [CrossRef] [Google Scholar]
- Oh, S.-H., de Blok, W. J. G., Walter, F., Brinks, E., & Kennicutt, Jr., R. C. 2008, AJ, 136, 2761 [NASA ADS] [CrossRef] [Google Scholar]
- Oman, K. A., Navarro, J. F., Fattahi, A., et al. 2015, MNRAS, 452, 3650 [CrossRef] [Google Scholar]
- Oman, K. A., Marasco, A., Navarro, J. F., et al. 2019, MNRAS, 482, 821 [NASA ADS] [CrossRef] [Google Scholar]
- Planck Collaboration XIII. 2016, A&A, 594, A13 [NASA ADS] [CrossRef] [EDP Sciences] [Google Scholar]
- Pontzen, A., & Governato, F. 2012, MNRAS, 421, 3464 [NASA ADS] [CrossRef] [Google Scholar]
- Read, J. I., Agertz, O., & Collins, M. L. M. 2016, MNRAS, 459, 2573 [NASA ADS] [CrossRef] [Google Scholar]
- Read, J. I., Walker, M. G., & Steger, P. 2019, MNRAS, 484, 1401 [NASA ADS] [CrossRef] [Google Scholar]
- Rubin, V. C., Ford, Jr., W. K., & Thonnard, N. 1978, ApJ, 225, L107 [NASA ADS] [CrossRef] [Google Scholar]
- Santos-Santos, I. M., Di Cintio, A., Brook, C. B., et al. 2018, MNRAS, 473, 4392 [NASA ADS] [CrossRef] [Google Scholar]
- Schombert, J., & McGaugh, S. 2014, PASA, 31, e036 [NASA ADS] [CrossRef] [Google Scholar]
- Sheth, K., Regan, M., Hinz, J. L., et al. 2010, PASP, 122, 1397 [NASA ADS] [CrossRef] [Google Scholar]
- Smolin, L. 2017, Phys. Rev. D, 96, 083523 [NASA ADS] [CrossRef] [Google Scholar]
- Stinson, G. S., Brook, C., Macciò, A. V., et al. 2013, MNRAS, 428, 129 [NASA ADS] [CrossRef] [Google Scholar]
- Swaters, R. A., Sancisi, R., van Albada, T. S., & van der Hulst, J. M. 2009, A&A, 493, 871 [NASA ADS] [CrossRef] [EDP Sciences] [Google Scholar]
- Verlinde, E. 2017, SciPost Phys., 2, 016 [NASA ADS] [CrossRef] [Google Scholar]
- White, S. D. M., & Rees, M. J. 1978, MNRAS, 183, 341 [NASA ADS] [CrossRef] [Google Scholar]
- Zhao, H. 1996, MNRAS, 278, 488 [Google Scholar]
- Zwicky, F. 1933, Helvetica Phys. Acta, 6, 110 [Google Scholar]
Appendix A: Rotation curve fits results
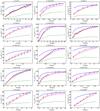 |
Fig. A.1. Rotation curve fits for SPARC galaxies with L18a parameters. In each panel the black dots represent the measured rotation velocities and their observational uncertainties. The red curves are the best fit curves to the data with our three-parameters fits. The green dashed curves represent the contribution of the baryonic matter to the rotation curves and the dark matter halo rotation velocities are plotted by violet dot-dashed curves. The blue dashed curves are there for visual comparison only, using n = 6 and the virial mass as the only free parameter to give an idea of the typical shape expected in the DMO case. |
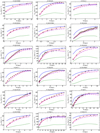 |
Fig. A.1. continued. |
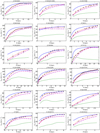 |
Fig. A.1. continued. |
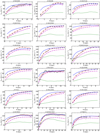 |
Fig. A.1. continued. |
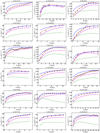 |
Fig. A.1. continued. |
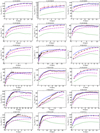 |
Fig. A.1. continued. |
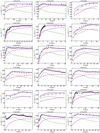 |
Fig. A.1. continued. |
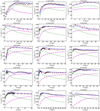 |
Fig. A.1. continued. |
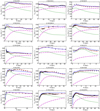 |
Fig. A.1. continued. |
 |
Fig. A.1. continued. |
All Figures
 |
Fig. 1. Histogram of Einasto indices n for the fits to the 160 galaxies with Q < 3 in the SPARC sample. Left panel: original SPARC parameters with constant mass-to-light ratios for bulges and discs (MLconst, Lelli et al. 2016a; McGaugh et al. 2016). Right panel: parameters from Li et al. (2018, L18a). |
| In the text | |
 |
Fig. 2. Anti-correlation between the characteristic halo radius r−2 and the characteristic halo density ρ−2 for the 160 galaxies of the SPARC sample (left panel: MLconst; right panel: L18a). In this plot the black dots with error bars are the best fit parameters derived from fitting the rotation curves, the red dotted line is the line of Chemin et al. (2011), and the green solid line is the best fit to the data. The green shaded area represents the 1σ uncertainty on this best fit line (confidence interval, which does not represent the intrinsic scatter around the relation). |
| In the text | |
 |
Fig. 3. Top panels: characteristic density ρ−2 at the radius of density slope −2 vs. 3.6 micron luminosity (left panel: MLconst; right panel: L18a), compared to the density scale of Li et al. (2019). Bottom panels: central density ρ0 vs. 3.6 micron luminosity (left panel: MLconst; right panel: L18a), colour-coded by the value of the Einasto index n. |
| In the text | |
 |
Fig. 4. Correlation between Einasto index n and dark matter halo parameters r−2 (top panels) and ρ−2 (bottom panels) in the MLconst (left panels) and L18a (right panels) cases. |
| In the text | |
 |
Fig. 5. Top panels: measured circular velocity at 2 kpc from the centre Vrot (2 kpc) vs. the maximum circular velocity of the DM halo Vmax (halo) (left panel) and the last observed point of the rotation curve VRlast (right panel). The MLconst values are shown with red diamonds and the L18a values with blue circles. The grey dotted line is the 1:1 line. Bottom panels: same plots for the L18a points colour-coded by the log of the baryon-induced velocity at 2 kpc, log[Vb(2 kpc)]. |
| In the text | |
 |
Fig. 6. Baryonic Tully–Fisher relation twins “paradox”. Rotation curves of three pairs of galaxies with L18a parameters, each pair having very similar asymptotic circular velocities, but very different velocities at 2 kpc from the centre. The black dots with error bars are the observed rotation curves of each galaxy; the green dotted curves are the baryonic contribution to the rotation curves; the violet dot-dashed curves are the rotation curves of the DM halo; and the red solid curves are the resulting best fit rotation curves to the observed data. |
| In the text | |
 |
Fig. 7. Top panels: correlation between the stellar disc scale-length Rd and the dark matter halo parameter r−2 (left panel: MLconst; right panel: L18a). Bottom panels: cored profiles with n < 2, correlation between Rd and the core size r0 defined as the radius at which the DM density becomes half the central one (left panel: MLconst; right panel: L18a). |
| In the text | |
 |
Fig. 8. “Strong” version of the old core-cusp problem. Correlation between the averaged DM density within 2 kpc |
| In the text | |
 |
Fig. 9. Left panel: radial acceleration relation (RAR) at 2 kpc (see text) with L18a parameters. The six representative galaxies plotted in Fig. 6 are displayed as green, magenta, and orange squares and stars in this plot. The grey dotted line is the 1:1 line. The red dashed curve is the RAR from Eq. (7). UGC 7690 and NGC 024 fall particularly well on the relation. Also overplotted as cyan triangles are the points of the RAR at 2 kpc from the NIHAO simulations of Dutton et al. (in prep.). Right panel: diversity plot: circular velocity at 2 kpc from the centre Vrot(2 kpc) vs. circular velocity at the last observed point VRlast for the same galaxies. The cyan triangles are the predictions of the NIHAO simulations from Fig. 2 in Santos-Santos et al. (2018). UGC 7690 and NGC 024 appear to have too high velocities Vrot(2 kpc) and hence too high central DM concentrations (n = 5.5 and 4.7, respectively) compared to simulations with very efficient core formation. |
| In the text | |
 |
Fig. 10. Left panel: RAR at 1 kpc with the L18a parameters. Observational errors from the rotation curve measurements are also plotted. The large errors seem to be associated with a downward scatter in gobs with respect to the RAR. Right panel: RAR at 5 kpc. The observational errors are small and the RAR is particularly tight at this radius. The six representative galaxies in Fig. 6 are displayed as in Fig. 9. |
| In the text | |
 |
Fig. 11. Diversity plot from simulations: Circular velocity at 2 kpc from the centre Vrot(2 kpc) vs. circular velocity at the last observed point VRlast from the NIHAO (cyan triangles) and APOSTLE/EAGLE (red points) projects. The grey shaded area indicates the region spanned by observed galaxies in SPARC (i.e. the black points in Fig. 9). The six representative galaxies are plotted as in Fig. 9. |
| In the text | |
 |
Fig. A.1. Rotation curve fits for SPARC galaxies with L18a parameters. In each panel the black dots represent the measured rotation velocities and their observational uncertainties. The red curves are the best fit curves to the data with our three-parameters fits. The green dashed curves represent the contribution of the baryonic matter to the rotation curves and the dark matter halo rotation velocities are plotted by violet dot-dashed curves. The blue dashed curves are there for visual comparison only, using n = 6 and the virial mass as the only free parameter to give an idea of the typical shape expected in the DMO case. |
| In the text | |
 |
Fig. A.1. continued. |
| In the text | |
 |
Fig. A.1. continued. |
| In the text | |
 |
Fig. A.1. continued. |
| In the text | |
 |
Fig. A.1. continued. |
| In the text | |
 |
Fig. A.1. continued. |
| In the text | |
 |
Fig. A.1. continued. |
| In the text | |
 |
Fig. A.1. continued. |
| In the text | |
 |
Fig. A.1. continued. |
| In the text | |
 |
Fig. A.1. continued. |
| In the text | |
Current usage metrics show cumulative count of Article Views (full-text article views including HTML views, PDF and ePub downloads, according to the available data) and Abstracts Views on Vision4Press platform.
Data correspond to usage on the plateform after 2015. The current usage metrics is available 48-96 hours after online publication and is updated daily on week days.
Initial download of the metrics may take a while.


![$$ \begin{aligned} \rho _{\rm E}(r) = \rho _{-2}\,\exp \left[-2n\,\left(\left({r\over r_{-2}}\right)^{1/n}-1\right)\right], \end{aligned} $$](/articles/aa/full_html/2019/03/aa34661-18/aa34661-18-eq1.gif)


