Fig. 8.
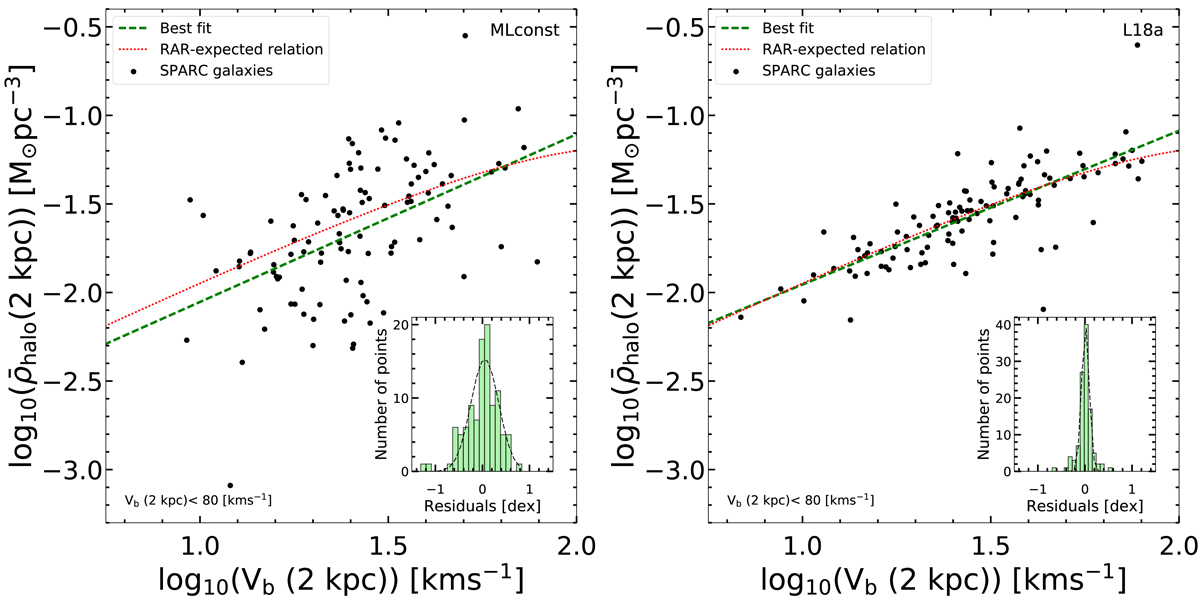
“Strong” version of the old core-cusp problem. Correlation between the averaged DM density within 2 kpc ![]() and the baryon-induced velocity at 2 kpc, Vb(2 kpc) (left panel: MLconst; right panel: L18a). The red-dotted curve is the correlation induced by the RAR in Eq. (7). This plot is closely related to the colour gradient visible in Fig. 5, as the average DM density within 2 kpc simply reads as
and the baryon-induced velocity at 2 kpc, Vb(2 kpc) (left panel: MLconst; right panel: L18a). The red-dotted curve is the correlation induced by the RAR in Eq. (7). This plot is closely related to the colour gradient visible in Fig. 5, as the average DM density within 2 kpc simply reads as ![]() , where R = 2 kpc.
, where R = 2 kpc.
Current usage metrics show cumulative count of Article Views (full-text article views including HTML views, PDF and ePub downloads, according to the available data) and Abstracts Views on Vision4Press platform.
Data correspond to usage on the plateform after 2015. The current usage metrics is available 48-96 hours after online publication and is updated daily on week days.
Initial download of the metrics may take a while.