Fig. 6.
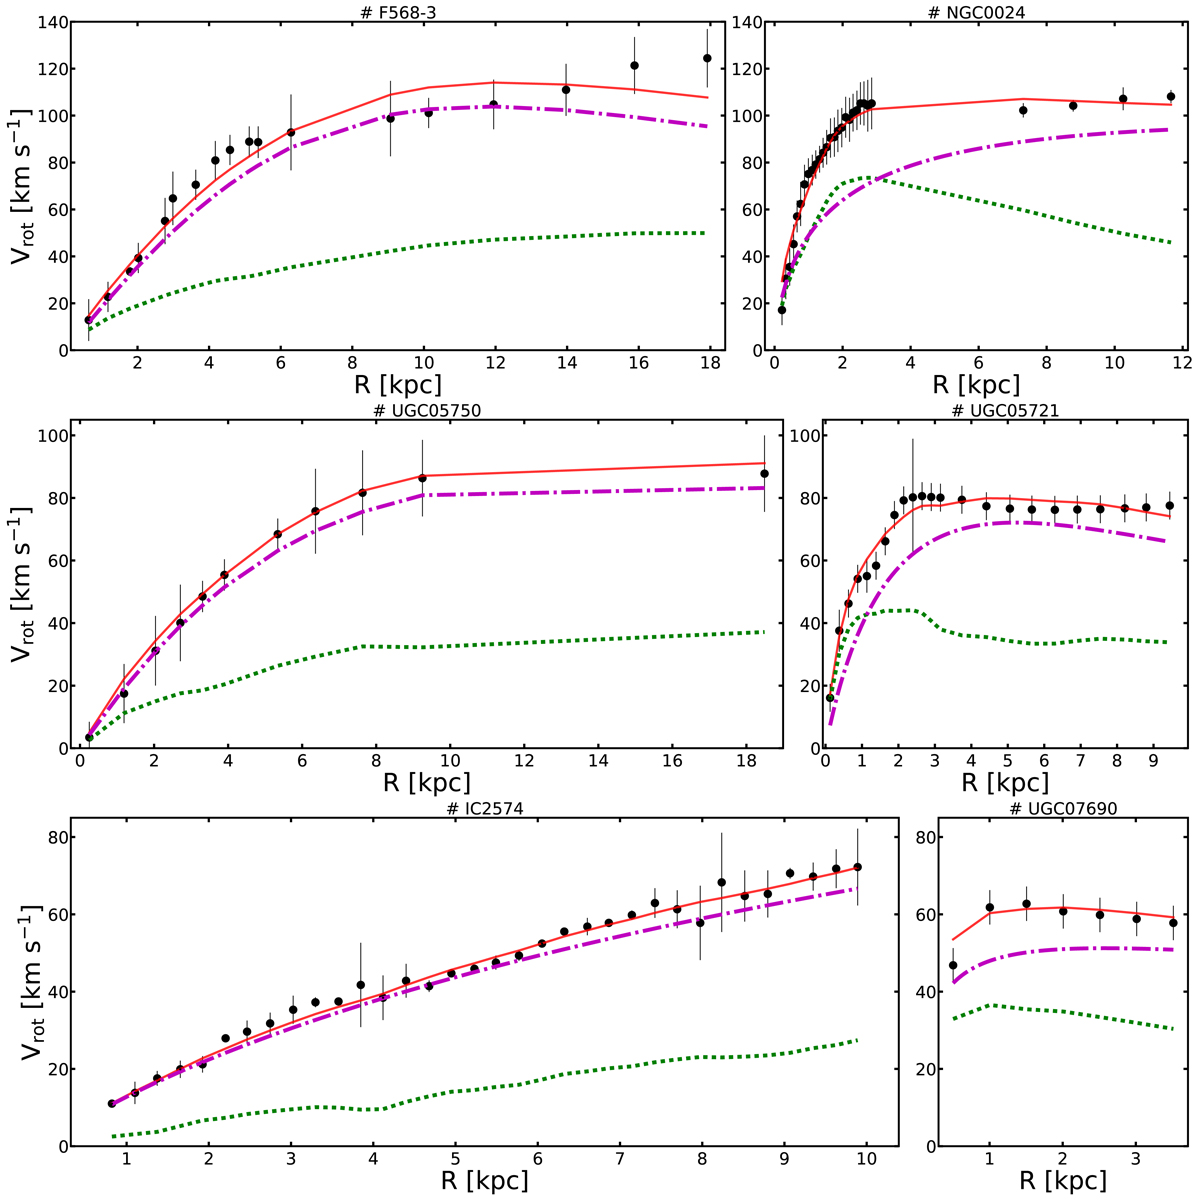
Baryonic Tully–Fisher relation twins “paradox”. Rotation curves of three pairs of galaxies with L18a parameters, each pair having very similar asymptotic circular velocities, but very different velocities at 2 kpc from the centre. The black dots with error bars are the observed rotation curves of each galaxy; the green dotted curves are the baryonic contribution to the rotation curves; the violet dot-dashed curves are the rotation curves of the DM halo; and the red solid curves are the resulting best fit rotation curves to the observed data.
Current usage metrics show cumulative count of Article Views (full-text article views including HTML views, PDF and ePub downloads, according to the available data) and Abstracts Views on Vision4Press platform.
Data correspond to usage on the plateform after 2015. The current usage metrics is available 48-96 hours after online publication and is updated daily on week days.
Initial download of the metrics may take a while.