Fig. A.1.
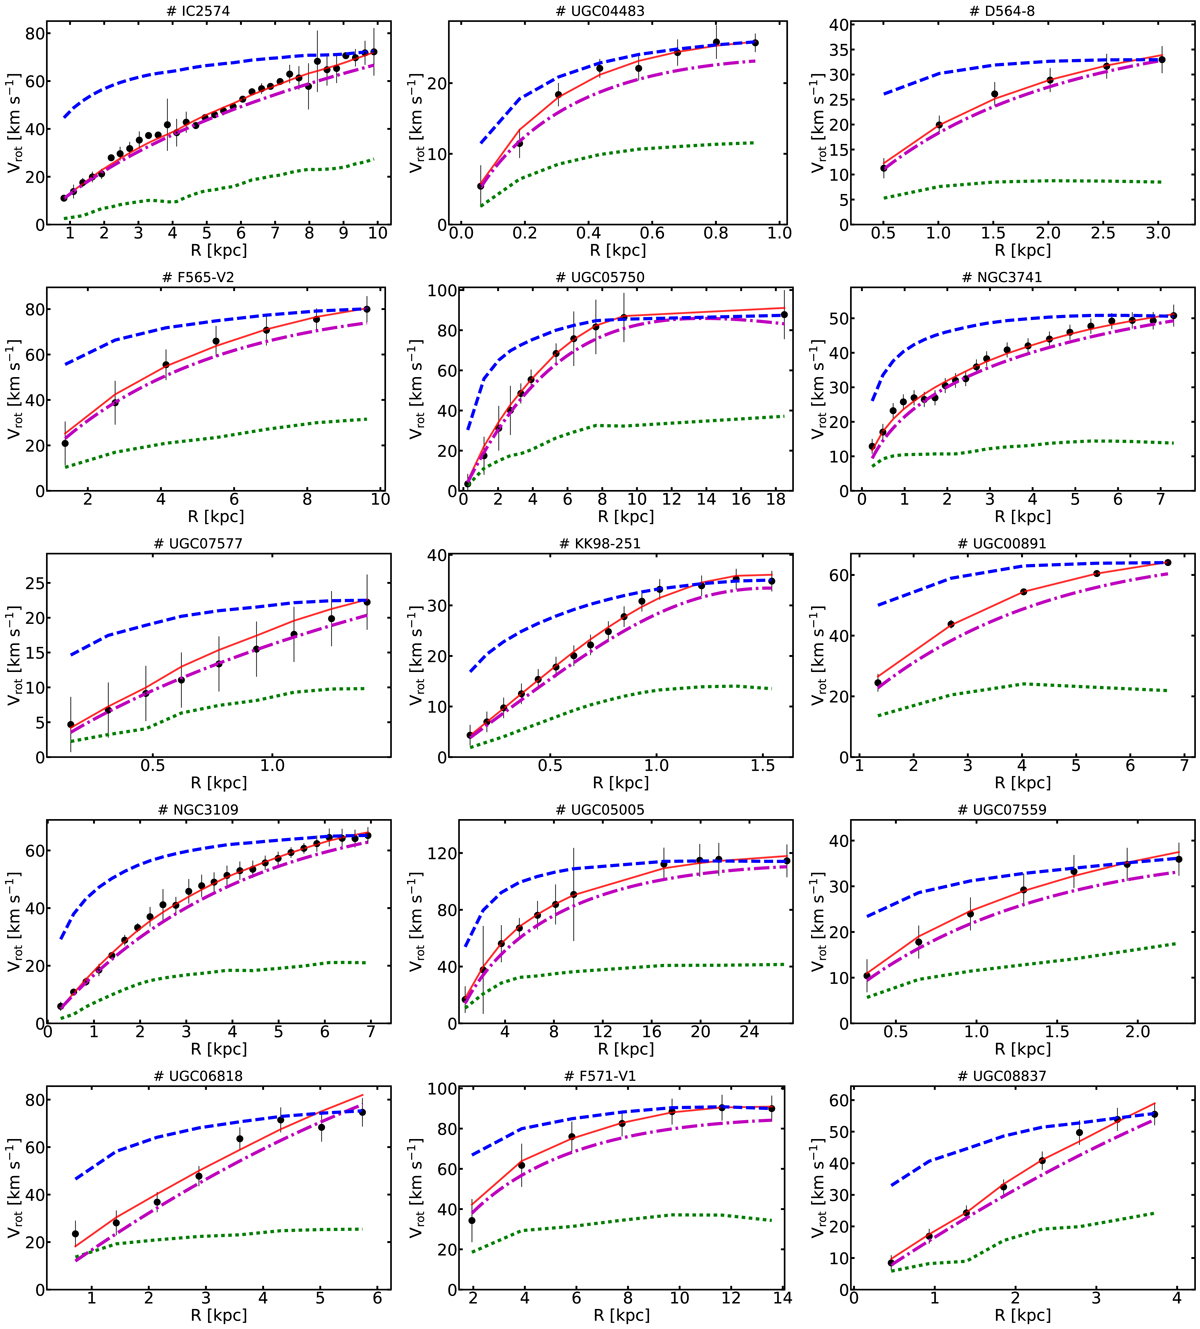
Rotation curve fits for SPARC galaxies with L18a parameters. In each panel the black dots represent the measured rotation velocities and their observational uncertainties. The red curves are the best fit curves to the data with our three-parameters fits. The green dashed curves represent the contribution of the baryonic matter to the rotation curves and the dark matter halo rotation velocities are plotted by violet dot-dashed curves. The blue dashed curves are there for visual comparison only, using n = 6 and the virial mass as the only free parameter to give an idea of the typical shape expected in the DMO case.
Current usage metrics show cumulative count of Article Views (full-text article views including HTML views, PDF and ePub downloads, according to the available data) and Abstracts Views on Vision4Press platform.
Data correspond to usage on the plateform after 2015. The current usage metrics is available 48-96 hours after online publication and is updated daily on week days.
Initial download of the metrics may take a while.