Fig. 3.
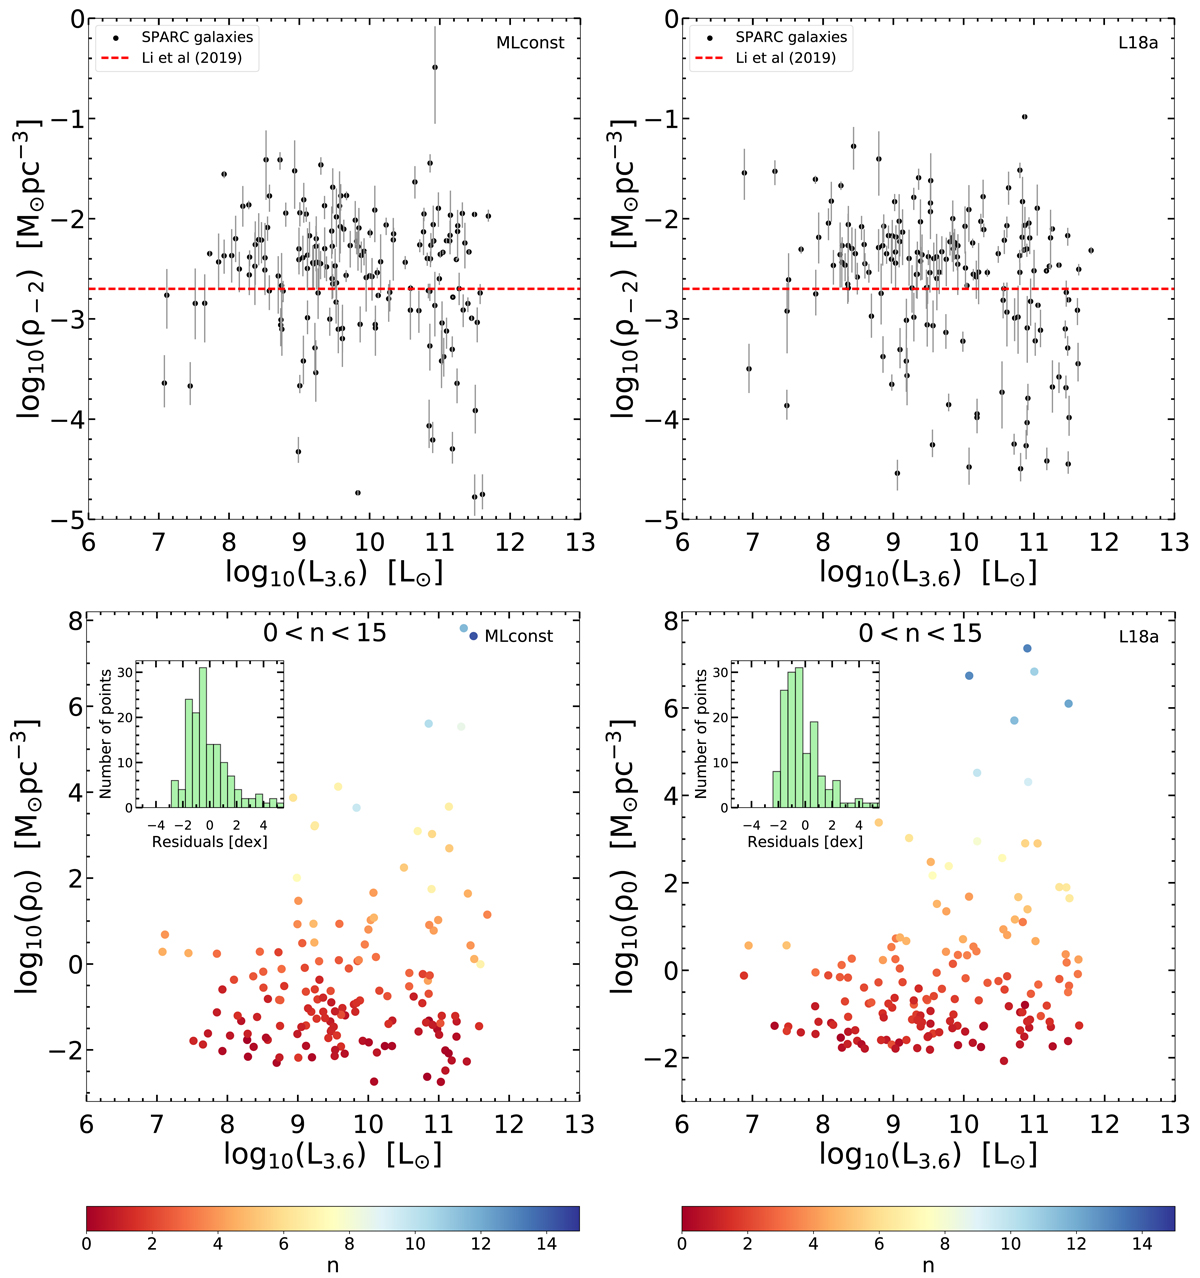
Top panels: characteristic density ρ−2 at the radius of density slope −2 vs. 3.6 micron luminosity (left panel: MLconst; right panel: L18a), compared to the density scale of Li et al. (2019). Bottom panels: central density ρ0 vs. 3.6 micron luminosity (left panel: MLconst; right panel: L18a), colour-coded by the value of the Einasto index n.
Current usage metrics show cumulative count of Article Views (full-text article views including HTML views, PDF and ePub downloads, according to the available data) and Abstracts Views on Vision4Press platform.
Data correspond to usage on the plateform after 2015. The current usage metrics is available 48-96 hours after online publication and is updated daily on week days.
Initial download of the metrics may take a while.