Fig. 10.
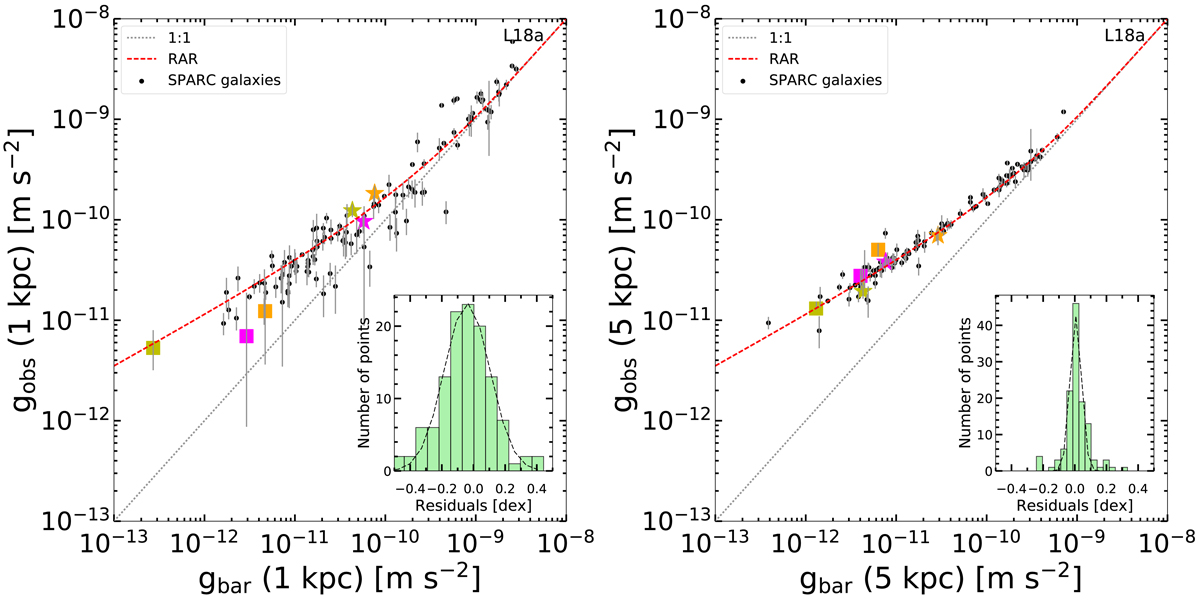
Left panel: RAR at 1 kpc with the L18a parameters. Observational errors from the rotation curve measurements are also plotted. The large errors seem to be associated with a downward scatter in gobs with respect to the RAR. Right panel: RAR at 5 kpc. The observational errors are small and the RAR is particularly tight at this radius. The six representative galaxies in Fig. 6 are displayed as in Fig. 9.
Current usage metrics show cumulative count of Article Views (full-text article views including HTML views, PDF and ePub downloads, according to the available data) and Abstracts Views on Vision4Press platform.
Data correspond to usage on the plateform after 2015. The current usage metrics is available 48-96 hours after online publication and is updated daily on week days.
Initial download of the metrics may take a while.