| Issue |
A&A
Volume 619, November 2018
|
|
|---|---|---|
| Article Number | A101 | |
| Number of page(s) | 18 | |
| Section | Galactic structure, stellar clusters and populations | |
| DOI | https://doi.org/10.1051/0004-6361/201832918 | |
| Published online | 13 November 2018 | |
GS242-03+37: a lucky survivor in the galactic gravitational field
Astronomical Institute, Academy of Sciences, Boˇcní II, 1401 Prague, Czech Republic
e-mail: This email address is being protected from spambots. You need JavaScript enabled to view it.
Received:
28
February
2018
Accepted:
6
August
2018
Abstract
Context. HI shells and supershells, found in discs of many galaxies including our own, are formed by the activity of young and massive stars (supernova explosions and stellar winds), but the formation of these structures may be linked to other energetic events, such as interactions of high-velocity clouds with the galactic disc. The larger structures in particular significantly influence their surroundings; their walls are often places where molecular clouds reside and where star formation happens.
Aims. We explore the HI supershell GS242-03+37, a large structure in the outer Milky Way. Its size and position make it a good case for studying the effects of large shells on their surrounding.
Methods. We perform numerical simulations of the structure with the simplified hydrodynamical code RING, which uses the thin-shell approximation. The best fit is found by a comparison with the HI data and then we compare our model with the distribution of star clusters near this supershell.
Results. The best model of GS242-03+37 requires, contrary to previous estimates, a relatively low amount of energy, and it has an old age of ∼100 Myr. We also find that the distribution of young star clusters (with ages <120 Myr) is correlated with walls of the supershell, while the distribution of older clusters is not. Clusters that have the highest probability of being born in the wall of the supershell show an age sequence along the wall.
Conclusions. GS242-03+37 is a relatively old structure, shaped by the differential rotation, and its wall is a birthplace of several star clusters. The star formation started at a time when the supershell was not already supersonically expanding; it was a result of the density increase due to the galactic shear and oscillations perpendicular to the disc of the Milky Way.
Key words: ISM: individual objects: GS242-03+37 / ISM: bubbles / open clusters and associations: individual: Pup OB3 / open clusters and associations: individual: NGC 2467
© ESO 2018
1. Introduction
The interstellar medium (ISM) is full of structures on all scales, from sub-parsec to kiloparsec. In the Milky Way, HI shells ranging in sizes from a few parsec to about 1 kpc were discovered first by Heiles (1979) and later by others: McClure-Griffiths et al. (2002), Ehlerová & Palouš (2005, 2013), and Suad et al. (2014). HI shells were also found in other galaxies (for a review on shells in external galaxies and an analysis of HI shells in THINGS galaxies, see Bagetakos et al. 2011).
Since the time of their discovery it has been speculated that HI shells are the result of the energetic activities of massive stars: winds, radiation, and supernova (SN) explosions. For many large shells, the energy involved in their creation must have come from the whole cluster of stars; from an OB association. Proving the connection between shells and clusters is not completely straightforward since many shells are older than the expected lifetime of massive stars and the results of such comparisons are often confusing and even contradictory Rhode et al. 1999; Stewart et al. 2000). The shells are like footprints remaining in the ISM after the cluster is gone. They should be able to survive encounters with random density fluctuations and stay coherent when they are deformed by the sheer due to galactic differential rotation. The statistical correspondence between HI shells and the CO distribution (Ehlerová & Palouš 2016) indicates that shells may trigger the formation of molecular clouds and new stars.
Many observational papers, both on the Milky Way and on external galaxies, show that HI shells frequently exist at large galactocentric distances, far from star-forming regions and often with relatively large sizes. This implies that alternative mechanisms might be employed to explain these structures: ram pressure (Bureau & Carignan 2002) or the infall of a high-velocity cloud to the disc (Tenorio-Tagle et al. 1987). These events might be responsible for a fraction of HI shells, but probably not for the majority.
HI shells evolve in gaseous discs. Once their dimensions are comparable to the disc thickness – which is not unusual – their shapes should be influenced by the large-scale density gradient in the disc and they may prolong in the z-direction (these prolonged shells are usually called worms). If the interior of the shell is still hot, that is, if the massive progenitor stars still exist, this hot gas may flow into the galactic halo (the worms become chimneys). In such a way HI shells may influence energetic flows in galaxies. For dwarf galaxies with low gravity (e.g. van Eymeren et al. 2009) or for starburst galaxies (e.g. M82), such an event could mean the loss of the hot gas to the intergalactic medium.
A number of HI shells fall into the category of supershells. Supershells are larger than “normal” shells, but above all they are more energetic, that is the energy needed to create them is much larger than one (or a few) supernova explosions. Sometimes the energy requirements for supershells are as high as 1000 SNe. That is why supershells are prime candidates for having a non-stellar origin, since only exceptionally large star-forming regions are able to produce such a large amount of energy.
Walls of shells and supershells are denser than their surroundings and are therefore places where star formation is likely to be triggered. Dawson et al. (2011, 2013) and Ehlerová & Palouš (2016) studied the connection between the (super)shells and the level of molecularization in the Large Magellanic Cloud (LMC) and in the outer Milky Way and found that supershells slightly increase the amount of molecules (and therefore slightly increase the star formation) compared to the situation without the shells. A recent example of the star formation triggered in the HI shell in the Magellanic Bridge is given by Mackey et al. (2017). Strange arcs of clusters in the LMC (Sextant and Quadrant) are also sometimes considered to be created by the HI shell (perhaps by LMC-4, as suggested in Efremov et al. 1999), but other theories have also been invoked (for a review concerning the origin of Sextant and Quadrant, see Efremov 2013). Physical processes and timescales involved in the triggered star formation, including the star formation triggered in HI shells, can be found in Elmegreen (2011).
GS242-03+37 is an HI supershell observed in the outer Milky Way. It is a dominant object observed in the HI maps of the Galaxy (see McClure-Griffths et al. 2006, for a detailed description of this structure). As one of the still rather enigmatic supershells, and as one of striking HI features, it merits being studied to better estimate its properties and to analyse its influence on its surroundings, both gaseous and stellar.
The paper is organised as follows: Sect. 2 describes datasets used in the paper, Sect. 3 deals with previous observations of the supershell GS242-03+37 and its properties. Section 4 gives an overview of the numerical code used for calculations. Section 5 compares numerical models with observations of GS242-03+37. Section 6 analyses the distribution of clusters in the vicinity of GS242-03+37 and Sect. 7 provides a summary.
2. Data
In our study we use HI and CO radio observations and further information about the star clusters in the area.
2.1. HI and CO
We use the all-sky HI4PI survey (HI4PI Collaboration 2016). This survey is based on the Effelsberg-Bonn HI Survey (EBHIS) for the northern hemisphere and the Galactic All-Sky Survey (GASS) for the southern hemisphere. The angular resolution of the HI4PI is θFWHM = 16′.2, the spectral resolution is 1.29 km s−1, the sensitivity is σrms ≃ 43 mK.
For CO we use the CO (J = 1−0) survey of Dame et al. (2001). It is a composite survey of the Milky Way, consisting of observations from several telescopes. In our studied region it covers the strip around the Galactic equator between b ∈ (-5°, +5°). The combined datacube (the so-called deep CO survey) that we use has a pixel size of 0.125° and a channel width of Δv = 1.3km s−1, the root mean square (rms) noise is 0.1 K.
2.2. Clusters
We take positions, distances, and ages of clusters from the catalogue of Kharchenko et al. (2013). The advantage of this catalogue – and the reason why we use it – is its homogeneity. Properties of clusters in this catalogue are calculated from the pipeline, which starts with the positions of clusters from previous catalogues, takes the stellar properties of stars from stellar catalogues, calculates the membership probability of individual stars, and using the theoretical stellar tracks derives the basic properties of the cluster. The catalogue is estimated to be complete to the heliocentric distance 1.8 kpc.
In our paper we use coordinates of clusters, their heliocentric distances, ages and (if available) the radial velocities1. Kharchenko et al. (2013) state that the relative error of the distance determination is 11%, and that the relative error of the age determination is between 25% (internal error, i.e. an error resulting from using the pipeline itself) and 39% (external error, i.e. from the comparison with other sources, which includes the errors of these other sources).
3. GS242-03+37
GS242-03+37 is a large prominent object, which dominates the HI distribution in the third galactic quadrant. It is visible in the velocity range ∼(+20,+65) km s−1 between l ∈ (230°, 255°) and b ∈ (−7°, +5°) (see Figs. 1 and 2). We start with the description of the HI gas around the supershell, then focus on the HI image of the supershell and its properties and describe the distribution of star clusters in this area. We end this section with remarks about other observed Galactic supershells.
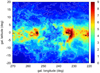 |
Fig. 1. Galactic supershell GS242-03+37: channel map integrated between +30 and +50 km s−1 (HI4PI survey). Thick black lines are the CO emission, which is only available for the strip b ∈ (-5°,+5°). |
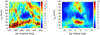 |
Fig. 2. PV-diagrams of the shell GS242-03+37: longitude–velocity diagram integrated between b = −1° and −3° (left panel) and latitude–velocity integrated between l = 241° and 245° (right panel). Thick black lines have the same significance as in Fig. 1. |
3.1. HI distribution around GS242-03+37
There should be three spiral arms in the direction of l ≃ 240°: the Local arm, the Perseus arm and the Outer arm. Unfortunately, while their presence is something most authors agree on, their distances are not that well known. Based on Koo et al. (2017) and Reid et al. (2014) we estimate the distance to the Local arm as being between 1 and 2 kpc, the distance to the Perseus arm as around 5 kpc and the Outer arm around 8 kpc (our assumed galactocentric distance of the Sun is R⊙ = 8.5 kpc). The most probable radial velocities connected with these arms are +20 km s−1 for the Local arm, +65 km s−1 for the Perseus arm, and +90 km s−1 for the Outer arm; but the ranges are wide, especially for the Perseus arm, which is bifurcated in the area (Koo et al. 2017).
The supershell GS242-03+37 at vLSR ≃ 37 km s−1 therefore lies in the inter-arm region. The blueward (i.e. approaching) wall coincides with — or lies in — the Local arm (or the HI overdensity which is associated with the Local arm). The redward (receding) wall might or might not coincide with the Perseus arm: the situation is complex, as obvious from Fig. 2, because the exact location of the spiral arm is not clear, but it is probably located at slightly larger radial velocities than the receding wall of our structure. The clear image, signs of the expansion in lb maps, and the presence of walls and a significant hole in lv and bv diagrams all strengthen the claim that the GS242-03+37 is a real structure, not just an inter-arm region.
We can estimate the HI density distribution from the HI brightness distribution by assuming the rotation curve (or more generally, the velocity field). We warn that this is only a very rough estimate, since 1) we deal with the expanding structure which involves non-rotational velocity per se, and 2) all other disturbances (e.g. spiral arms) add non-rotational velocities and therefore induce errors. Nevertheless, we can try and take the results, but with great caution. We use the rotation curve of Wouterloot et al. (1990)
 (1)
(1)
where R and V are the galactocentric distance and rotation velocity. The subscript ⊙ denotes the values at the position of the Sun, which we assume to be R⊙ = 8.5 kpc and V⊙ = 220 km s−1.
We do the conversion from temperatures TB to HI densities by summing and averaging the HI emission in cubes of 5° in l and 5 km s−1 in v and by fitting the Gaussian distribution of the HI density to average TB values for all these cubes for b between −30° and +30°. Results of the fitting are the maximum density n0, the position of the maximum density z0 and the thickness of the HI layer σHI for each position l and v. Maximum HI density n0 and the Gaussian thickness σHI for different positions in the Galaxy are plotted in Fig. 3, together with distances derived using the rotation curve given by Eq. (1).
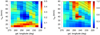 |
Fig. 3. Maximum density of the HI gas (left panel) and its thickness (right panel) based on simple conversion from HI data to the Gaussian HI gas distribution using the rotation curve. Black lines show galactocentric distances, starting from 10 kpc (the lowest line) with the 1 kpc increment. Densities are in at cm−3, thicknesses are in kpc. The supershell GS242-03+37 is clearly visible on both maps. |
Figure 3 shows the expected global decrease of density with the galactocentric distance RGC and the increase of the HI layer thickness with the increasing RGC. The warp (i.e. the offset between the nominal Galactic equator and a position of the maximum density in the HI layer) is also growing with the galactocentric distance (not shown). At the position of GS242-03+37 we see a hole in the density n0, which is at least partially real. Non-rotational velocities, which are not accounted for, may also contribute to the decrease of the density at the position of the expanding structure. A second interesting result is the local increase of the disc thickness at the position l = 242°, vLSR = 37 km s−1, with the maximum density slightly below the plane b = 0°. The disc appears inflated; this is in correspondence with the assumption of an energetic event which significantly disturbed the disc and which has not yet had time to relax.
3.2. Galactic HI supershell GS242-03+37
The galactic shell GS242-03+37 was first discovered and described by Heiles (1979), who also classified it as a supershell. It was later reidentified (in different data sets) by other authors, for example by Ehlerová & Palouš (2005, 2013), and McClure-Griffiths et al. (2006), but sometimes also not found, as in Suad et al. (2014) though they do identify many smaller structures in the vicinity of the supershell. The structure is visible in the velocity range ∼(+20,+65) km s−1 between l ∈ (230°, 255°) and b ∈ (-7°, +5°) (see Figs. 1 and 2). The lower boundary in b is slightly fuzzy and there are several possible walls; our best tip is around −7°. The densest parts of the HI supershell contain the CO emission.
McClure-Griffiths et al. (2006) describe the supershell GS242-03+37 as it looks in HI observations and other wavelengths. The main difference between their description and ours is the angular dimension of the structure, both in l and b. The angular dimension of the supershell in McClure-Griffiths et al. (2006) is 15°, while ours is 25°. The smaller dimension is based, as is evident from our Figs. 1 and 2 or from Fig. 3 in McClure-Griffiths et al. (2006), on the size of the hole, that is, the empty or low-density region.
ur estimate of the supershell size is based on the distribution of high-density walls and arcs around the low-density hole. Figure 4 shows cuts of one HI channel map along the lines of constant galactic latitude b. Tb profiles share many similarities (i.e. the low-brightness temperature region surrounded by higher-temperature walls), but there are many individualities in profiles. Some profiles show large temperature contrasts between the wall and the hole and the high steepness of the profile in the part corresponding to the wall (e.g. for b = 0° and the wall around l ≃ 230°), but others are less steep and have lower contrast. The wall at l ≃ 260° is particularly fragmented, which is certainly connected to the ongoing star formation in this region, as we demonstrate below. Walls shown in Fig. 4 are relatively thick. The vlsr velocity of the shown channel (42.5 km s−1) was chosen as one of those channels, where the supershell has the largest angular dimension. Nevertheless, profiles for another channel would show similar properties (e.g. McClure-Griffiths et al. 2006, gives another example of a high contrast TB profile). We define the angular size in l as the maximum of the angular distances between the maxima of the brightness temperature TB in the opposite walls in cuts across the shell, which yields a value of 25°.
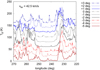 |
Fig. 4. Cuts of the HI channel map at vlsr = 42.5 km s−1 along the lines of constant galactic latitude b. Individual profiles are artificially offset by 20 K. |
The second difference between McClure-Griffiths et al. (2006) and our image of GS242-03+37 is the openness or elongation of the structure in the z direction. McClure-Griffiths et al. (2006) find HI caps at latitudes of ∼ +20° and between ∼−10° and ∼−20° (a part of this cap is marginally visible in Fig. 1). They conclude that GS243-03+37 is partially open to the galactic halo and that it forms several chimneys which channel the hot gas to high z. We cannot exclude the connection of observed higher b arcs to GS242-03+37, but we put a greater weight on the existence of (broken) arcs at latitudes of ∼+5°, ∼−7° and ∼−10°. Because these walls exist, the structure cannot be a fully blown-out shell. However, it is possible that the high-latitude caps were created by the hot gas leaking from the main body of the supershell, which nevertheless managed to avoid being completely broken during this process.
The usually adopted heliocentric distance of GS242-03+37 is 3.6 kpc, which corresponds to a radial velocity of 38 km s−1 for our rotation curve. For this distance, the diameter of the shell is 1.7 kpc for the angular size of 25° (or 1 kpc for 15°) and the FWHM thickness of walls is (120–250) pc. Estimating the shell radius as half of its angular dimension and expansion velocity as half of its velocity extent we get rsh = 850 pc and vexp = 20 km s−1. The volume density of the ambient gas is n0 ≃ 0.2 cm−3 (see Fig. 3).
The energy that created the shell can be estimated either from the measured kinetic energy (and assuming the ratio of the total to kinetic energy), or from the so-called Chevalier’s formula (Eq. (2); Chevalier 1974), which is based on MHD evolution of spherically symmetric supernova remnants, unfortunately without many physical processes. Therefore it is probably not accurate, but is a possible starting point.
 (2)
(2)
where Etot is the total energy involved in the creation of the structure, n0 is the density of the ambient medium, rsh the radius of the shell, and vexp its expansion velocity.
Both these methods give an estimate of ∼1054 erg (or thousands of supernovae) as the energy needed to create the supershell GS242-03+37. However, as rightly noted by McClure-Griffiths et al. (2006), the shell probably has the lower expansion velocity (vexp = 7 km s−1 rather than 20 km s−1); a part of the velocity extent of the shell (visible in Fig. 2) is caused by the galactic rotation, which substantially decreases the energy Etot required to create the supershell.
An interesting property of the shell is its age. From analytical solutions (see the Sect. 4) it follows that t = 0.4 rsh/ vexp (Sedov solution) or t = 0.6 rsh/ vexp (Weaver et al. 1977). Therefore, taking approximately one half of the ratio between the radius of the observed structure and its expansion velocity seems to be a reasonable estimate of its age, which is sometimes called the dynamical age of the shell.
 (3)
(3)
where tdyn is in Myr, rsh in pc and vexp in km s−1. For GS242-03+37, this gives ∼20 Myr (or 60 Myr for vexp = 7 km s−1).
3.3. Clusters around GS242-03+37
Figure 5 shows the heliocentric distances of clusters in the region l ∈ (224°,260°), b ∈ (−40°,+30°). Up to 1.8 kpc the catalogue is claimed to be complete and the surface density in this interval is nearly constant, about 120 clusters per kpc2. From this distance onwards the density is decreasing, both because of the increasing incompleteness and of the real decrease in the surface density (the increasing heliocentric distance in this direction means also increasing galactocentric distance). In Fig. 5 there are differences in the distribution of clusters based on their ages. The distribution shows no obvious or unambigious signs of the presence of the spiral arm.
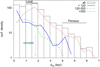 |
Fig. 5. Surface density of clusters in the region (l ∈ (225°,260°)) from Kharchenko et al. (2013) as a function of the heliocentric distance dhc. The histogram shows the density of all clusters; lines indicate the distribution of clusters with a certain age (blue: clusters younger than 120 Myr, green: clusters between 120 and 300 Myr, red: clusters older than 300 Myr). Positions of spiral arms (Local and Perseus) are indicated, as well as the limiting distance, where the catalogue is complete. |
3.4. Other supershells in the Milky Way
GS242-03+37 is not the only supershell observed in the Milky Way. A detailed description of some of the supershells and attempts to identify the energy source can be found in Maciejewski et al. (1996), Pidopryhora et al. (2007) and Park et al. (2016). The Aquila supershell (Maciejewski et al. 1996) has an estimated energy of 1052 −1053 erg deposited by SN explosions and stellar winds. Another example is the Ophiuchus superbubble (Pidopryhora et al. 2007) with an estimated total energy input of ∼1053 erg, which also originates from SNe and winds. The supershell GS040.2+00.6-80 is connected with a high-velocity cloud and probably created by its infall (Park et al. 2016). The first two objects are located in the inner Milky Way, the third one in the outer Galaxy.
Molecular emission from walls of supershells GSH287+04-17 (the Carina Flare supershell) and GSH277+00+36 is studied in Dawson et al. (2011) and McClure-Griffiths et al. (2003); for the Carina Flare supershell also in Wünsch et al. (2012).
4. Expansion of shocks in the ISM
When referring to the shell in this section and beyond, we refer to the whole structure, consisting of the (dense) wall and the (low-density) interior. We start with a general introduction to theoretical models of blast waves, continue with the description of our numerical model, and then present some results based on our simulations.
4.1. General introduction
The evolution of blast waves, either resulting from supernovae or stellar winds, expanding in the ISM has been described in many papers and books, for example by Ostriker & McKee (1988) and Bisnovatyi-Kogan & Silich (1995). Here we summarise very briefly how the blast wave, resulting from the supernova explosion, evolves. The first stage of the supernova explosion is the phase of the free expansion. This is followed by the so-called Sedov-Taylor phase characterised by the constant thermal energy inside the blast wave driving the expansion. When the radiative losses in the shell of the swept-up gas become important and the work done on the interstellar gas is thus radiated away, the dense wall of the shell behind the shock shrinks to a thin layer and the structure enters another phase. When the pressure inside the shell drops, the wave is not driven by the interior pressure anymore and it only keeps its momentum – this is the so-called snowplough phase. Later, when the expansion velocity decreases below a local sound speed, the thin wall moves balistically in the gravitational field of the galaxy.
The evolution of the shell in the Sedov-Taylor phase is described by the self-similar Sedov solution:
 (4)
(4)
 (5)
(5)
where rsh is the radius of the shell, vexp its expansion velocity, t is the time since the beginning of the expansion, E0 is the energy of the explosion, and ρout = μn0 is the mass density of the ambient medium (μ is the average mass of the particle).
It is possible to derive solutions for other phases of the blast wave evolution (we refer to Dopita & Sutherland 2003, chapter 8). Here we give the solution derived by Weaver et al. (1977) for models with a continuous energy supply; for example, for shells powered by stellar winds.
 (6)
(6)
 (7)
(7)
where Lsource is the energy flux from the source.
In both these sets of equations (Eqs. (4) and (5) plus (6) and (7)), the parameter is the ratio between the inserted internal energy E0 or an energy flux Lsource and the density ρout. This degeneracy makes it difficult to estimate both of these quantities from measurable shell sizes and expansion velocities.
4.2. Description of the RING code
Our model assumes that the wall of the shell is infinitesimally thin, that is, its thickness is much smaller than its diameter. This approach was developed by Kompaneets (1960), and Bisnovatyj-Kogan & Blinnikov (1982) and used by Tenorio-Tagle & Palous (1987), Ehlerová & Palous (1996), Silich et al. (1996) and others.
The time evolution of the wall is calculated in three dimensions. The wall is divided into nl layers and every layer into np elements (there are typically around 1000 elements altogether).
The expansion starts from a small spherical volume. The total initial mass is the same as what would be necessary to fill the initial volume with the density of the surrounding ISM ρout at the centre of explosion, this mass is distributed evenly to all elements. Into this small initial volume we insert the initial thermal energy  , and the shell gets the initial kinetic energy
  (the ratios are based on the wind solution by Weaver et al. 1977). The remaining
  is the initial thermal energy of the shell, which (as explained above) is radiated away.
The thermal energy of the shell interior Eth, in follows the energy balance equation
 (8)
(8)
where Lsource is the energy flux from the source (young stars or supernovae) and Vin and Pin are the volume of the shell interior and its pressure. Our adopted thin-shell approximation assumes that the thin shell behind the leading shock has such a high density that it is able to radiate away all the thermal energy produced by compression of the ambient medium by the shock (the last term in Eq. (8)). On the other hand, cooling of the low-density medium in the shell interior is very small and is disregarded.
The pressure inside the shell follows the equation:
 (9)
(9)
The energy is supplied continuously and constantly with a flux Lsource during the time interval tenergy. When the time t > tenergy, the energy supply is stopped. The time interval tenergy is one of the free parameters in our model. If tenergy equals zero, all energy Eth, in is delivered abruptly at the beginning of the expansion.
For each element of the thin wall we solve the momentum and mass equations. The momentum equation is
![Mathematical equation: $ \begin{eqnarray} {{\rm d} \over {\rm d}t}(m_{\mathrm{i}} \vec{\rm v}_{\mathrm{i}}) + \rho_{\mathrm{out}} [\vec{\rm S}_{\mathrm{i}} . (\vec{\rm v}_{\mathrm{i}} - \vec{\rm v}_{\mathrm{out}})] \vec{\rm v}_{\mathrm{out}} = (P_{\mathrm{in}} - P_{\mathrm{out}})\vec{\rm S}_{\mathrm{i}} + m_{\mathrm{i}}\vec{\rm g}, \end{eqnarray} $](/articles/aa/full_html/2018/11/aa32918-18/aa32918-18-eq13.gif) (10)
(10)
where mi is the mass of an ith element, Si is its surface (i.e. the surface multiplied by the normal vector), vi is its velocity of expansion, vout is the velocity of the medium outside of the shell, Pin and Pout are the inside and outside pressures, ρout is the density of the medium outside of the shell, and g is the gravitational acceleration in the Milky Way.
When the expansion of the shell is supersonic, the supershell collects the ambient medium. For each element, when the velocity component perpendicular to the shell surface v⊥ = (vi - vout)⊥ exceeds the local speed of sound, the mass accumulation is given as
![Mathematical equation: $ \begin{equation} {{\rm d}m_{\mathrm{i}} \over {\rm d}t} = \rho_{\mathrm{out}} [(\vec{\rm v}_{\mathrm{i}} - \vec{\rm v}_{\mathrm{out}})\cdot\vec{\rm S}_{\mathrm{i}}]. \end{equation} $](/articles/aa/full_html/2018/11/aa32918-18/aa32918-18-eq14.gif) (11)
(11)
When v⊥ drops below the local sound speed the accumulation of mass is stopped. From that time on the element continues its expansion in the gravitational potential of the galaxy in the ballistic way. Individual elements of the shell are completely independent of each other; they are not influenced by the low-density hole inside, nor do they influence it.
In a homogeneous medium with no external forces from the Milky Way, our numerical solution agrees with the solution given by Weaver et al. (1977).
In the Milky Way, shells evolve in the differentially rotating disc, which is described by the rotation curve (Eq. (1), Wouterloot et al. 1990). The rotation curve defines the two components of the gravitational acceleration parallel to the galactic disc. The component of the gravitational acceleration perpendicular to it, gz, is approximated by the formula (Kuijken & Gilmore 1989)
![Mathematical equation: $ \begin{equation} g_z = -2 \pi G z \left[{\Sigma_{\rm D} \over (z^2 + z_{\rm D}^2)^{1/2}} + 2 \rho_{\rm H}\right], \end{equation} $](/articles/aa/full_html/2018/11/aa32918-18/aa32918-18-eq15.gif) (12)
(12)
where z is the distance perpendicular to the galaxy plane, zD is the disc thickness, σD is the disc surface density, and ρD is the halo density. We adopted the following values: zD = 300 pc, σD = 46 M⊙ pc−2, and ρH = 0.015 M⊙ pc−3.
The distribution of the ISM is a free boundary condition. In this paper we use homogeneous or Gaussian distribution with the midplane density and the thickness as parameters. More specific distributions, such as Dickey & Lockman (1990), can be easily used in the code, however, for the purposes of this paper the single component disc was sufficient. We do not take into account the small-scale clumpiness and the chaotic nature of ISM; we assume these inhomogeneities flatten out on a larger scale.
4.3. Examples of simulated expanding supershells and the wisdom learned
There are three quantities that dominate the evolution of expanding shells: 1) the density distribution, that is, the stratification of the ISM; 2) the galactic gravitational potential, that is, the rotation velocity Eq. (1) and the gz potential Eq. (12); and 3) the amount of energy added to the shell. In this section we try to present the most important conclusions showing the dependence of observable quantities on these three input parameters (the density stratification, the galactic potential, and the energy input).
Models described in this section and shown in figures are calculated for the mid-plane density 0.2 cm−3 and the energy input of 13 × 1051 erg delivered during 15 Myr (these rather strange numbers are chosen because, as shown later, they are parameters of the best fit to the studied supershell). The galactic potential – if used – corresponds to the galactocentric distance of 11 kpc.
Figures 6 and 7 show the time evolution of an expanding supershell. Figure 6 gives the cuts through the shell at the galactic plane z = 0, and Fig. 7 shows the shape of the shell in the direction perpendicular to the disc.
Figure 6 (left) shows an evolution in the homogeneous medium with and without the external gravitational potential. While the shell evolving without the external gravitational field remains spherical, the shape and orientation of the structure in the external field change due to the differential galactic rotation, the shell becomes more and more twisted with time. At young ages (10 Myr) this influence is small, but at later times (> 50 Myr) this distortion, and the difference from the case without the galactic differential rotation, becomes significant.
The right panel of Fig. 6 shows the outlines of different models at the evolutionary time 50 Myr: two homogeneous cases (the one in the left panel and the other one with 5x the energy input) and shells evolving in Gaussian density discs with scale heights of 500 pc, 300 pc, 200 pc and 100 pc. For all cases, models with and without the galactic potential are shown. There is no significant difference between models evolving in the homogeneous medium and in thick discs (scale heights larger than or equal to 200 pc). Larger energy inputs create larger shells (as expected). Shells in thin discs are slightly smaller than the shells with the same energy evolving in the thicker discs. This is due to the expansion to the galactic halo.
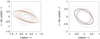 |
Fig. 6. Evolution of the shell calculated by the RING code; cuts are in the galactic plane (10, 30, 50, 70, 90, 110 and 130 Myr; left panel), dashed lines correspond to the model without the galactic potential, solid lines show the model with the potential. Right panel: evolutionary time 50 Myr for different models: homogeneous medium (black), homogeneous medium with 5x larger energy input (grey), Gaussian density disc with scale heights of 500 pc (blue), 300 pc (green), 200 pc (brown) and 100 pc (red). Dashed and dotted lines show the situation without the galactic potential, solid lines the situation with the galactic potential. Axes are labelled in kpc. |
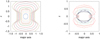 |
Fig. 7. Evolution of the shell calculated by the RING code; cuts are perpendicular to the galactic plane (10, 30, 50, 70, 90, 110 and 130 Myr; left panel). Dashed lines corresponds to the evolution in the homogeneous medium, solid lines show the Gaussian profile with the scaleheight of 200 pc. No galactic potential is taken into account. Right panel: evolutionary time 30 Myr for different models: homogeneous medium (black), homogeneous medium with 5x larger energy input (grey), Gaussian density disc with scale heights of 500 pc (blue), 300 pc (green), 200 pc (brown) and 100 pc (red). Dashed and dotted lines show the situation without the galactic potential, solid lines the situation with the galactic potential. Axes are labelled in kpc. |
Figure 7 shows the influence of the density stratification of the gaseous disc. The left panel shows the evolution of two models: a shell in the homogeneous density and a shell evolving in the Gaussian disc with a scale height of 200 pc. No galactic potential is included. In the case of the evolution in the homogeneous medium the shell remains spherical and its expansion slows down. In the case of the stratified disc, the shell becomes elongated along the density gradient (it becomes a “worm” in the terminology of HI shells). Its upper and lower parts may accelerate and the blowout may occur (in the shown case, the blowout is not really prominent, but the structure is significantly elongated). The elongation of the structure caused by the density gradient is significant already at early times.
The right panel of Fig. 7 illustrates the effects of the galactic acceleration gz at the evolutionary time 30 Myr. Six different models are shown: two homogeneous cases (the one in the left panel and the other one with 5x the energy input) and shells evolving in Gaussian density discs with scale heights of 500 pc, 300 pc, 200 pc and 100 pc. For all cases, models with and without the galactic potential are shown. Due to the galactic gz potential shells are more flattened (compared to no-potential case). At later times, the individual parts of the structure begin to oscillate around the galactic plane (see Fig. 10, right) and the z-profile of the shell ceases to hold any information on the density stratification it had during the young age.
According to analytical solutions of Sedov (Eqs. (4) and (5)) and Weaver (Eqs. (6) and (7)) describing shells in a homogeneous medium without the external gravitational field, quantities rsh and vsh depend on the ratio E0/nout or Lsource/nout. Figures 9 and 10 study these degeneracies for shells evolving in stratified density discs and with the external gravitational potential. The basic model is shown together with a model with ten times higher energy flux and density and with a model with ten times lower energy flux and density; all three models having the same ratio Lsource/nout. Figures show that the ratio Lsource/nout is really the dominating quantity and that the degeneracies derived for simple models appear also in stratified discs with gravitational potential.
Shells evolving in the differentially rotating and z-stratified galactic discs are no longer spherical. We characterise them with the maximum rmax, minimum rmin and average rave radii in the z = 0 plane, and with the maximum z distance of the shell caps (see Fig. 10 for the time evolution). The average radius rave is calculated as the average value of the radius along the whole perimeter of the shell at the galaxy plane (z = 0).The value of rave computed with the gravitational potential does not differ significantly from the case without the potential, but rmin and rmax are significantly influenced (Fig. 10, left), since the shell evolving without the external gravitational potential remains spherical.
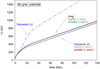 |
Fig. 9. The radius rsh of the shell as a function of time, calculations of the RING code, the evolution without the external gravitational potential. Black and green lines correspond to the evolution in the homogeneous medium, blue and red lines to the evolution in the Gaussian disc with the thickness of 200 pc. Black line is the basic model, green lines (dashed and dotted, respectively) correspond to models with 10x higher and smaller energy inputs with adequately higher and smaller densities (L/n are the same for all models). Blue lines show the radius of the shell in the plane (solid) and the z-extent (dash-dotted) for the basic model. Red and orange lines again correspond to models with higher and smaller energy inputs and densities, respectively. |
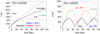 |
Fig. 10. Radius rsh of the shell as a function of time, calculations of the RING code, the evolution with the external gravitational potential: the radius in the plane (left panel) and the z-extent (right panel). Left panel: black colour corresponds to the basic model, blue colour to the model with 10x higher energy input and density, red colour to the model with 10x lower energy input and density. Different line types are dedicated for the average values rave (solid), the maximum rmax (dashed) and minimum rmin (dotted) values. Right panel: z-extent of the basic model in the homogeneous medium (black), the Gaussian distribution with a thickness 500 pc (blue) and Gaussian distribution with a thickness of 200 pc (red; models with 10x higher and lower energy input and density are added). In both panels the basic model from Fig. 9 is overlaid in green. |
The right panel of Fig. 10 shows the time evolution of the maximum z-extent of the shell under the influence of the gravitational potential of the Galaxy. After the initial stage of the supersonic shell expansion, the trajectories of shell fragments oscillate around the Galactic plane. This motion increases the wall density at times when fragments are close to the plane. Trajectories are synchronised because they start from initial conditions given by the expanding shell and therefore evolve in a similar way. The period of oscillations depend on the z-profile of the gravitational potential, which depends on the surface density of the (stellar) disc and on the halo density (through Eq. (12)), and also on parameters of the shell.
An important quantity is the thickness of the gaseous disc. Shells in a non-stratified disc or shells in thick discs (∼500 pc) evolve in a very similar manner. If the shell is significantly elongated (∼200 pc) or even if it ventilates a part of its energy to the halo (for shells in thin discs), the evolution is slightly different. It takes a longer time before the attractive force of the galactic disc overwhelms the expansion for the highest (or lowest) parts of the shell (=caps) — in extreme cases these parts can be thrown away from the disc and from the galaxy, but these cases are not described in this paper.
These z-oscillations do not influence the in-plane evolution of the shell, since they occur in later times of the shell evolution, when the motion is subsonic and when the shell is no longer driven by the interior pressure (as in Eq. (10)) and when it no longer accumulates new mass (as in Eq. (11)); it only moves balistically in the external gravitational potential.
To summarise results of this subsection: there are two broadly defined epochs in the life of the structure. The first epoch (coincident with the young age and the expansion phase) is characterised by the small dependence on the gravitational potential and (after very early time) the large dependence on the density stratification. The second epoch (old age or the ballistic phase) is characterised by the large dependence on the gravitational potential and the small (or hidden) dependence on the density stratification. In the case described in this section, the division line lies somewhere between 30 and 50 Myr. The evolution of shells in gaseous thick discs (in our case meaning with Gaussian scale length ≥300 pc) is similar to the evolution in the homogeneous medium, that is, the influence of stratification is negligible. Thinner discs are different: shells experience the blow-out which leads to the energy leakage, in-plane sizes are smaller and the shell is clearly elongated in the direction perpendicular to the disc.
Experiments with other values would lead to similar qualitative results, with slightly changed intervals for the young/old age of structure, or the value dividing thin and thick discs.
5. Models versus observations
Our aim is to compare observations of the supershell GS242-03+37 with RING models and obtain an estimate of the energy input needed to create the shell, its age, and its position in the Galaxy. This section first describes how we found the suitable model and then the model itself.
HI observations provide us with information about the brightness temperature at two spatial coordinates and one velocity coordinate (l, b and vlsr). We can get the same information from numerical models and directly compare them; but looking at the beautiful image of the supershell in Fig. 1, with many small-scale substructures and irregularities, we become slightly sceptical about the reasonability, stability, and credibility of a direct comparison of 3D datacubes with models of expanding shells in a smooth medium: would it really be dominated by the large-scale influences (which are the only ones we can test with our models) or not? We believe that the main shape of the structure, resulting from the effects of the galactic potential and the large-scale density distribution, is only partially “smeared” by the noise connected to the small-scale perturbations (mostly density perturbations but also velocity ones), and that the overall form is kept. Therefore, we fit the outline of the simulated model to the outline of the observed structure.
As explained in the previous section, shapes of modelled shells mostly depend, based on their age, either on the density distribution (in case of young structures) or on the galactic potential (for old structures). From the in-plane outline of the shell we can estimate its age and if it is young, we can then try to estimate the density profile of the disc.
In the case of HI observations we do not know the distance, only the radial velocity, therefore an xy shape of the supershell in the galactic plane is not explicitly known. We can however compare the observed lv (position-velocity) information to our simulations, assuming the position of the shell and the rotation curve. Figure 8 shows the evolution of the same models as in Fig. 6; the centre of the model is placed at the heliocentric distance dhc = 4 kpc, l = 244.5° and b = 0°. We also see a very small dependence on the density stratification in these in-plane cuts, and for older ages a large dependence of the shell lv-shapes on the galactic potential.
Therefore we reduce the HI observations to an lv outline of the structure, which we construct in the following way: for each lv map at latitudes b ∈ (−3.5°,+0.5°) we draw the best outline (using pieces of walls or clumps along the perimeter and interpolating between them) and then we calculate their average. The resulting curve is shown in Fig. 12. As we are mostly interested in large-scale influences, the small inaccuracies are not overly important. The range in b from which we calculated an average was chosen because neither the size of the structure nor its shape changes significantly in this interval (as can be seen in the bv map in Fig. 2). Outside this interval the shell is diminishing and/or disappearing from view.
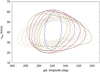 |
Fig. 8. The evolution of the shell calculated by the RING code, lv-diagram, at times (10, 30, 50, 70, 90, 110 and 130) Myr. Dashed lines correspond to the model without the galactic potential, solid lines to the model with the potential. |
5.1. Finding the good model
With our models we try to fit the average measured lv-outline of the GS242-03+37 supershell. We have several parameters to fit:
Position of the structure, that is, the position of its centre. We know (from pictures) that the centre should be located around l = 242° at the heliocentric distance dhc ≃ 3.6 kpc, but we vary these positions. l and dhc are free parameters, not input values, and we get their best estimates from the best fit. Since we only fit the lv-outline, the b coordinate is not important and we do not search for it. From Fig. 2 it is seen that the maximum density lies at around b = −2°, because the HI disc at this longitude and galactocentric distance is already warped from its central position b = 0°.
Energy input, that is, the amount of energy delivered to the structure and the time interval during which it is released.
The density distribution is not a free parameter. As we have shown above, the lv-outline of the shell does not depend on the stratification in the case of the thick disc, therefore we let the shell evolve in a homogeneous medium with the density n0 = 0.2 cm−3.
The age of the structure is mostly not a free parameter, unless stated otherwise. We take the age of the best fit for a given position, energy, and density distribution.
Tested ranges for the parameters were: l ∈ (238,250)°; dhc ∈ (3,5) kpc; E0 ∈ (0.1,100)× 1051erg; Lsource ∈ (0,20) × 1051erg Myr−1; tenergy ∈ (0,20) Myr; the total energy is Etot = E0 + LsourceTenergy. The density of the homogeneous medium in which the supershell evolves (n0) is fixed, because it is an estimate of the observed average density at the position of the shell. As we have shown in the previous section, the evolution of the shell, even for more complex models, depends on the ratio L/n0, so in cases where our chosen density is shown to be too low or high (0.3 instead of 0.2 e.g.), we can easily rescale the fit.
The model lv-outline from the RING code (as in Figs. 8 or 12) is compared to the measured lv-outline. From the previously given net of parameters we find the best, that is, most acceptable, fit with values: l = 244.5°, dhc = 4.0 kpc, Lsource = 0.8× 1051 erg Myr−1, tenergy = 15 Myr. The total energy of this model is Etot = 13 × 1051erg. The corresponding age of this fit is τ = 120 Myr. This is what we refer to in the following text and in the description of figures as the “basic model”.
The fitted heliocentric distance of the shell is larger than the distance from a simple estimate based on the “central” velocity of the structure, as given in Sect. 3. This simple estimate corresponding to the radial velocity of 38 km s−1 is dhc = 3.6 kpc, but best fits to observations favour the larger distance of dhc = 4 kpc. Given the fact that the shell is large and its shape and velocity field are distorted by the differential rotation, it is not surprising that there is a small difference between these two estimates.
Figure 8 shows the lv evolution of the basic model. Figure 12 shows the best fit of the basic model at τ = 120 Myr and also the best fit of the model, which has the twice larger energy input (Lsource = 1.6× 1051erg Myr−1); the best age in this case is 100 Myr. This comparison also illustrates how the best fit should be treated: as a representative of a family of suitable fits. Slightly changing one parameter of the fit would produce reasonable results; changing it too much damages the fit. This “uncertainty” is mostly connected to uncertainties and free will in the definition of observed shape and size of the shell, and to a lesser degree to inherent degenerations of parameters, like the E0/n0 degeneracy discussed previously.
Our model predicts that the shell was supersonically expanding for the first ∼30 Myr of its evolution and now it propagates as a sound wave with the velocity of ∼7 km s−1. Its large observed velocity extent is mostly caused by the galactic rotation. This agrees with the result derived by McClure-Griffiths et al. (2006).
An important aspect of our best fit is the old age of the structure, seemingly inconsistent with the simple age estimate of Eq. (3) (∼20 Myr). This young age is obviously very different} from the age derived from the fit. The main reason for the discrepancy is the influence of the galactic gravitational field, which causes the galactic shear. Figure 11 shows how the dynamical age of the simulated structure derived using Eq. (3) changes with time. For rsh and vexp we use
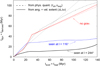 |
Fig. 11. Dynamical age tdyn (Eq. (3)) as a function of the real evolutionary time tevol for the basic model. Dashed lines are calculated from sizes and velocities taken directly from models, and solid lines are solutions derived from angular sizes and velocity extents corresponding to methods used in the Milky Way. Red colour is the model without the external gravitational potential (e.g. without the galactic shear). Black and blue lines correspond to the same model but viewed, at each time tevol, at a specified position in the Milky Way: at l = 244° (black) and at l = 116° (blue, symmetrically around the anticenter line). The grey dotted line is the analytical solution (Weaver et al. 1977). |
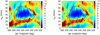 |
Fig. 12. lv-diagram of the supershell GS242-03+37 with the outlines. Left panel: outlines of the best model (“basic model” at 120 Myr, blue/white), the model with twice the energy input at 100 Myr (violet/black), and the approximate outline of the observed structure (grey line). Right panel: outlines of the best (basic) model (blue/white) and of models with the fixed ages (40 Myr: green/black; 80 Myr: violet/black). HI map is underlined; black contours show the CO emission. The colour scale is |

rsh and vexp, which are calculated as the average values of the model in the galactic plane (dashed line in the Fig. 11), this method is available only for models, not for real structures observed in the Milky Way;
rsh and vexp, which are derived from measured dimensions Δl and Δv of the shells and from the assumed distance to the shell (solid line in the Fig. 11), this is the way used for observed structures.
Calculations are done for the shell located at l0 = 244.5°, that is, for the real position of the supershell (black lines in the Fig. 11) and also for the symmetrically positioned shell at l0 = 115.5° at the same galactocentric distance (the blue line). Method 1, which uses real radii and velocities of the model, gives the same values for both positions (i.e. for all positions, which differ only in the galactic longitude). To see the effect of the diffential rotation we overplot the model calculated without the external gravitational field in Fig. 11 (red lines). The analytical solution of Weaver et al. (1977) is shown as the green line. The energy input to the shell is stopped at 15 Myr, which leads to deviations from the analytical solution even for the simple shells evolving without the external gravitational field. These deviations are not substantial, however, and the simple estimate gives a reasonable value for the dynamical age. Even method 1, using the average values of radius and expansion velocity of the shell, works reasonable well (unfortunately, for real observed structures in the Milky Way we cannot use it). Method 2, using the projected angular and velocity dimensions, gives incorrect values, which are dependent on the direction in which we observe. In our case simulations predict that the dynamical age derived from the Δl and Δv is nearly constant with time (and therefore not usable at all). The main reason for this behaviour is the falsely higher expansion velocity, which is due to the galactic shear, not due to an expansion. The derived radius is also dependent on the direction in which we observe (the difference between shells at l0 = 244.5° and l0 = 115.5°), because it decides if we observe along the major or minor axis of the shell (see Fig. 6 for differences in sizes). Our modelled shell, that is, the basic model at the position l0 = 244.5°, is observed not directly along the minor axis, but nearly so (as is shown in Fig. 14 below), therefore its angular dimension almost corresponds to its largest size.
5.2. Models with the fixed age of the shell
The models described above have several free parameters: l and dhc describing the position of the centre of the supershell, Lsource and tenergy for energy requirements, and the age of the structure τ, which is a result of the search for the best fit. But τ can also be fixed. To see results for younger structures we made calculations with the same free parameters as above (l, dhc, Lsource, tenergy), but this time fixing the evolutionary time (i.e. the age of the structure). In Fig. 12 (right panel) we show the best results for shells with ages 40 and 80 Myr. The total energies of these models are 1.2×1053 erg for τ = 40 Myr and 3.0×1052 erg for τ = 80 Myr.
The 40 Myr model does not give a good fit. To reach such a large size in a relatively short time the structure needs a lot of energy and therefore its expansion velocity is large. The combination of demands on the size and on the velocity does not give a satisfactory result: even the best fit shown in Fig. 12 underestimates the angular size and overestimates the velocity extent.
A fixed age of 80 Myr is a better condition for the shell. However, the agreement between the model and the observations is still not as good as for our basic model at 120 Myr, especially around l = 252°. The 80 Myr model perhaps also predicts the v-extent to be too large – reaching lower radial velocities than observed – but it fits observations better than the younger model and might be acceptable.
5.3. Is our best model physically acceptable?
As stated above, the most surprising result of our modelling and fitting is the large age of the supershell. The simple dynamical age of the shell based on Eq. (3) is 20 Myr (assuming that the velocity interval in which we observe the shell corresponds to the real expansion velocity; if the shell does not expand supersonically, but is already stalled, its dynamic age is therefore ∼70 Myr). Our fit is 80–120 Myr, with the best fit corresponding to 120 Myr. The major issue is not only the simple discrepancy between these numbers, but the large age itself. Can a supershell survive for such a long time?
There are several ways how the shell can disappear: by dissolving into the ISM, by being destroyed in a collision with a different structure, by twisting too much by the differential rotation, and by the passage of the spiral arm. We discuss these separately below.
5.3.1. Dissolution into the ISM
The shell can simply dissolve after it ceases to expand supersonically (referred to in Oey & Clarke 1997, as the disintegration of their stalled shells). This dissolution can take place either via dissollution of the dense walls of the shell or via the flow of ambient medium from the unperturbed medium outside the shell to its low-density interior. Efficiency of the wall dissolution and the hole refilling (and probably also the steepness in density contrast between a shell interior and its walls) depend on the compactness or fragmentation of dense walls.
Shells are subject to different fragmentation processes. Dove et al. (2000) discuss the Rayleigh–Taylor and gravitational instabilities and they conclude that fragmentation of a shell is likely to start about 30 Myr after the beginning of energy injection, at the time when the supershell collects enough mass, when it cools, and when it increases the density contrast between the shell wall and the hot gas in the interior. For our model, this fragmentation time is also the time when the expansion of the shell starts to be subsonic. After that point, fragments expand ballistically in the gravitational field of the Galaxy and are not influenced by each other or by the low-density hole swept-up in the ISM. Instabilities and fragmentation of pressure confined self-gravitating layers is also discussed by Dinnbier et al. (2017) using results of hydrodynamical simulations.
Clumps in walls of GS242-03+37 are visible in Figs. 1, 2, and 4, but the structure — both dense walls and the low-density hole — keeps its coherence. The lifetime of individual fragments in walls depends on their size, temperature, and density. Some less dense and hotter fragments probably dissolve and contribute to the density of the interior gas. Remaining fragments are observed in HI and CO at the rim of the GS242-03+37. The volume density inside the fragments in the wall may be substantially larger than the density of the ambient medium n0. The self-gravity of these denser fragments probably helps in maintaining the high contrast between walls and an interior by slowing down the process of evaporation from the clumps and their subsequent dissolution.
A rough estimate of the importance of the self gravity is the ratio between the mass of the fragment and its virial mass: if it exceeds 1 (or, given all the uncertainties, close to one), the self gravity is important. This ratio is
 (13)
(13)
where Δ sfr is the size of the fragment in pc, Nfr,20 its column density in 1020 cm−2 and σ its velocity dispersion in km s−1. The average column density of the supershell is (1−2)× 1020 cm−2, calculated as the total mass divided by the surface (from which Nfr = rsh n0/3). For fragments with sizes of about 100 pc, comparable with the thickness of the shell, and for the purely atomic gas with σ ∼ 10 km s−1 the ratio is very small (∼0.02). However, if the fragment is cold, its velocity dispersion can decrease to 2−3 km s−1. Consequently the ratio Mfr/Mvir is much higher and therefore the self-gravity is more important.
Refilling of the shell interior from outside can start when the shell stops the supersonic expansion and slows down to the speed of sound in the ambient medium. A hole with a diameter of 1 kpc can be refilled, perhaps not completely but significantly, in about 50 Myr (assuming the speed of sound cs = 10 km s−1). However, GS242-03+37 is filled but not significantly (the ratio between the derived interior and outside volume density is about 1/4; see Fig. 3). Are there mechanisms that might prolong the refilling? First, if the fragments are cold, either molecular or cold atomic, the ambient gas can only flow to the interior through gaps in fragmented walls since the cold fragments interact with the warmer and supersonically moving gas flowing from outside. If the majority of the wall is made from cold dense fragments, the refilling is substantially lowered. This process depends heavily on fragments’ filling factor and their compactness; without the more detailed analysis of fragments in both HI and CO it is not possible to give an accurate estimate of its influence. Such an analysis is beyond the scope of the current paper and would perhaps need the CO data with a higher spatial resolution.
Second, the shell is extended in the z-direction. We estimate its current b size as 12°, meaning more than 800 pc, with the possibility of being at least partially open (as given by McClure-Griffiths et al. 2006) to the halo. This means that a part of the ambient gas, which mostly originates from the densest parts of the galactic disc, flows to higher |z| locations, where the intrinsic refilling is negligible due to the low ambient density, or eventually can even escape from the supershell. This again slows down the rate at which the hole is refilled.
Taken together, these findings suggest that we need to assume that the evaporation from walls and the refilling by the ambient medium was slowed down by some or all of the processes described above, or due to some other mechanism, and therefore we still see the shell with a high contrast after about 80 Myr of subsonic expansion. An alternative, which we do not advocate, but which cannot be ruled out by our models, is a slightly lower age of the structure. As explained above (in Sect. 5.2, see also Fig. 12), there are some not particularly good but acceptable fits which predict lower ages (80 Myr or more) than the basic model, in which the subsonic expansion would last for only 40 Myr. To resolve the problem of the long-term existence of GS242-03+37 a more detailed identification of fragments in HI and CO and a full hydrodynamical model would be needed.
5.3.2. Collision of shells
The shell can be destroyed in a collision with another shell. This is not a probable scenario for GS242-03+37 since it is so big and it lies in the outer Milky Way where the density of shells and similar structures is low, contrary to the inner Milky Way. Also, merging of shells does not need to destroy them, it can only create a larger shell (see Krause et al. 2015, where merging of small shells is shown to be an important mechanism for creating supershells).
5.3.3. Differential rotation
The differential rotation can twist the shell so much that it ceases to be distinguishable. This is what we model and test with our simulations. The eccentricity of the shell, that is, the ratio between the minor and major semi-axes, grows with time. The shell at the galactocentric radius of the Sun (8.5 kpc) and with our adopted rotation curve, reaches the eccentricity of 0.5 at 46 Myr and the eccentricity of 0.1 (i.e. very distorted) at 135 Myr. The shell at the galactocentric distance of 5 kpc evolves faster, reaching eccentricities 0.1 and 0.5 at 28 and 83 Myr, respectively. On the other hand, the shell at 11 kpc distance evolves slower; the adequate times are 63 and 180 Myr. The eccentricity of the shell at the predicted age (120 Myr) is 0.3, very elongated but not yet destroyed.
The intrinsic eccentricity of GS242-03+37, which would be most visible along the z-direction from outside the Milky Way, is difficult to verify with observations, since our position relative to this structure does not enable us to see its real shape in the galactic plane.
5.3.4. Spiral arms
Shells can be destroyed by the passage of the spiral arm. For a discussion of the effects of the spiral structure on shells see for example McClure-Griffiths et al. (2002). Generally, this effect depends on the frequency with which the shell meets the spiral arm and this frequency depends on the position in the galaxy and on the spiral pattern speed. Close to the corotation radius this effect is not important. The pattern speed and the location of the corotation in the Galaxy are not precisely known (for a review of values of pattern speeds ωp in the Milky Way, see Gerhard 2011, which gives limits ωp ∈ (17,28) km s−1 kpc−1). Our supershell is located at R ≃ 11 kpc (R/R⊙ ≃ 1.3) and if it should lie close to the corotation, the required pattern speed should be around 20 km s−1 kpc−1, compatible with cited limits.
We can estimate limits on the pattern speed by requiring that the volume of the supershell not be disturbed by the passage of the spiral arm for a sufficiently long time. Using our adopted rotation curve (Wouterloot et al. 1990), the four-arm spiral pattern, the centre of the shell (at the galactocentric distance 10.8 kpc ± 1 kpc), and the required interval between subsequent spiral arm passages of ≥200 Myr, we obtain the condition that ωp ∈ (15,26) km s−1 kpc−1 (the result for the flat rotation curve is essentially the same). The “most suitable” pattern speed (with the largest interval between passages) is ωp = 19 km s−1 kpc−1.
5.4. Old shells in external galaxies
From studies of external galaxies we know that large and old HI structures exist. Bagetakos et al. (2011) identify HI shells in 20 galaxies (11 spirals and 9 dwarfs) and 7 of them have shells with ages ≥ 100 Myr (4 spirals and 3 dwarfs). Several of these galaxies contain more than one such structure. The shell ages are derived from the ratio of rsh and vexp, i.e. as in Eq. (3), except they use the coefficient 0.978 instead of 0.5 and therefore their ages are higher (the age of the supershell GS242-03+37 using the Bagetakos formula would be 50 Myr under the assumption that what we observe is the real expanding velocity, or 140 Myr for the subsonic expansion).
None of these old supershells in external galaxies are supersonically expanding, all are large (usually around 1500 pc in diameter but some even larger than 2000 kpc). The majority of these old shells are found inside the R25 isophotal radius, some even at radii < 0.5 R25. Their eccentricities (ratios between minor and major axes) vary between 0.4 and 0.9, with 0.7 being the average value.
The large dimensions and age of the supershell GS242-03+37 are therefore fully consistent with the above structures. The difference is the observing point: in the case of GS242-03+47 we observe the shell “edge-on”, while the mentioned shells in external galaxies are seen more “face-on”. This results in a different contribution of motions parallel and perpendicular to the galactic plane to the observed expansion velocity of structures. The “edge-on” view enables observations of the in-plane motions, while the fully “face-on” view is sensitive only to motions perpendicular to the disc.
5.5. Energy requirements
An interesting consequence of the old age of the supershell is the relatively low energy needed to create it. This is caused by the fact that the size of the structure and its expansion velocity are partially caused by the galactic shear and not by the energy input to the shell. Our best fit (13 ESN) is probably a lower limit, 1) because we do not take into account any radiative losses or the leakage of energy from the shell interior during the supersonic expansion phase and 2) because the evolution takes place in the homogeneous medium, which, for a given energy input, gives maximum sizes of the shell in the plane of the Galaxy. The evolution in a stratified disc is connected with a prolongation in the direction perpendicular to the disc and an eventual loss of energy to the halo (but since the supershell is located in a rather thick disc, this loss is not extreme, i.e. not the complete blow-out, as we see e.g. in Figs. 6 and 7, and discuss in the previous section). It is possible that a part of the energy released during the formation of the supershell leaked from the hot bubble and created the high latitude caps mentioned in McClure-Griffiths et al. (2006). This energy loss is not taken account of in our analysis. Therefore it is natural that our energy estimates are much lower than previous ones (Heiles 1979; McClure-Griffiths et al. 2006).
In our model we disregard the cooling from the shell interior. If the cooling were high, it would increase the energy requirement and perhaps decrease fragmentation times. However, due to the low density inside the shell (nHI < 0.1 cm−3), cooling is inefficient. During the initial 30 Myr of its supersonic expansion, its influence is very small. Even if this influence were to become more important later, when the HI hole is gradually refilled from higher-density walls, the motion of the fragmented shell in the gravitational field of Galaxy would no longer be influenced by this medium.
Given all the uncertainties and approximations, we still refer to GS242-03+37 as a supershell, even though our basic model suggests its energy is lower than the minimum value of the energy of the supershell (3× 1052 erg, Heiles 1979).
6. Distribution of clusters relative to GS242-03+37
We compare the distribution of clusters to the distribution of gas and the supershell GS242-03+37. We use the RING model (the best fit as described above), and not the HI data directly, because HI observations give us lbv coordinates (i.e. galactic longitude and latitude and a radial velocity) while for clusters we usually have lbd coordinates (i.e. galactic longitude and latitude and a heliocentric distance). In models, we have all coordinates; lbv were used for the comparison with HI observations while lbd (or xyz, which is equivalent) are used for comparison with clusters. Positions of clusters were not a parameter in the model fitting described in the previous section. The model of the supershell serves as the instrument recalculating radial velocities into heliocentric distances and vice versa.
We try to test the correlation between the HI supershell GS242-03+37 and positions of star clusters by calculating the number of clusters lying in the wall of the supershell. The correlation between the HI supershell and star clusters, if any, should exist for clusters younger than the supershell and should not exist for older clusters. Therefore we separate clusters into two categories: young clusters (τ < 120 Myr; which might be influenced, or indeed triggered, by the presence of the supershell) and old clusters (τ > 120 Myr; which should not be influenced by the supershell at all, since they are older than the structure).
At first glance, it is not completely obvious why the cluster with the age of ∼100 Myr should still lie in the wall of the shell, even if it originated there. It is reasonable to assume that a newly born cluster inherits the velocity of the gaseous material from which it was born. The expansion velocity of the HI shell is slowing down with time. Therefore the trajectory of the cluster is (theoretically) different from the trajectory of the wall. But this applies mainly to clusters born in an early phase of evolution, where the expansion velocity of the shell is high, that is, when the shell was younger than 20 Myr or so. If clusters are born after this period, i.e. when the shell is older than about 20 Myr, the difference in velocities (and thus in positions) of the cluster and the wall is small and the cluster still resides in the vicinity of the wall.
6.1. Number of clusters in the wall of the supershell
From our numerical simulations we know the position of the dense shell (in xyz or lbd space) but we do not know its thickness as our simulations assume that it is infinitesimally thin. Let us define the thickness of the shell wall as 2 × Δrsh. A cluster resides in the wall if its closest distance to the shell, Δdc–w, is less than Δrsh: Δdc–w ≤ Δrsh; this way we explore the concentration of clusters to the wall.
Figure 13 shows numbers for young (age < 120 Myr) and old (age > 120 Myr) clusters as a function of Δrsh. The studied area is l ∈ (230,255)°, b ∈ (−3,+3)° and dhc ∈ (2.5,5.4) kpc (in this subsection we have trimmed the area so as not to deal with a lot of space far from the supershell). Since the absolute number of young and old clusters in the area differs (42 or 112, respectively), we use the normalised value, that is, the absolute value divided by the total number of young or old clusters.
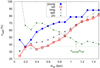 |
Fig. 13. Number of clusters as a function of the thickness of the shell. Young (< 120 Myr) clusters are shown in blue, old clusters in red. Grey lines are randomly generated samples, with the homogeneous (filled) and spiral distance-dependent (empty) probability distribution. The green line shows the ratio between the number of young and old clusters in the wall, the value 37.5% is the ratio between the total numbers of young and old clusters. |
Consistently larger number of young clusters are shown to be sitting in the wall, except for very thin walls, where any error in the distance determination, either of the cluster or of the wall, plays a large role; or very thick walls, where the substantial part of the area is covered by walls and hence the distinction wall/not-wall loses sense.
To compare the calculated dependence of the number of observed clusters in the wall on the thickness of the wall, we have also calculated the expected number of clusters for two distributions: the “homogeneous” distribution of clusters in the area, where clusters are homogeneously distributed in both l and d directions (b direction does not influence the analysis); and the “spiral” distribution, which copies the distribution of all clusters with the distance shown in Fig. 5.
In both cases, these randomly generated samples have a smaller number of clusters in the wall than corresponds to the observed distribution of young clusters, but very similar to the distribution of old clusters. The spiral distribution is more similar to the distribution of old clusters than the homogeneous one, which is understandable, since it reflects the distribution of clusters with the distance. Figure 13 also shows the ratio between the number of young (< 120 Myr) and old (> 120 Myr) clusters in the wall (in percents); the value 37.5 corresponds to the ratio between the total number of young clusters in the area (42) and the total number of old clusters (112).
The conclusion is simple: the fraction of young clusters lying in the wall of the supershell is larger than for old clusters or for randomly generated cluster samples.
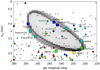 |
Fig. 14. ld diagram of the model of the supershell projected to the longitude-heliocentric distance plane (the black outline and the grey map, the intensity corresponds to the gas mass) together with positions of star clusters. Ages of clusters are colour-coded: < 5 Myr (blue), 5–10 Myr (cyan), 10–15 Myr (darker green, only 2 clusters in the image), 15–20 Myr (light green), 20–40 Myr (yellow), 40–120 Myr (red), and > 120 Myr (dark grey). Clusters most probably originating in the shell are denoted as large squares and their names are given, as well as names of some other young clusters. |
6.2. Individual clusters associated with the shell
We have shown in the previous subsection that young (age < 120 Myr) clusters tend to be associated with the wall of the supershell GS242-03+37. This association is statistical, but we would like to know which clusters came into existence in the wall, that is, were triggered by the supershell. It is difficult to tell for sure which individual clusters originated in the wall, but we can estimate the probability of the association and choose the most probable clusters.
We have three criteria by which we evaluate if an individual cluster could be connected to the HI supershell:
The position in the wall, that is, the distance from the position of the shell, dc–w, is very small (less than e.g. 100 pc). This condition favours very young clusters, since they do not have sufficient time to move away from the place of their birth. Older clusters, even if they originate in the wall, may be further away simply because they naturally move away.
It is easy to move to the current position, that is, dc–w is such that it could be travelled during the lifetime of the cluster with a reasonable velocity (e.g. less than 10–20 km s−1). It favours older clusters since they have lots of time to move far from the wall.
The radial velocity of the cluster is similar to the radial velocity of the nearest part of the shell. The difference should not be too large, it is basically the difference in expansion velocities at the time of the cluster creation and now.
We have sorted out nine clusters, which satisfy these criteria best: Haffner 19, Haffner 16, Ruprecht 32, NGC 2414, Ruprecht 59, FSR 1283, DBSB 3, Ruprecht 55, and DBSB 7. All these clusters lie very close to the shell. Seven out of them are at distances smaller than 50 pc from the shell; the remaining two (Haffner 16 and DBSB 7) are slightly further away (100–150 pc), but since their ages are 20–30 Myr, they could easily have travelled this distance during their lifetimes. Only three other clusters are found to be less than 150 pc from the shell. One of them is a young cluster Ruprecht 44: it was not chosen as a suitable candidate because 1) it is young and therefore would need relatively high velocity to reach its current position, and 2) it lies inside the shell. Further discussion about this cluster can be found in the subsection “Strange case of NGC 2467-east”. Another young cluster, DBSB 6, lies outside the wall, but it would need a high extra velocity to reach its current position (> 25 km s−1), so it was disregarded for this reason. One older cluster, Haffner 18, lies very close to the wall (and due to its age has no problem in reaching its current destination), but there is a high discrepancy between its distance (and predicted radial velocity) and the observed radial velocity; for this reason it was not chosen. All other clusters in the area containing the supershell are further from the shell.
At Fig. 15 we plot the star cluster ages versus their distances to the wall (Δdc−w). Ten clusters (the nine listed above and Pup OB3 — see below), which are most probably connected to the shell, are shown as black circles. The older ones of these reside close to the tip of the supershell twisted by the differential rotation, others are in walls/sides. There are no clusters with ages between 30 and 60 Myr in the supershell region. This time interval, due to z-oscillations perpendicular to the disc, corresponds to the period of a lower density in shell walls (see Fig. 10, right panel).
Table A.1 contains all relevant information (coordinates, ages, distances) about the star clusters younger than 120 Myr in the supershell GS242-03+37 region (displayed in Fig. 15). The table also shows distances of clusters to the wall of the supershell (dc–w) and highlights the clusters associated with the HI structure. There are only three clusters with ages > 80 Myr, as also seen in Fig. 15. Therefore, if the supershell is younger than 120 Myr, for example 80 Myr, which is our lower limit on the age of the supershell, results derived in this section would still be valid, because the analysis would be only slightly changed.
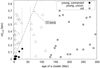 |
Fig. 15. Distance of the star clusters from the wall (Δdc–w) as a function of age. Clusters, most probably created in the wall of the supershell are shown as black circles, other young clusters (age < 120 Myr) are empty triangles. Old clusters (age > 120 Myr) are grey squares. The dashed line shows the distance travelled at a speed of 10 km s−1 during the age of the cluster. Dotted lines delineate ages of 30 and 60 Myr. |
6.3. Young cluster in the wall: a case of Pup OB3
In all analyses presented here, cluster data (positions, distances, ages and radial velocities) were taken from the catalogue of Kharchenko et al. (2013), even though in some cases other authors give alternative values of distances and ages. As explained above however, we prefer the homogeneity of the catalogue to the randomness of many sources.
There is, nevertheless, one exception, the cluster Pup OB3. This is a young OB association (2–3 Myr) at the vLSR = 30 km s−1. This cluster still seems to be clearly associated with the gas in its surroundings (see Fig. 16); it might be associated with the HII region Gum 10 = RCW 19 (Avedisova 2002). The radial velocity of RCW 19 is vLSR = 29.5 km s−1, with the dispersion σ = 12.9 km s−1 (Georgelin & Georgelin 1970). Based on the assumption of the physical connection between the gas observed at vLSR = 30 km s−1 (which lies in the wall of the supershell) and the Pup OB3, the distance to the association should be around 4.5 kpc, not the 1.7 kpc as given in the catalogue. Since the association between the cluster and the gas is tight - as expected for such a young object - we propose that Pup OB3 is lying in the wall of the supershell and add it to the list of clusters most probably associated with GS42-03+37.
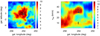 |
Fig. 16. Pup OB3 and the surrounding ISM. The map corresponds to the HI emission, contours to the CO emission. The grey square denotes the position of Pup OB3. Left panel: channel map (velocity interval: 〈28.0,32.0〉 km s−1), right panel: lv-diagram (in the b interval of 〈−0.5°, 0.0°〉). |
Knowing (or assuming) the distance towards Pup OB3 we can estimate the mass of the gas associated with this cluster. Taking all the mass inside the 2.5° radius from the cluster in the whole velocity extent (majority of the mass has vlsr ∈ (25,40) km s−1, see Fig. 16) we calculate the column density of HI and H2 using the formulae
 (14)
(14)
 (15)
(15)
where THI is the HI brightness temperature, TCO is the CO brightness temperature, X is the conversion factor for which we use the value X = 1.8×1020 cm−2 K−1(km s−1)−1, and A = 1.82×1018 cm−2 K−1(km s−1)−1. Calculated masses are MHI = 7.8 × 10⁵ M⊙ and MCO = 1.2× 10⁵ M⊙. The total mass of about 9 × 10⁵ M⊙ is close to masses of giant molecular clouds where OB associations usually form. Therefore the values derived with the assumed distance of 4.5 kpc are not unreasonably high and the assumed distance is not unrealistically large (corresponding masses for the original distance of 1.7 kpc would be approximately seven times smaller.
6.4. When and where were associated clusters created?
Figure 14 shows the age gradient along the wall of the supershell. The oldest clusters are found at low galactic longitudes and low heliocentric distances, the youngest clusters at high longitudes and large distances. Two interesting questions arise: Why does such a distribution exist? And why are the associated clusters relatively young (much younger than the age of the supershell)?
Our simulations, as well as other older simulations, for example Tenorio-Tagle & Palous (1987), show that in later stages of the evolution in the differentially rotating galaxy, the mass in the shell slides along the perimeter of the “ellipse”. The highest density is found at the tips, that is, at places near to the major axis. The observed age gradient of clusters can then be explained by the differences in the growth rates of inhomogeneities: the medium with higher-density fragments forms stars faster than the medium with low-density fragments. Older clusters tend to be formed from the medium with the higher column density, which is consistent with their positions close to the major axis of the supershell.
The second question related to ages of associated clusters is why the onset of star formation took so long and why about 30 Myr ago, when the supershell was 90 Myr old (or 50 Myr, if we take the lower limit on the estimated age). At that time the supershell was not moving supersonically, it was not sweeping up the new matter and its mass did not grow; in fact, the average column density decreases with time. The diffential rotation of the Milky Way causes “sliding” of the material along the walls and accumulation in the “tips”, as shown already in Tenorio-Tagle & Palous (1987) and also observed in our current simulations. This is relevant to our case: the oldest clusters in our sample were created in the vicinity of the tips. But this is not the whole story, since clusters are also found far away from the high-density tips, in the much-lower-density medium.
One possible explanation of the timescale lies in Fig. 10 (right). In models with the homogenous density or with the thick gaseous disc, the age of 90 Myr corresponds to the maximum squeezing of the supershell due to the forces acting perpendicularly to the plane. Correspondingly, the densities in the swept-up wall reached the (local) maxima and therefore the rate of the gravitational fragmentation was enhanced (or made possible). There was a similar situation, when the age of the supershell was 50 Myr (i.e. 70 Myr ago), but we do not find any clusters of the appropriate age, which would appear connected to the wall.
6.5. Strange case of NGC 2467-east
NGC 2467-east is the young cluster (∼6 Myr) with a radial velocity (vlsr = 41.7 km s−1) lying at coordinates (l,b) = (243.18°, 0.41°). It is different from the older NGC 2467 cluster at very similar coordinates (see Kharchenko et al. 2013). NGC 2467-east is probably related to the HII region NGC 2467 (SIMBAD coordinates 243.15°, 0.36° and the radial velocity vlsr = 37.5 km s−1).
The HII region NGC 2467 is an active star-forming region; clusters Haffner 18 and 19 are believed to lie inside it2. According to Kharchenko et al. (2013), Haffner 19 is a young cluster and according to our analysis it lies in the distant wall of the supershell and is associated with it. Haffner 18 is, according to the catalogue, an older cluster with the age of 80 Myr, at a different (nearer) distance than Haffner 19 and not associated with the supershell (though it actually lies close to the near wall). We reiterate that our “association criteria” are based on distances, not on velocities, since many clusters do not have measured radial velocities. Therefore, from our point of view, Haffner 19 is (somehow) connected to the HII region NGC 2467, while Haffner 18 is not and lies outside.
NGC 2467-east lies very close to the centre of the supershell GS242-03+37, in an HI- and CO- empty region. If it is a very young cluster, as given by Kharchenko et al. (2013), it has nothing to do with creating the supershell (which is much older), and the real mystery connected with this cluster is how it came to being in such a low gas density region. Close-ups of lb and lv diagrams (Fig. 17) do not help much. There is some faint emission around the cluster, but really faint. All three objects, Haffner 19, the HII region NGC 2467, and the cluster NGC 2467-east, have similar lb coordinates; their radial velocities differ slightly. Haffner 19 lies at the inner edge of the HI wall of the supershell, HII region and NGC 2467-east lie inwards from the wall; the distance Δrshell of the NGC 2467-east is (300–350) pc. To get to its current position, the cluster would have to travel with a velocity ≥50 km s−1 (using the age of 6.4 Myr). Such a velocity is relatively high. It could be lowered slightly if we assume that the star formation did not happen directly in the wall, but rather in a protruding gaseous “trunk” or a cloud that has wandered inside the supershell. We know that there is some gas outside the wall (and inside the supershell), as seen in Fig. 17, and also known from the presence of the HII region, but the presence of a relatively large amount of gas needed for the cluster formation is uncertain (and certainly not observed now).
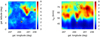 |
Fig. 17. NGC 2467-east and the surrounding ISM. The map corresponds to the HI emission, contours to the CO emission. The large dark square denotes the position of NGC 2467-east and the small light square shows the cluster Haffner 19. The red ellipse shows the position of the HII region NGC 2467, its size in the l or b dimension is 0.5°, in the v dimension 10 km s−1. Left panel: channel map (velocity interval: 〈40.0,44.0〉 km s−1), right panel: lv-diagram (in the b interval of 〈0.2°, 0.6°〉). |
For an older cluster we could invoke the theory of the star formation triggered by the squeezing of the preexisting clump by the passing shock front, in times when the supershell GS242-03+37 was younger and moved supersonically; or perhaps some variant of “pillars of creation” during the early epoch, when there was hot gas inside the supershell – it seems there is none there today. For a young cluster, these scenarios do not work.
Similar cases to NGC 2467-east are clusters Ruprecht 44, FSR 1297, and NGC 2439. Ruprecht 44 and FSR 1297 do not have measured radial velocities and we only know their distances. Therefore, especially in the case of Ruprecht 44, we can imagine that a small shift in the heliocentric distance, comparable to the error in its derivation, could shift the cluster to the wall (where their formation is much more probable than in the empty hole inside the supershell). NGC 2439 has a measured radial velocity, which places it inside the hole. It is older than NGC 2467-east (its age is 18 Myr), but problems with its formation are similar.
6.6. An arc of young clusters
Another interesting feature nicely visible in Fig. 14 is an arc of young clusters around the position l = 233° and dhc = 4 kpc. Clusters FSR 1283 and DBSB 3 (which both lie in the wall of the supershell) and DBSB 9, FSR 1243, FSR 1228 and NGC 2401 form a beautiful arc, as if blown-out from the main body of the supershell. DBSB 6 might or might not belong to this arc. As the supershell is old, the eventual blow-out of gas, from which the clusters were subsequently formed, could not have happened recently. The theoretical blow-out could happen due to some very off-centre (supernova) explosion or due to meeting a preexisting cavity, and this took place during the phase of the supersonic expansion of the supershell, some 70–100 Myr ago.
An alternative explanation is a case of the triggered star formation unrelated to the GS242-03+37, in a gas expanding from some parent cluster. However, this triggering cluster is not visible (and it probably should be, because it should not be so old as to move away and get lost), and we see an age gradient along the arc, compatible with our findings about the age distribution of clusters along the supershell, but not very compatible with the simple triggering in the shell. A chance alignment of clusters is also possible.
7. Summary
An analysis of the galactic HI supershell GS242-03+37 leads us to the following conclusions.
Based on the comparison of our numerical model to the HI data we conclude, that the supershell GS242-03+37 is an old structure, with the age of 80 Myr or more (our best fit is 120 Myr). It could survive so long in the Milky Way because it is luckily placed very near the corotation radius of the spiral structure and therefore is not disturbed by the passages of the spiral arms, which are otherwise thought of as the main destroyers of larger HI shells.
The supershell GS242-03+37 is not as energetic a structure as was once thought (and may therefore not be a supershell in the strict “energetic” definition). Our estimates give the required amount of energy as a few tens of supernovae. While this is still a lot, it is very far from previous estimates of hundreds and thousands of supernovae. The discrepancy is given by the effects of the differential rotation, which are substantial for such an old structure. Our estimate is a lower limit, however, as we do not take into account any leakage of energy into the halo.
There seems to be a correlation between the supershell and the distribution of young (< 120 Myr) star clusters: clusters with an age of less than 120 Myr tend to be preferentially located in walls of the supershell; no such tendency is found for older clusters. The model of the supershell serves as an example mechanism of how radial velocities (of HI data) can be transformed to heliocentric distances (of clusters) and backwards. The age of the model or its other properties do not directly influence this comparison.
Clusters, which were most probably created in the wall of the supershell, show an age gradient consistent with the densest parts starting fragmentation first. All these clusters are younger than 30 Myr. We speculate that the onset of star formation is the interplay between the galactic gravitational forces – the accumulation of matter at “tips” due to the galactic shear and the oscillations in the z-direction – but we do not propose any detailed model since this would require more precise distance and age determinations.
In the whole paper, when using the radial velocity, we mean the velocity relative to the local standard of rest, vlsr
Acknowledgments
We thank the anonymous referee for suggestions and comments, which enriched the original version of the paper. This study has been supported by the Albert Einstein Center for Gravitation and Astrophysics (the Czech Science Foundation project 14-37086G) and by the project RVO: 67985815.
References
- Avedisova, V. S. 2002, Astron. Rep., 46, 193 [NASA ADS] [CrossRef] [Google Scholar]
- Bagetakos, I., Brinks, E., Walter, F., et al. 2011, AJ, 141, 23 [NASA ADS] [CrossRef] [Google Scholar]
- Bisnovatyj-Kogan, G. S., & Blinnikov, S. I. 1982, Astronomicheskii Zhurnal, 59, 876 [NASA ADS] [Google Scholar]
- Bisnovatyi-Kogan, G. S., & Silich, S. A. 1995, Rev. Mod. Phys., 67, 661 [NASA ADS] [CrossRef] [Google Scholar]
- Bureau, M., & Carignan, C. 2002, AJ, 123, 1316 [NASA ADS] [CrossRef] [Google Scholar]
- Chevalier, R. A. 1974, ApJ, 188, 501 [NASA ADS] [CrossRef] [Google Scholar]
- Dame, T. M., Hartmann, D., & Thaddeus, P. 2001, ApJ, 547, 792 [NASA ADS] [CrossRef] [Google Scholar]
- Dawson, J. R., McClure-Griffiths, N. M., Kawamura, A., et al. 2011, ApJ, 728, 127 [NASA ADS] [CrossRef] [Google Scholar]
- Dawson, J. R., McClure-Griffiths, N. M., Wong, T., et al. 2013, ApJ, 763, 56 [NASA ADS] [CrossRef] [Google Scholar]
- Dickey, J. M., & Lockman, F. J. 1990, ARA&A, 28, 215 [NASA ADS] [CrossRef] [MathSciNet] [Google Scholar]
- Dinnbier, F., Wünsch, R., Whitworth, A. P., & Palouš, J. 2017, MNRAS, 466, 4423 [NASA ADS] [Google Scholar]
- Dopita, M. A., & Sutherland, R. S. 2003, Astrophysics of the diffuse universe (Berlin, New York: Springer) [Google Scholar]
- Dove, J. B., Shull, J. M., & Ferrara, A. 2000, ApJ, 531, 846 [NASA ADS] [CrossRef] [Google Scholar]
- Efremov, Y. N. 2013, MNRAS, 429, L75 [NASA ADS] [CrossRef] [Google Scholar]
- Efremov, Y. N., Ehlerová, S., & Palouš, J. 1999, A&A, 350, 457 [NASA ADS] [Google Scholar]
- Ehlerová, S., & Palous, J. 1996, A&A, 313, 478 [NASA ADS] [Google Scholar]
- Ehlerová, S., & Palouš, J. 2005, A&A, 437, 101 [NASA ADS] [CrossRef] [EDP Sciences] [Google Scholar]
- Ehlerová, S., & Palouš, J. 2013, A&A, 550, A23 [NASA ADS] [CrossRef] [EDP Sciences] [Google Scholar]
- Ehlerová, S., & Palouš, J. 2016, A&A, 587, A5 [NASA ADS] [CrossRef] [EDP Sciences] [Google Scholar]
- Elmegreen, B. G. 2011, in EAS Pub. Ser., eds. Charbonnel C., & Montmerle T., 51, 45 [Google Scholar]
- Georgelin, Y. P., & Georgelin, Y. M. 1970, A&A, 6, 349 [NASA ADS] [Google Scholar]
- Gerhard, O. 2011, Mem. Soc. Astron. It. Supp., 18, 185 [Google Scholar]
- Heiles, C. 1979, ApJ, 229, 533 [NASA ADS] [CrossRef] [Google Scholar]
- HI4PI Collaboration (Ben Bekhti, N., et al.) 2016, A&A, 594, A116 [NASA ADS] [CrossRef] [EDP Sciences] [Google Scholar]
- Kharchenko, N. V., Piskunov, A. E., Schilbach, E., Röser, S., & Scholz, R.-D. 2013, A&A, 558, A53 [NASA ADS] [CrossRef] [EDP Sciences] [Google Scholar]
- Kompaneets, A. S. 1960, Soviet Phys. Dokl., 5, 46 [Google Scholar]
- Koo, B.-C., Park, G., Kim, W.-T., et al. 2017, PASP, 129, 094102 [NASA ADS] [CrossRef] [Google Scholar]
- Krause, M. G. H., Diehl, R., Bagetakos, Y., et al. 2015, A&A, 578, A113 [NASA ADS] [CrossRef] [EDP Sciences] [Google Scholar]
- Kuijken, K., & Gilmore, G. 1989, MNRAS, 239, 605 [NASA ADS] [CrossRef] [Google Scholar]
- Maciejewski, W., Murphy, E. M., Lockman, F. J., & Savage, B. D. 1996, ApJ, 469, 238 [NASA ADS] [CrossRef] [Google Scholar]
- Mackey, A. D., Koposov, S. E., Da Costa, G. S., et al. 2017, MNRAS, 472, 2975 [NASA ADS] [CrossRef] [Google Scholar]
- McClure-Griffiths, N. M., Dickey, J. M., Gaensler, B. M., & Green, A. J. 2002, ApJ, 578, 176 [NASA ADS] [CrossRef] [Google Scholar]
- McClure-Griffiths, N. M., Dickey, J. M., Gaensler, B. M., & Green, A. J. 2003, ApJ, 594, 833 [NASA ADS] [CrossRef] [Google Scholar]
- McClure-Griffiths, N. M., Ford, A., Pisano, D. J., et al. 2006, ApJ, 638, 196 [NASA ADS] [CrossRef] [Google Scholar]
- Oey, M. S., & Clarke, C. J. 1997, MNRAS, 289, 570 [NASA ADS] [CrossRef] [Google Scholar]
- Ostriker, J. P., & McKee, C. F. 1988, Rev. Mod. Phys., 60, 1 [NASA ADS] [CrossRef] [Google Scholar]
- Park, G., Koo, B.-C., Kang, J.-H., et al. 2016, ApJ, 827, L27 [NASA ADS] [CrossRef] [Google Scholar]
- Pidopryhora, Y., Lockman, F. J., & Shields, J. C. 2007, ApJ, 656, 928 [NASA ADS] [CrossRef] [Google Scholar]
- Reid, M. J., Menten, K. M., Brunthaler, A., et al. 2014, ApJ, 783, 130 [Google Scholar]
- Rhode, K. L., Salzer, J. J., Westpfahl, D. J., & Radice, L. A. 1999, AJ, 118, 323 [NASA ADS] [CrossRef] [Google Scholar]
- Silich, S. A., Franco, J., Palous, J., & Tenorio-Tagle, G. 1996, ApJ, 468, 722 [NASA ADS] [CrossRef] [Google Scholar]
- Stewart, S. G., Fanelli, M. N., Byrd, G. G., et al. 2000, ApJ, 529, 201 [NASA ADS] [CrossRef] [Google Scholar]
- Suad, L. A., Caiafa, C. F., Arnal, E. M., & Cichowolski, S. 2014, A&A, 564, A116 [NASA ADS] [CrossRef] [EDP Sciences] [Google Scholar]
- Tenorio-Tagle, G., & Palous, J. 1987, A&A, 186, 287 [NASA ADS] [Google Scholar]
- Tenorio-Tagle, G., Franco, J., Bodenheimer, P., & Rozyczka, M. 1987, A&A, 179, 219 [NASA ADS] [Google Scholar]
- van Eymeren, J., Marcelin, M., Koribalski, B., et al. 2009, A&A, 493, 511 [NASA ADS] [CrossRef] [EDP Sciences] [Google Scholar]
- Weaver, R., McCray, R., Castor, J., Shapiro, P., & Moore, R. 1977, ApJ, 218, 377 [NASA ADS] [CrossRef] [Google Scholar]
- Wouterloot, J. G. A., Brand, J., Burton, W. B., & Kwee, K. K. 1990, A&A, 230, 21 [NASA ADS] [Google Scholar]
- Wünsch, R., Jáchym, P., Sidorin, V., et al. 2012, A&A, 539, A116 [NASA ADS] [CrossRef] [EDP Sciences] [Google Scholar]
Appendix A: Additional material
Clusters around GS242-03+37 with ages < 120 Myr.
All Tables
All Figures
|
Fig. 1. Galactic supershell GS242-03+37: channel map integrated between +30 and +50 km s−1 (HI4PI survey). Thick black lines are the CO emission, which is only available for the strip b ∈ (-5°,+5°). |
| In the text | |
|
Fig. 2. PV-diagrams of the shell GS242-03+37: longitude–velocity diagram integrated between b = −1° and −3° (left panel) and latitude–velocity integrated between l = 241° and 245° (right panel). Thick black lines have the same significance as in Fig. 1. |
| In the text | |
|
Fig. 3. Maximum density of the HI gas (left panel) and its thickness (right panel) based on simple conversion from HI data to the Gaussian HI gas distribution using the rotation curve. Black lines show galactocentric distances, starting from 10 kpc (the lowest line) with the 1 kpc increment. Densities are in at cm−3, thicknesses are in kpc. The supershell GS242-03+37 is clearly visible on both maps. |
| In the text | |
|
Fig. 4. Cuts of the HI channel map at vlsr = 42.5 km s−1 along the lines of constant galactic latitude b. Individual profiles are artificially offset by 20 K. |
| In the text | |
|
Fig. 5. Surface density of clusters in the region (l ∈ (225°,260°)) from Kharchenko et al. (2013) as a function of the heliocentric distance dhc. The histogram shows the density of all clusters; lines indicate the distribution of clusters with a certain age (blue: clusters younger than 120 Myr, green: clusters between 120 and 300 Myr, red: clusters older than 300 Myr). Positions of spiral arms (Local and Perseus) are indicated, as well as the limiting distance, where the catalogue is complete. |
| In the text | |
|
Fig. 6. Evolution of the shell calculated by the RING code; cuts are in the galactic plane (10, 30, 50, 70, 90, 110 and 130 Myr; left panel), dashed lines correspond to the model without the galactic potential, solid lines show the model with the potential. Right panel: evolutionary time 50 Myr for different models: homogeneous medium (black), homogeneous medium with 5x larger energy input (grey), Gaussian density disc with scale heights of 500 pc (blue), 300 pc (green), 200 pc (brown) and 100 pc (red). Dashed and dotted lines show the situation without the galactic potential, solid lines the situation with the galactic potential. Axes are labelled in kpc. |
| In the text | |
|
Fig. 7. Evolution of the shell calculated by the RING code; cuts are perpendicular to the galactic plane (10, 30, 50, 70, 90, 110 and 130 Myr; left panel). Dashed lines corresponds to the evolution in the homogeneous medium, solid lines show the Gaussian profile with the scaleheight of 200 pc. No galactic potential is taken into account. Right panel: evolutionary time 30 Myr for different models: homogeneous medium (black), homogeneous medium with 5x larger energy input (grey), Gaussian density disc with scale heights of 500 pc (blue), 300 pc (green), 200 pc (brown) and 100 pc (red). Dashed and dotted lines show the situation without the galactic potential, solid lines the situation with the galactic potential. Axes are labelled in kpc. |
| In the text | |
|
Fig. 9. The radius rsh of the shell as a function of time, calculations of the RING code, the evolution without the external gravitational potential. Black and green lines correspond to the evolution in the homogeneous medium, blue and red lines to the evolution in the Gaussian disc with the thickness of 200 pc. Black line is the basic model, green lines (dashed and dotted, respectively) correspond to models with 10x higher and smaller energy inputs with adequately higher and smaller densities (L/n are the same for all models). Blue lines show the radius of the shell in the plane (solid) and the z-extent (dash-dotted) for the basic model. Red and orange lines again correspond to models with higher and smaller energy inputs and densities, respectively. |
| In the text | |
|
Fig. 10. Radius rsh of the shell as a function of time, calculations of the RING code, the evolution with the external gravitational potential: the radius in the plane (left panel) and the z-extent (right panel). Left panel: black colour corresponds to the basic model, blue colour to the model with 10x higher energy input and density, red colour to the model with 10x lower energy input and density. Different line types are dedicated for the average values rave (solid), the maximum rmax (dashed) and minimum rmin (dotted) values. Right panel: z-extent of the basic model in the homogeneous medium (black), the Gaussian distribution with a thickness 500 pc (blue) and Gaussian distribution with a thickness of 200 pc (red; models with 10x higher and lower energy input and density are added). In both panels the basic model from Fig. 9 is overlaid in green. |
| In the text | |
|
Fig. 8. The evolution of the shell calculated by the RING code, lv-diagram, at times (10, 30, 50, 70, 90, 110 and 130) Myr. Dashed lines correspond to the model without the galactic potential, solid lines to the model with the potential. |
| In the text | |
|
Fig. 11. Dynamical age tdyn (Eq. (3)) as a function of the real evolutionary time tevol for the basic model. Dashed lines are calculated from sizes and velocities taken directly from models, and solid lines are solutions derived from angular sizes and velocity extents corresponding to methods used in the Milky Way. Red colour is the model without the external gravitational potential (e.g. without the galactic shear). Black and blue lines correspond to the same model but viewed, at each time tevol, at a specified position in the Milky Way: at l = 244° (black) and at l = 116° (blue, symmetrically around the anticenter line). The grey dotted line is the analytical solution (Weaver et al. 1977). |
| In the text | |
|
Fig. 12. lv-diagram of the supershell GS242-03+37 with the outlines. Left panel: outlines of the best model (“basic model” at 120 Myr, blue/white), the model with twice the energy input at 100 Myr (violet/black), and the approximate outline of the observed structure (grey line). Right panel: outlines of the best (basic) model (blue/white) and of models with the fixed ages (40 Myr: green/black; 80 Myr: violet/black). HI map is underlined; black contours show the CO emission. The colour scale is |
| In the text | |
|
Fig. 13. Number of clusters as a function of the thickness of the shell. Young (< 120 Myr) clusters are shown in blue, old clusters in red. Grey lines are randomly generated samples, with the homogeneous (filled) and spiral distance-dependent (empty) probability distribution. The green line shows the ratio between the number of young and old clusters in the wall, the value 37.5% is the ratio between the total numbers of young and old clusters. |
| In the text | |
|
Fig. 14. ld diagram of the model of the supershell projected to the longitude-heliocentric distance plane (the black outline and the grey map, the intensity corresponds to the gas mass) together with positions of star clusters. Ages of clusters are colour-coded: < 5 Myr (blue), 5–10 Myr (cyan), 10–15 Myr (darker green, only 2 clusters in the image), 15–20 Myr (light green), 20–40 Myr (yellow), 40–120 Myr (red), and > 120 Myr (dark grey). Clusters most probably originating in the shell are denoted as large squares and their names are given, as well as names of some other young clusters. |
| In the text | |
|
Fig. 15. Distance of the star clusters from the wall (Δdc–w) as a function of age. Clusters, most probably created in the wall of the supershell are shown as black circles, other young clusters (age < 120 Myr) are empty triangles. Old clusters (age > 120 Myr) are grey squares. The dashed line shows the distance travelled at a speed of 10 km s−1 during the age of the cluster. Dotted lines delineate ages of 30 and 60 Myr. |
| In the text | |
|
Fig. 16. Pup OB3 and the surrounding ISM. The map corresponds to the HI emission, contours to the CO emission. The grey square denotes the position of Pup OB3. Left panel: channel map (velocity interval: 〈28.0,32.0〉 km s−1), right panel: lv-diagram (in the b interval of 〈−0.5°, 0.0°〉). |
| In the text | |
|
Fig. 17. NGC 2467-east and the surrounding ISM. The map corresponds to the HI emission, contours to the CO emission. The large dark square denotes the position of NGC 2467-east and the small light square shows the cluster Haffner 19. The red ellipse shows the position of the HII region NGC 2467, its size in the l or b dimension is 0.5°, in the v dimension 10 km s−1. Left panel: channel map (velocity interval: 〈40.0,44.0〉 km s−1), right panel: lv-diagram (in the b interval of 〈0.2°, 0.6°〉). |
| In the text | |
Current usage metrics show cumulative count of Article Views (full-text article views including HTML views, PDF and ePub downloads, according to the available data) and Abstracts Views on Vision4Press platform.
Data correspond to usage on the plateform after 2015. The current usage metrics is available 48-96 hours after online publication and is updated daily on week days.
Initial download of the metrics may take a while.