Fig. 5.
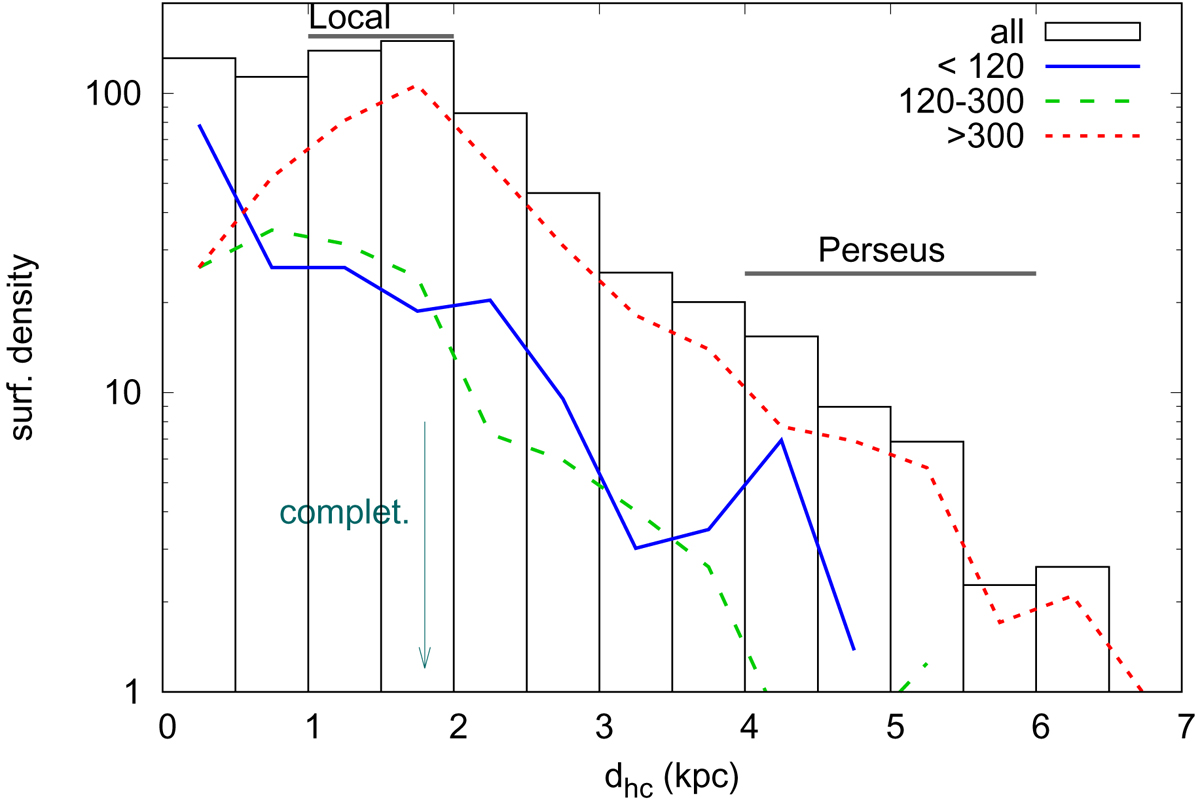
Surface density of clusters in the region (l ∈ (225°,260°)) from Kharchenko et al. (2013) as a function of the heliocentric distance dhc. The histogram shows the density of all clusters; lines indicate the distribution of clusters with a certain age (blue: clusters younger than 120 Myr, green: clusters between 120 and 300 Myr, red: clusters older than 300 Myr). Positions of spiral arms (Local and Perseus) are indicated, as well as the limiting distance, where the catalogue is complete.
Current usage metrics show cumulative count of Article Views (full-text article views including HTML views, PDF and ePub downloads, according to the available data) and Abstracts Views on Vision4Press platform.
Data correspond to usage on the plateform after 2015. The current usage metrics is available 48-96 hours after online publication and is updated daily on week days.
Initial download of the metrics may take a while.