Fig. 13.
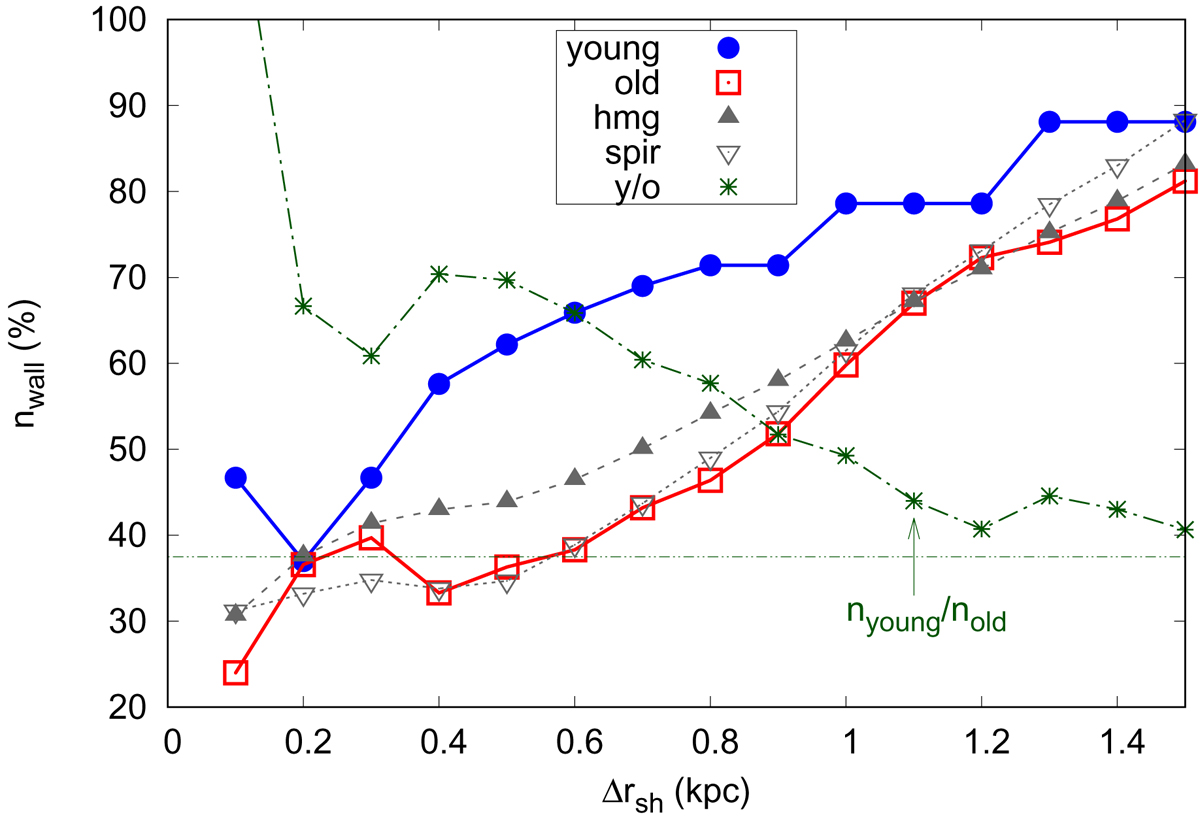
Number of clusters as a function of the thickness of the shell. Young (< 120 Myr) clusters are shown in blue, old clusters in red. Grey lines are randomly generated samples, with the homogeneous (filled) and spiral distance-dependent (empty) probability distribution. The green line shows the ratio between the number of young and old clusters in the wall, the value 37.5% is the ratio between the total numbers of young and old clusters.
Current usage metrics show cumulative count of Article Views (full-text article views including HTML views, PDF and ePub downloads, according to the available data) and Abstracts Views on Vision4Press platform.
Data correspond to usage on the plateform after 2015. The current usage metrics is available 48-96 hours after online publication and is updated daily on week days.
Initial download of the metrics may take a while.