Fig. 3.
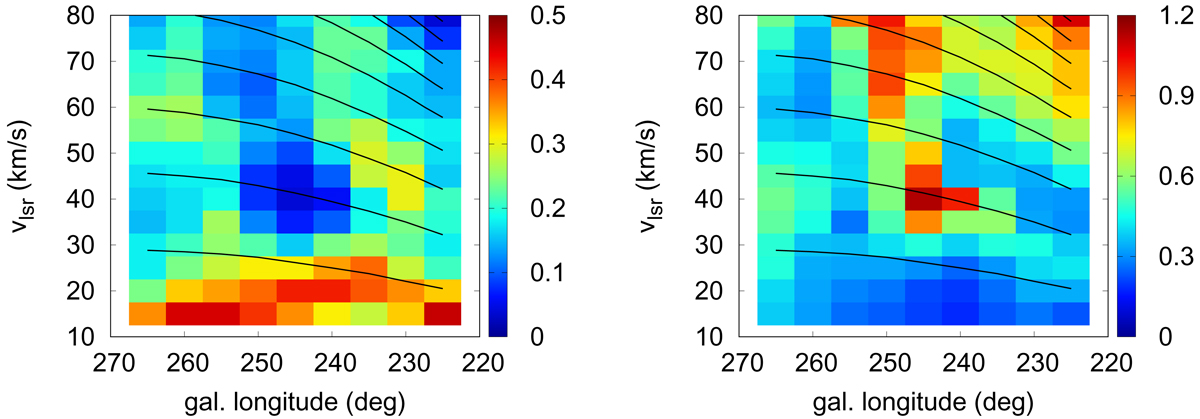
Maximum density of the HI gas (left panel) and its thickness (right panel) based on simple conversion from HI data to the Gaussian HI gas distribution using the rotation curve. Black lines show galactocentric distances, starting from 10 kpc (the lowest line) with the 1 kpc increment. Densities are in at cm−3, thicknesses are in kpc. The supershell GS242-03+37 is clearly visible on both maps.
Current usage metrics show cumulative count of Article Views (full-text article views including HTML views, PDF and ePub downloads, according to the available data) and Abstracts Views on Vision4Press platform.
Data correspond to usage on the plateform after 2015. The current usage metrics is available 48-96 hours after online publication and is updated daily on week days.
Initial download of the metrics may take a while.