Fig. 12.
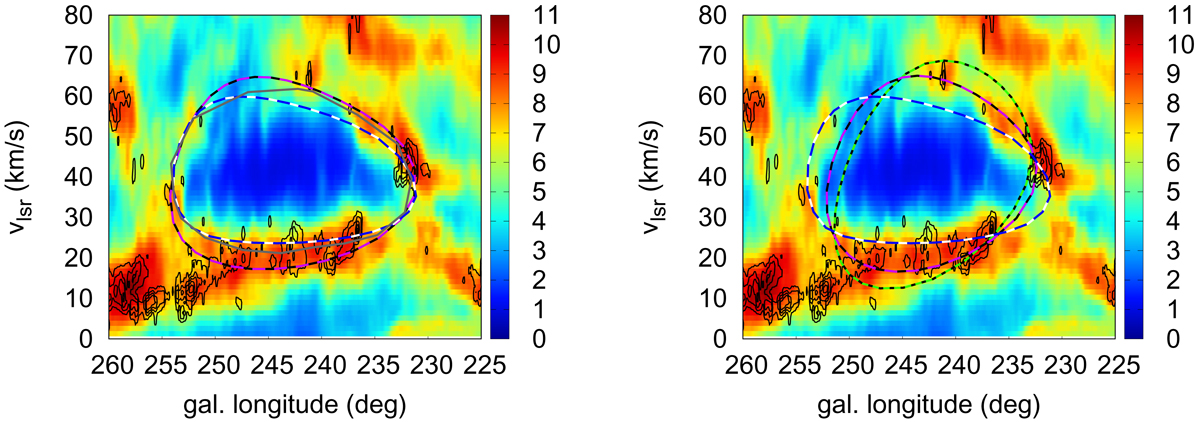
lv-diagram of the supershell GS242-03+37 with the outlines. Left panel: outlines of the best model (“basic model” at 120 Myr, blue/white), the model with twice the energy input at 100 Myr (violet/black), and the approximate outline of the observed structure (grey line). Right panel: outlines of the best (basic) model (blue/white) and of models with the fixed ages (40 Myr: green/black; 80 Myr: violet/black). HI map is underlined; black contours show the CO emission. The colour scale is ![]() .
.
Current usage metrics show cumulative count of Article Views (full-text article views including HTML views, PDF and ePub downloads, according to the available data) and Abstracts Views on Vision4Press platform.
Data correspond to usage on the plateform after 2015. The current usage metrics is available 48-96 hours after online publication and is updated daily on week days.
Initial download of the metrics may take a while.