Fig. 14.
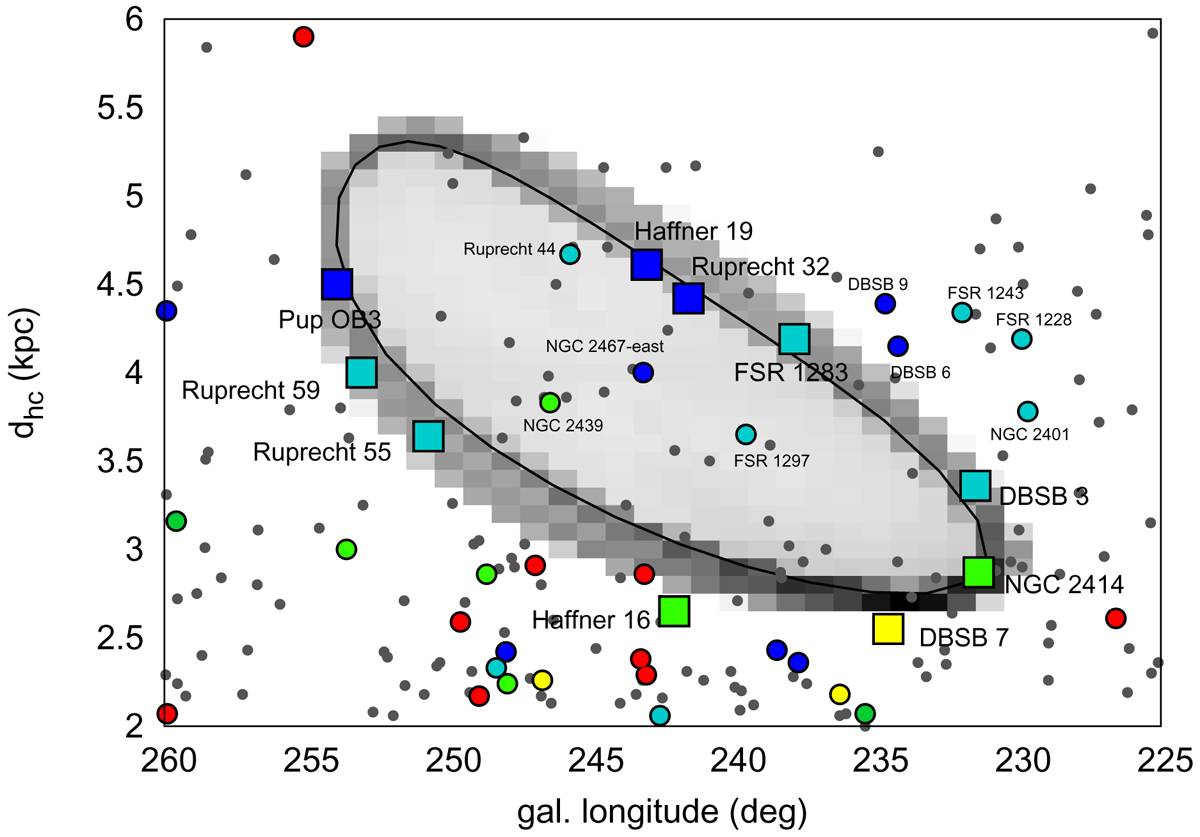
ld diagram of the model of the supershell projected to the longitude-heliocentric distance plane (the black outline and the grey map, the intensity corresponds to the gas mass) together with positions of star clusters. Ages of clusters are colour-coded: < 5 Myr (blue), 5–10 Myr (cyan), 10–15 Myr (darker green, only 2 clusters in the image), 15–20 Myr (light green), 20–40 Myr (yellow), 40–120 Myr (red), and > 120 Myr (dark grey). Clusters most probably originating in the shell are denoted as large squares and their names are given, as well as names of some other young clusters.
Current usage metrics show cumulative count of Article Views (full-text article views including HTML views, PDF and ePub downloads, according to the available data) and Abstracts Views on Vision4Press platform.
Data correspond to usage on the plateform after 2015. The current usage metrics is available 48-96 hours after online publication and is updated daily on week days.
Initial download of the metrics may take a while.