Free Access
Fig. 16.
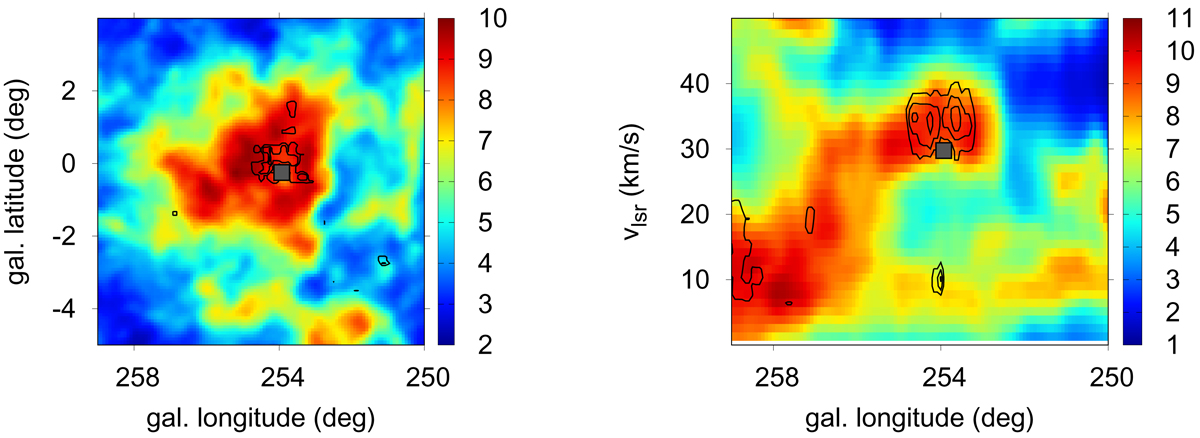
Pup OB3 and the surrounding ISM. The map corresponds to the HI emission, contours to the CO emission. The grey square denotes the position of Pup OB3. Left panel: channel map (velocity interval: 〈28.0,32.0〉 km s−1), right panel: lv-diagram (in the b interval of 〈−0.5°, 0.0°〉).
Current usage metrics show cumulative count of Article Views (full-text article views including HTML views, PDF and ePub downloads, according to the available data) and Abstracts Views on Vision4Press platform.
Data correspond to usage on the plateform after 2015. The current usage metrics is available 48-96 hours after online publication and is updated daily on week days.
Initial download of the metrics may take a while.