| Issue |
A&A
Volume 617, September 2018
|
|
|---|---|---|
| Article Number | A10 | |
| Number of page(s) | 9 | |
| Section | Interstellar and circumstellar matter | |
| DOI | https://doi.org/10.1051/0004-6361/201832765 | |
| Published online | 12 September 2018 | |
Water and interstellar complex organics associated with the HH 212 protostellar disc
On disc atmospheres, disc winds, and accretion shocks
1
INAF, Osservatorio Astrofisico di Arcetri,
Largo E. Fermi 5,
50125
Firenze,
Italy
e-mail: This email address is being protected from spambots. You need JavaScript enabled to view it.
3
Université Grenoble Alpes, Institut de Planétologie et d’Astrophysique de Grenoble (IPAG),
38401
Grenoble,
France
2
Università degli Studi di Firenze, Dipartimento di Fisica e Astronomia,
Via G. Sansone 1,
50019
Sesto Fiorentino,
Italy
4
LERMA, UMR 8112 du CNRS, Observatoire de Paris, École Normale Supérieure,
61 Av. de l’Observatoire,
75014
Paris,
France
5
Academia Sinica Institute of Astronomy and Astrophysics,
PO Box 23-141,
Taipei
106,
Taiwan
6
Graduate Institute of Astronomy and Astrophysics, National Taiwan University,
No. 1, Sec. 4, Roosevelt Road,
Taipei
10617,
Taiwan
7
IGN, Observatorio Astronómico Nacional,
Alfonso XII 3,
28014
Madrid,
Spain
8
IRAM, 300 rue de la Piscine,
38406
Saint-Martin-d’Hères,
France
9
Laboratoire d’astrophysique de Bordeaux, Univ. de Bordeaux, CNRS, B18N,
allée Geoffroy Saint–Hilaire,
33615
Pessac,
France
10
INAF – Osservatorio Astronomico di Cagliari,
Via della Scienza 5,
09047
Selargius (CA),
Italy
11
INAF – Istituto di Radioastronomia & Italian ALMA Regional Centre,
Via P. Gobetti 101,
40129
Bologna,
Italy
Received:
3
February
2018
Accepted:
12
June
2018
Abstract
Context. The unprecedented combination of high-sensitivity and high angular resolution provided by the ALMA interferometer allows us to shed light on the processes leading to the formation of the jet-disc system associated with a Sun-like mass protostar.
Aims. We investigate the physical and chemical properties of the gas associated with water and interstellar complex organic molecules around a protostar on solar system scales.
Methods. The HH 212 protostellar system, in Orion B, has been mapped, thanks to ALMA-Band 7 Cycle 1 and Cycle 4 observations of dueterated water (HDO) and acetaldehyde (CH3CHO) emission with an angular resolution down to ~0.′′15 (60 au).
Results. Many emission lines due to 14 CH3CHO and 1 HDO transitions at high excitation (Eu between 163 and 335 K) have been imaged in the inner ~70 au region. The local thermal equilibrium analysis of the CH3CHO emission leads to a temperature of 78 ± 14 K and a column density of 7.6 ± 3.2 × 1015 cm−2, which, when NH2 of 1024 cm−2 is assumed, leads to an abundance of XCH3CHO ≃ 8 × 10⁻⁹. The large velocity gradient analysis of the HDO emission also places severe constraints on the volume density, nH2 ≥ 108 cm−3. The line profiles are 5–7 km s−1 wide, and CH3CHO and HDO both show a ±2 km s−1 velocity gradient over a size of ~70 au (blue-shifted emission towards the north-west and red-shifted emission towards the south-east) along the disc equatorial plane, in agreement with what was found so far using other molecular tracers.
Conclusions. The kinematics of CH3CHO and HDO are consistent with the occurrence of a centrifugal barrier, that is, the infalling envelope-rotating disc ring, which is chemically enriched through low-velocity accretion shocks. The emission radius is ~60 au, in good agreement with what was found before for another interstellar complex organic molecule such as NH2CHO. We support a vertical structure for the centrifugal barrier, suggesting the occurrence of two outflowing, expanding, and rotating rings above and below (of about 40–45 au) the optically thick equatorial disc plane. It is tempting to speculate that these rings could probe the basis of a wind launched from this region.
Key words: stars: formation / ISM: jets and outflows / ISM: molecules / ISM: individual objects: HH212
© ESO 2018
1 Introduction
Imaging of molecular emission from Class 0 protostars is fundamental for understanding the steps needed to reach more evolved stages, eventually associated with protoplanetary systems (e.g. Ceccarelli et al. 2007, 2015; Herbst & van Dishoeck 2009; Tobin et al. 2010; Jørgensen et al. 2016), and references therein). The recent advent of ALMA is making a great contribution, among other topics, to the study of the pristine jet-disc systems associatedwith Sun-like protostars (e.g. Murillo et al. 2013; Harsono et al. 2015). More specifically, the unprecedented combination of sensitivity and high-spatial resolution finally allows us to distinguish the numerous kinematical components at work in the inner 50 au, which is the region where a planetary system is expected to form. In this context, astrochemical studies are crucial for imaging the transition from an infalling-rotating envelope to a rotating disc, which occurs around protostars on spatial scales of 30–100 au. Slow (less than 2 km s−1) accretion shocks are expected at the envelope-disc surface, and a consequent drastic enrichment of the gas-phase material is the natural consequence (Sakai et al. 2014a,b, 2016, 2017; Oya et al. 2016; Lee et al. 2016, 2017b). Among other species, this effect concerns the so-called interstellar complex organic molecules (iCOMs; C-bearing species with more than six atoms) that can be considered key bricks to the next step of complex prebiotic chemistry, and it is also relevant for water, another obvious key species for this type of studies. Despite the high spatial resolution observations obtained in this context in the past years, there are still hotly debated questions. Do the iCOMs associated with the disc surface layers leave the disc itself (see Lee et al. 2017b)? If so, are iCOMs associated with wide-angle slow disc winds? Further high angular resolution observations of Class 0 environments are needed to advance in this type of studies.
HH 212 (see Fig. 1) can be considered one of the best interstellar laboratories in which to study in detail the chemistry and physics of pristine jet-disc systems that are associated with a forming star. The HH 212 mm Class 0 protostar (Lbol ~ 9 L⊙, M ≃ 0.2–0.3 M⊙) is located in the L1630 cloud in Orion, between NGC 2068 and NGC 2024, at a distance that has recently been estimated to be 405 ± 15 pc (Kounkel et al. 2017; Kounkel, priv. comm.). HH 212 is associated with an extended symmetric molecular and rotating jet discovered using H2 by Zinnecker et al. (1998), which was later extensively observed using interferometers such as IRAM-NOEMA, the SMA, and ALMA (e.g. Lee et al. 2006, 2007, 2008, 2014, 2015, 2017c; Codella et al. 2007; Cabrit et al. 2007, 2012; Podio et al. 2015). A dusty disc with a radius of ~60 au that is deeply embedded in an infalling-rotating flattened envelope has recently been imaged with an unprecedented spatial resolution of 8 au using ALMA Band 7 continuum emission by Lee et al. (2017a). Using molecular (HCO+, C17O, SO) emission, the disc kinematics has also been investigated and revealed a velocity gradient that agrees with the jet rotation on scales ≤100 AU (Lee et al. 2014; Codella et al. 2014; Podio et al. 2015) and on scales of 40–50 au (Lee et al. 2017b). Finally, based on emission from CH3OH and S-bearing species, Codella et al. (2014), Leurini et al. (2016), and Bianchi et al. (2017) speculated that there might be a disc wind. This was later discussed in detail by Tabone et al. (2017) and Lee et al. (2018).
The chemical enrichment of the HH 212 mm surroundings has been investigated by Codella et al. (2017) and Lee et al. (2017b), who reported deuterated water (HDO), acetaldehyde (CH3CHO), and formamide (NH2CHO) in the inner 40–50 au from the protostar. This revealed the first hot corino in Orion. In particular, Lee et al. (2017b) showed that iCOMs trace the surface layers of the rotating disc; these layers are also called the disc atmosphere. Here we further investigate the origin of the chemical complexity in the HH 212 mm hot corino by imaging the spatial distribution of water (in its deuterated form) and CH3CHO down to an angular scale of 150 mas.
2 Observations
The HH 212 protostellar system was observed during ALMA Cycle 1 in Band 7 using 34 12 m antennas between 15 June and 19 July 2014. In addition, HH 212 was also observed in Band 7 during Cycle 4 using 44 12 m antennas between 6 October and 26 November 2016. The maximum baselines were 650 m for Cycle 1 and 3 km for Cycle 4, while the maximum unfiltered scale is ~3′′, that is, 1200 au.
In Cycle1, two spectral windows (337.1–338.9 GHz and 348.4–350.7 GHz) were simultaneously observed using spectral channels of 488 kHz (0.42–0.43 km s−1), and then smoothed to 1.0 km s−1 to increase sensitivity and obtain a higher signal-to-noise ratio (S/N) for the CH3CHO lines. The spectral windows were also used to derive continuum from the line-free channels. Standard procedures were used to calibrate the data, using quasars J0607–0834, J0541–0541, J0423–013, and Ganymede. The continuum-subtracted images have clean-beam FWHMs around 0.′′41 × 0.′′33 to 0.′′44 × 0.′′34 (PA = –63°) and an rms noise level of ~2 mJy beam−1 in the 1 km s−1 channels. During Cycle 4, we used a single spectral window between 334.1–336.0 GHz with a 0.42 km s−1 spectral resolution, successively smoothed to 1 km s−1 (this was also used to collect continuum emission) to improve the sensitivity. Calibration was carried out using quasars J0510+1800, J0552+0313, J0541–0211, and J0552–36271. The continuum-subtracted images have a typical clean-beam FWHM of 0.′′15 × 0.′′12 (PA = − 88°) and an rms noise level of ~1 mJy beam−1 per channel.
Spectral line imaging was achieved with the CASA2 package, while data analysis was performed using the GILDAS3 package. Positions are given with respect to the MM1 protostar continuum peak located at α(J 2000) = 05h 43m 51.s41, δ(J 2000) = –01° 02′53.′′17 (e.g. Lee et al. 2014). HDO and CH3CHO emission lines (see Table 1) were identified using spectroscopic parameters extracted from the Jet Propulsor Laboratory (JPL4; Pickett et al. 1998) molecular database. We also used the Cycle 1 SiO(8–7) and C34 S(7–6) emission at 347330.63 and 337396.69 MHz (also from JPL), respectively, as well as the continuum to show the jet direction, the asymmetric cavity, and the surrounding envelope (Fig. 1; see also Tabone et al. 2017).
CH3CHO and HDO emission lines detected towards HH 212 mm during Cycle 1 and Cycle 4 observations.
3 Spectra and images
Our ALMA dataset allows us to detect 14 CH3CHO emission lines (12 in Cycle 1, and 2 in Cycle 4). Figure 2 shows the spectra extracted from the protostellar position: the profiles, fit using the GILDAS package (see Table 1; note that in two cases, two CH3CHO lines are blended), are Gaussian-like and the S∕N of the Tpeak is always higher than 6. The line excitation is high, with Eu from 163 to 215 K. In addition, we detect in the Cycle 4 spectra the 33,1 –42,2 line of deuterated water (HDO), with Eu = 335 K (S∕N ~ 12). All the emission lines peak at velocities close to the systemic velocity vsys = +1.7 km s−1 (Lee et al. 2014) and their FWHM line widths are between +5.1 and +6.6 km s−1, in agreement with the same CH3CHO and HDO lines detected at lower angular resolution by Codella et al. (2017). We note that the fluxes as integrated over the whole velocity range are measured with a dynamical range of 10–50.
Figure 1 (middle panels) reports the spatial distribution of the CH3CHO(181,17–171,16)E and CH3CHO(184,15–174,14)A emission (observed in Cycle 1) integrated over ±5 km s−1 with respect to vsys. These maps are representative of the spatial distributions of all the CH3CHO lines detected in Cycle 1. The CH3CHO emission was not spatially resolved when observed with a beam of ~0.′′6 by Codella et al. (2017), and our Cycle 1 maps (~0.′′4) are still spatially unresolved. The Cycle 4 images with higher spatial resolution (see Fig. 1) allow us to resolve the size of the total emitting regions, obtained with 2D Gaussian fits (after deconvolving the beam size): 161 ± 17 mas (HDO), 205 ± 25 mas (CH3CHO-A), and 213 ± 34 mas (CH3CHO-E). The average is then ~0.′′18, that is, 73 au.
 |
Fig. 1 Left panel: HH 212 protostellar system as observed by ALMA-Band 7 during Cycle 1. Blue and red contours plot the blue- and red-shifted SiO(8–7) jet and the C34S(7–6) asymmetric cavity (magenta and green contours) overlaid on the continuum at 0.9 mm (white contours). Positions are given with respect to the coordinates of the MM1 protostar, reported in Sect. 2. The filled ellipse shows the synthesised beam (HPBW) for the continuum: 0.′′36 × 0.′′28 (–62°). The beam for the SiO and C34S images is 0.′′43 × 0.′′33 (–64°). First contours and steps for the continuum are 5σ (1.5 mJy beam−1) and 60σ, respectively. For SiO, the first contours and steps are 5σ and 25σ, respectively: the blue map has been obtained by integrating down to –21 km s−1 (1σ = 29 mJy beam−1 km s−1), and the red map collects emission up to +12 km s−1 (1σ = 23 mJy beam−1 km s−1). The C34 S map has been obtained by integrating the velocities from −1 to +1 km s−1 with respect to the systemic velocity vsys = +1.7 km s−1 (Lee et al. 2014): the first contour and steps are 5σ (10 mJy beam−1 km s−1) and 3σ, respectively. Central panels: zoom-in of the central region as observed by ALMA Band 7 Cycle 1: CH3CHO(181,17–171,16)E and CH3CHO(184,15–174,14)A emission integrated over ±5 km s−1 with respect to vsys (black contours). The first contours and steps are 3σ (18 mJy beam−1 km s−1). The HPBWs are 0.′′41 × 0.′′33 (–64°) for CH3CHO(181,17–171,16) E and of the equatorial plane, and 0.′′44 × 0.′′33 (–63°) for CH3CHO(184,15–174,14)A. The black triangle shows the MM1 coordinates, and the tilted cross indicates the directions of the jet and of the equatorial plane. Right panels: further zoom-in of the central region, as observed by ALMA Band 7 Cycle 4, showing the HDO(33,1–42,2), CH3CHO(180,18–170,17)E, and CH3CHO(180,18–170,17)A. The emission was integrated over 10 km s−1 around vsys (upper panels; black contours). The first contours and steps are 3σ (14 mJy beam−1 km s−1). The HPBW is 0.′′15 × 0.′′12 (PA = − 88°). The corresponding first-moment maps are reported in colour scale in the lower panels. Contours are from 0 to +4 km s−1 in steps of 0.5 km s−1. |
 |
Fig. 2 CH3CHO and HDO line profiles in Tb scale (with a spectral resolution of 1 km s−1) observed during ALMA Cycle 1 and 4 (right panels) operations. Species, transitions, and upper level excitations (Eu in K) are reported (see Table 1). The vertical dashed line stands for the systemic velocity vsys = +1.7 km s−1 (e.g. Lee et al. 2014). Red curves are Gaussian fits, the results of which are reported in Table 1. In some of the panels, vertical red segments indicate an additional CH3CHO line close to that centred at vsys. The CH2DOH labels (see also the magenta profile in the upper left panel, residual of the (185,14 –175,13)A and (185,13–175,12)A fit) are for emission lines of deuterated methanol, published by Bianchi et al. (2017). Some unidentified lines (U labels) are also reported. |
4 Physical properties
Given the lack of the collisional rate coefficients available in literature, the excitation temperature and column density of CH3CHO were derived using the rotational diagram approach (Fig. 3), assuming local thermodynamic equilibrium (LTE) conditions and optically thin emission. We used Cycle 1 and Cycle 4 emission lines, and following the maps of Fig. 1, corrected the observed intensities for a source size (of the total emitting region) of 0.′′18. We derived an excitation temperatureof 78 ± 14 K and column density of 7.6 ± 3.2 × 1015 cm−2. The temperatureagrees reasonably well with the Cycle 0 results reported by Codella et al. (2017), and it is also consistent with the temperatures of 165 ± 85 K and 171 ± 52 K derived from methanol observations (covering a similar excitation range) by Lee et al. (2017b) and Bianchi et al. (2017). On the other hand, the column density is higher by a factor 4 than what was reported by Codella et al. (2017). This discrepancy, however, can be explained given the size of 0.′′3 assumed in Codella et al. (2017). The lower column density derived using the Cycle 0 dataset is an average over a larger assumed emission area. The Cycle 4 data analysed in this paper allow us to measure the size of the emitting region, hence to obtain a reliable measure of the CH3CHO column density and an improved estimate of the abundance. As stressed in Codella et al. (2017), the continuum emission, being optically thick (see e.g. Lee et al. (2017a), and references therein), cannot be used to derive an N(H2) estimate. However, assuming H2 column densities around 1024 cm−2, which is a typical value for hot corinos in Perseus and in B335 (Taquet et al. 2015; Imai et al. 2016), we can infer  8 × 10⁻⁹. This is in good agreement with the CH3CHO abundance found in a region within a few 10 au around the B335 protostar using ALMA (2 × 10⁻⁹; Imai et al. 2016).
The HDO emission was analysed using a non-LTE Large Velocity Gradient (LVG) model (see Ceccarelli et al. 2003), assuming collisional coefficients for the system HDO–H2 computed by Faure et al. (2012). A Boltzmann distribution for the ortho-to-para H2 ratio, in agreement with the Faure et al. (2012) computations, was found, showing that para-H2 and ortho-H2 collisional coefficients are different only at temperatures ≪45 K. Different to Codella et al. (2017), we can now use the measured size of 0.′′18. Figure 3 shows the LVG predictions in the Tkin − N(HDO) plane for densities of 108 cm−3 (blue), 109 cm−3 (magenta), and 1010 cm−3 (red; representing the LTE regime). When we assume N(HDO)/N(H2O) ≤ 0.1, XH2O = 3 × 10⁻⁵ (see Codella et al. 2017), and a source size of 0.′′18, then Fig. 3 shows that only densities of at least 108 cm−3 are possible, leading to N(HDO) ≤ 3 × 1017 cm−2. Densities of 107 cm−3 would imply N(HDO) ≤ 3 × 1016 cm−2, which are values that were ruled out by the LVG solutions in Fig. 3. With a density of 108 cm−3, the opacity of the HDO line is 0.3, while lower values are expected for higher densities. The temperatures derived from CH3CHO (grey regionin Fig. 3) are consistent with the solutions found with HDO. In conclusion, our dataset allow us to further constrain the physical properties associated with HDO and CH3CHO: Tkin = 78 ± 14 K and  108 cm−3.
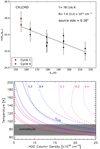 |
Fig. 3 Upper panel: rotation diagrams for CH3CHO, derived using Cycle 1 (black points) and Cycle 4 (red) data. A total emitting region size of 0.′′18 is assumed (see text). The parameters Nu, gu, and Eup are the column density, degeneracy, and energy of the upper level, respectively. The derived values of the rotational temperature and total column density are reported. Lower panel: LVG predictions of the temperature vs. HDO column density required to reproduce the observed velocity-integrated emission (the portion of the plot delimited by solid curves; see Table 1) densities of 108 cm−3 (blue), 109 cm−3 (magenta), and 1010 cm−3 (red). Dashed lines are for the optical depth (τ = 0.3 and 0.4), increasing with column density. A source size of 0.′′18 is assumed. The grey zone shows the temperature derived from CH3CHO (see upper panel). |
5 Kinematics
The study of kinematics is instructive: Fig. 1 (lower panels) reports the distribution of the first moment of the HDO and CH3CHO Cycle 4 images. We detect a velocity gradient (±2 km s−1 with respect to the systemic velocity) directed along the equatorial plane over a ~70 au scale, consistent with the gradients detected in the envelope and in the disc (e.g. Wiseman et al. 2001; Lee et al. 2014, 2017b; Codella et al. 2014; Podio et al. 2015; Leurini et al. 2016), that is, blue-shifted towards the north-west and red-shifted towards the south-east. Additional information is obtained from the channel maps (shown Fig. 4 with a spectral resolution of 1 km s−1). The sizes and centroids of the emitting regions were obtained from elliptical Gaussian fits in the uv domain5. The sizes (derived at vsys) are consistent within the errors:
178(10) × 118(10) mas (72 × 48 au; HDO);
166(14) × 100(16) mas (67 × 41 au; CH3CHO-A);
169(15) × 146(15) mas (68 × 59 au; CH3CHO-E).
At high velocities, we clearly spatially resolve the red- and blue-shifted regions that move away from the jet axis. This reveales the velocity gradient. These spatial sizes overlap well with the disc traced by Lee et al. (2017a) using ALMA continuum emission in Band 7 with a spatial resolution of 8 au (see Fig. 5). Although comparisons between images taken at different angular resolutions have to be made with caution, Fig. 5 suggests that HDO and CH3CHO originate from a radius consistent with that of the dusty disc around the protostar (60 au).
Figure 6 reports for HDO and CH3CHO A&E the emission centroid positions in each channel, also obtained from elliptical Gaussian fits in the uv domain with the original 0.42 km s−1 in order to better trace kinematics. The centroid distributions do not show a trend expected for inner free-falling envelopes (v ~ r−1) or discs (v ~ r−1∕2), where at higher velocities the positions of the blue- and red-shifted clumps approach each other. We observe exactly the opposite trend (see Sect. 6 for more details in this aspect). Conversely, this trend was indeed observed using C17O(3–2) and HCO+(4–3), as observed at 0.′′6 angular resolution by Codella et al. (2014) and Lee et al. (2014), respectively, revealing a rotating molecular disc/inner envelope. Figure 5 further compares the spatial distribution of HDO and CH3CHO at velocities6 vsys ± 2–3 km s−1 with that of C17O(3–2) as observed in the same dataset as presented here. HDO and CH3CHO are more compact than C17O, which is more elongated along the equatorial plane. This confirms that these molecules trace different gas components (see Sect. 6).
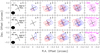 |
Fig. 4 Channel maps of the HDO(33,1–42,2) (upper panels) and CH3CHO(180,18–170,17) E&A (lower panels) blue- and red-shifted (continuum-subtracted) emissions observed during ALMA Cycle 4 towards the HH 212 mm protostar. Each panel shows the emission integrated over a velocity interval of 1 km s−1 shifted with respect to the systemic velocity (see the magenta channel, sampling the velocity between +1.5 km s−1 and +2.5 km s−1) by the value given in the upper right corner. The black cross (oriented to illustrate the direction of the SiO jet and consequently the equatorial plane, see Fig. 1) indicates the position of the protostar. The ellipse in all the leftmost panels shows the ALMA synthesised beam (HPBW): 0.′′15 ×0.′′12 (PA = –88°). First contours and steps correspond to 3σ (4.5 mJy beam−1 km s−1 for HDO and 3.0 mJy beam−1 km s−1 for CH3CHO). |
 |
Fig. 5 HDO(33,1–42,2) (upper), CH3CHO(180,18–170,17) E&A (middle), and C17O(3–2) (lower) channel maps emitting vsys ± 2–3 km s−1 (blue and red) overlaid on top of the disc traced by Lee et al. (2017a) using ALMA Band 7 continuum observations (grey scale). C17O(3–2) emission (a tracer of the HH 212 disc at these velocities; see also Codella et al. 2014) has also been observed in our Cycle 4 dataset (Tabone et al. 2017). The first contours and steps correspond to 3σ (60 mJy beam−1 km s−1 for HDO and CH3CHO, and 73 mJy beam−1 km s−1 for C17O) and 5σ, respectively. |
6 Discussion
We wish to answer the question about the origin of the hot, dense, chemically enriched, and rotating gas around HH 212 mm. Our findings indicate that HDO and CH3CHO emissions are related to the disc. The disc dominates the central mass (as seen in the continuum), and its sense of rotation matches the velocity pattern seen in the observed lines. Figure 7 reports the position-velocity (PV) diagrams of HDO and CH3CHO along the equatorial plane (left panels) and the jet axis (right). The velocity gradient associated with the disc is clearly observed (quite similar to what was found using CH3OH and CH2DOH by Lee et al. 2017b), while the PVs along the axis of the jet do not show a conclusive trend.
6.1 Origin of the iCOM emission
It is instructive to compare our images with those reported by Lee et al. (2017b): the authors found that CH3OH and NH2CHO (among other species) trace the surface layers (i.e. the atmosphere) of the disc within the centrifugal barrier located at ~44 au. We note that Bianchi et al. (2017), using the same ALMA dataset as we do here, found very similar images for 13CH3OH. The iCOM emission detected by Lee et al. (2017b) probes two thin (~50 mas) layers aboveand below the opaque mid-plane of the disc. The maps reported here follow the iCOM vertical distribution up to about ±100 mas from the equatorial plane. A plausible explanation is that HDO and CH3CHO trace the same surface layers as were detected by Lee et al. (2017b), but convolved with a larger beam, which means that we see a single structure instead of two thin layers. Once again, the comparison reported in Fig. 6 has to be interpreted with caution, given the different angular resolution of the two datasets. However, Fig. 6 shows that the centroids (i.e. the barycenter of the emitting size as measured in the uv domain) of the emission preferentially peak towards the southern surface layers, in agreement with Lee et al. (2017b) who found brighter methanol and formaldeyde emission at this location. However, we cannot exclude that HDO and CH3CHO complement the CH3OH and NH2CHO images on spatial scales larger than those used by Lee et al. (2017b), hence tracing more extended emission.
The PV diagrams obtained from the HDO and CH3CHO images along the equatorial plane (Fig. 7, left panels) show a linear velocity gradient that strongly suggests a narrow rotating ring seen edge-on. In this case, the projected velocity is expected to be proportional to the projected position offset from the protostar, as is observed. Other interpretations in terms of a strongly self-gravitating structure with M ∝ r3 are unlikely, as the dynamics of the infalling envelope and of the inner disc in HH 212 are better reproduced by a dominating central mass ~0.2 M⊙ (Lee et al. 2017c, 2018). Figure 7 further indicates a radius for the emitting ring of ≃0.′′15 (60 au), in agreement with the radius of the centrifugal barrier of 0.′′11–0.′′12 derived at higher resolution from HCO+ infall kinematics by Lee et al. (2017b). Hence, our results are consistent with a strong chemical enrichment in iCOMs in the ring where the infalling envelope on the rotating disc, possibly due to low-velocity accretion shocks. A similar effect has been observed in other more evolved protostars (see e.g. Sakai et al. 2014a,b, 2016, 2017; Oya et al. 2016, and references therein), which also supports this interpretation. Figure 5 shows that C17O is radially more extended than HDO and iCOMs: this supports that the C17O as observed at low velocities by Codella et al. (2014) using Cycle 0 images with a resolution of ~0.′′6 might tracethe inner portion of the infalling envelope (the C17O rotation curve is also consistent with angular momentum conservation down to ~0.′′1 of the source, see the magenta curve in their Fig. 3), while iCOMs (see Lee et al. 2017b and our images) trace the outer region of the molecular disc, which has then a radius of about 40–45 au. On the other hand, because the iCOMs around the HH 212 protostar are expected to be associated with low-velocity accretion shocks, they are either formed directly in the external disc layers through gas-phase chemical reactions or are directly injected into the gas-phase by thermal desorption from grain mantles of an inner portion of the disc (e.g. Lee et al. 2017b; Codella et al. 2017, and references therein, for a recent discussion).
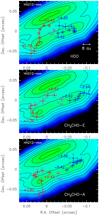 |
Fig. 6 Distribution of the HDO(33,1–42,2) (upper panel), and CH3CHO(180,18–170,17) E&A (middle and lower panels) centroid positions (from fits in the uv domain with1σ error bars) in the velocity channels (sampled at the original spectral resolution of 0.42 km s−1). Magenta points show the emission in the channel sampling the systemic velocity, and red and blue datapoints denote the channels that are red- and blue-shifted in the velocity range (with respect to vsys), as identified by the labels. The points are overlaid on the disc traced by Lee et al. (2017a) using ALMA Band 7 continuum observations (colour scale and contours). |
 |
Fig. 7 Position–velocity cut of HDO(33,1–42,2) (colour scale, magenta contours) along (left panels) and perpendicular (right panels) to the equatorial plane (PA = 112°; see Fig. 1) overlaid with the CH3CHO(180,18–170,17)-E (upper panels) and CH3CHO(180,18–170,17)-A (lower panels), drawn as white contours. The first contours and steps correspond to 3σ (3.1 K km s−1). Dashed lines mark the position of the HH 212 mm protostar and the cloud VLSR (+1.7 km s−1; Lee et al. 2014). The error bars are drawn in the bottom right corners. |
6.2 Low-velocity emission: outflowing and expanding rings
Figures 4 and 5 show iCOM emission up to 40–50 au above and below the disc plane, suggesting a vertical structure for the centrifugal barrier (see also Sakai et al. 2017). Are these iCOMs ouflowing, thus leaving the protostellar system? Interestingly, all the three Cycle 4 HDO and CH3OH images show emission peaks at low blue- and red-shifted velocities, ±1 km s−1 from vsys, which look offset from the equatorial plane. Although this result has to be verified using datasets with higher spatial resolution, it is interesting to note that this offset has previously been suggested by lower (~0.′′6) angular resolution CH3OH images by Leurini et al. (2016) and was found in the 13CH3OH maps reported by Bianchi et al. (2017) using our Cycle 4 dataset. More specifically, when we focus on the low-velocity emission of Fig. 6, the red-shifted emission lies to the north-east and the blue-shifted emission is mainly detected to the south-west. The observed offset is clearly inconsistent with the direction of the jet (the blue-shifted lobe lies to the north-east and the red-shifted lobe to the south-west, see Fig. 1). In addition, infall motions can clearly be ruled out since we are observing the system so close to edge-on: any vz infall motion is going to be projected at values too low (≤±0.2 km s−1 at a radius of 40 au) to produce a shift ±1 km s−1 between the red and blue peaks. In such an edge-on view and at the current spectral resolution, we are mostly sensitive to the velocity component in the equatorial plane. In this case, the fact that maps at +1 km s−1 peak in the northern (blue-shifted) lobe and the maps at –1 km s−1 peak in the southern red-shifted lobe could be explained by outflowing and expanding material that is observed against a strong optically thick disc (Lee et al. 2017c). The line excitation temperature (≥80 K) is close to the dust temperature (80–90 K; Lee et al. 2017c), therefore the line emission from the near side will not be detected on top of the continuum, because it is negligible with respect to the background flux. Figure 8 reports a sketch (not to scale) of the expected kinematics in the two cases of outflowing and infaling material. Our images indicate that we observe only some portions of the outflowing and expanding gas, that is, the far side, (red-shifted) in the upper part, and the near side (blue-shifted) in the lower part. If, in addition, the ring is rotating, the rotation motion will distort the gradient so that red-shifted emission peaks to the north-east and blue-shifted emission to the south-west, as is indeed observed.
Interestingly, the trend observed in HDO and CH3CHO (and CH3OH) at ±1 km s−1 is not observed in SO(1011–1010) and C17O Cycle 0 data at the same velocities (see Fig. 5 of Podio et al. 2015 and Fig. A.1 of Codella et al. 2014). A reasonable explanation is that SO and C17O (Codella et al. 2014; Podio et al. 2015; Tabone et al. 2017) probes larger regions than iCOMs, where optical depth effects against the dust disc are definitely diluted.
Finally, the spatial extent of the iCOMs structure is consistent with the results obtained for the L1527 protostar by Sakai et al. (2017): the authors suggest that a fraction of the gas slowly moves away from the disc mid-plane at the centrifugal barrier towards vertical directions. Figure 7 indicates that this effect is more important for HDO, which shows a slightly wider distribution (±0.′′2) than that of CH3CHO. The possibility that HDO might be associated with outflowing motion has previously been proposed by Codella et al. (2017) based on the observed line profiles as obtained from ALMA data at lower (~0.′′6) spatial resolution.
 |
Fig. 8 Cartoon (not to scale) illustrating the scenario expected in the inner 60 au region around the protostar for low-velocity emission (≤1 km s−1 with respect to vsys) in case of outflowing (left panel) or infalling (right panel) chemically enriched gas (see text). |
6.3 Chemically enriched disc wind?
Finally, it is intriguing to discuss whether our maps show signatures of the disc wind, as suggested by Codella et al. (2017), using CH3OH, Lee et al. (2017b), HCO+, and by Tabone et al. (2017) and Lee et al. (2018), SO and SO2. More specifically, SO and SO2 appear to trace the outflow motion farther away from the disc (e.g. Fig. 3 of Tabone et al. 2017; see also Lee et al. 2018). Hence the emission is collimated and fast, with the projected velocity vr ≪ vz. On the other hand, by tracing HDO and CH3CHO, we could look closely at the plane of the disc. The outflowing ring of gas might sample a flow that expands and is slower. Detailed models of magnetohydrodynamics disc winds are required to further analyse this aspect, that is to say, to verify whether a portion of the HDO and CH3CHO gas traces a complementary part of the SO and SO2 outflow.
7 Summary
We presented Cycle 1 and Cycle 4 ALMA Band 7 observations of HDO and CH3CHO towards the HH 212 mm Class 0 object in Orion B. The results confirm that astrochemistry is a powerful tool for imaging different kinematical components around protostars on solar system scales. The main findings are summarised below:
- 1.
Many (14) CH3CHO emission lines (with Eu in the 163–215 K range) and 1 HDO line with Eu = 335 K have been imaged: the emitting regions extend vertically over ~0.′′18 (73 au). All the detected profiles peak around the systemic velocity and are ~5−7 km s−1 wide.
- 2.
The LTE analysis of the CH3CHO emission leads to a temperature of 78 ± 14 K and a column density of 7.6 ± 3.2 × 1015 cm−2. When we assume
 = 1024 cm−2, the CH3CHO abundance is
  8 × 10⁻⁹. On the other hand, the LVG analysis of the HDO emission at 335 K severely constrains the volume density,
 108 cm−3, and indicates column densities N(HDO) ≤ 3 × 1017 cm−2.
 - 3.
CH3CHO and HDO both show a velocity gradient of about ±2 km s−1 with respect to the systemic velocity along the equatorial plane. The blue-shifted emission is located towards the north-west, and the red-shifted emission lies towards the south-east, in agreement with what has previously been found using other molecular tracers of the inner protostellar region (such as C17O, SO, HCO+, CH3OH, and NH2CHO).
- 4.
The CH3CHO and HDO PV diagrams along the equatorial plane show increasing velocities at increasing distance from the protostar. This is most likely the signature of emission from an edge-on ring of chemically enriched warm gas. The radius is ≃0.′′15 (60 au), well in agreement with (i) previous measurements based on other iCOMs such as NH2CHO (Lee et al. 2017b), (ii) the radius of the optically thick disc observed through the continuum (Lee et al. 2017a), and (iii) the location of the centrifugal barrier inferred from HCO+ infall kinematics (Lee et al. 2017b). Hence, our data appear to probe chemically enriched gas where the infalling envelopemeets the rotating disc, where it probably creates low-velocity shocks. Accurate modelling to investigate the chemistry induced by low-velocity shock is needed.
- 5.
Our images show CH3CHO and HDO emission at low velocities (±1 km s−1 from vsys) up to 40–50 au above and below the disc plane. This supports a vertical structure for the centrifugal barrier, as has recently been found for the more evolved L1527 protostar (Sakai et al. 2017). The observed spatial distributions could bethe signature of two outflowing, expanding, and rotating rings above or below the optically thick equatorial disc plane, which could be a signature of the basis of a disc wind. Clearly, further ALMA observations are needed to verify this possibility.
Acknowledgements
We thank the referee, P. Ho, for valuable comments and suggestions. This paper makes use of the ADS/JAO.ALMA#2016.1.01475.S data (PI: C. Codella). ALMA is a partnership of ESO (representing its member states), NSF (USA) and NINS (Japan), together with NRC (Canada) and NSC and ASIAA (Taiwan), in cooperation with the Republic of Chile. The Joint ALMA Observatory is operated by ESO, AUI/NRAO and NAOJ. We are warmly grateful to S. Yamamoto, N. Sakai, and Y. Oya for instructive discussion on astrochemistry as applied to the HH212 system. We also thank M. Kounkel and L. Hartmann for valuable comments on distances of the Orion cloud, and in particular of HH 212. This work was supported by (i) the program PRIN-MIUR 2015 STARS in the CAOS – Simulation Tools for Astrochemical Reactivity and Spectroscopy in the Cyberinfrastructure for Astrochemical Organic Species (2015F59J3R, MIUR Ministero dell’Istruzione, dell’Università della Ricerca e della Scuola Normale Superiore), (ii) the PRIN-INAF 2016 “The Cradle of Life – GENESIS-SKA (General Conditions in Early Planetary Systems for the rise of life with SKA)”, and (iii) the European Research Council (ERC) under the European Union’s Horizon 2020 research and innovation programme, for the Project “The Dawn of Organic Chemistry” (DOC), grant agreement No. 741002. M.T. and R.B. acknowledge partial support from MINECO project AYA2016-79006-P.
References
- Bianchi, E., Codella, C., Ceccarelli, C., et al. 2017, A&A, 606, L7 [NASA ADS] [CrossRef] [EDP Sciences] [Google Scholar]
- Cabrit, S., Pety, J., Pesenti, N., & Dougados, C. 2007, A&A, 452, 897 [Google Scholar]
- Cabrit, S., Codella, C., Gueth, F., & Gusdorf, A. 2012, A&A, 548, L2 [NASA ADS] [CrossRef] [EDP Sciences] [Google Scholar]
- Ceccarelli, C., Maret, S., Tielens, A. G. G. M., Castets, A., & Caux, E. 2003, A&A, 410, 587 [NASA ADS] [CrossRef] [EDP Sciences] [Google Scholar]
- Ceccarelli, C., Caselli, P., Herbst, E., Tielens, A. G. G. M., & Caux, E. 2007, Protostars and Planets V (Tucson: University of Arizona), 47 [Google Scholar]
- Ceccarelli, C., Caselli, P., Bockeliée-Morvan, D., et al. 2015 Protostars and Planets V (Tucson: University of Arizona), 859 [Google Scholar]
- Codella, C., Cabrit, S., Gueth, F., et al. 2007, A&A, 462, L53 [NASA ADS] [CrossRef] [EDP Sciences] [Google Scholar]
- Codella, C., Cabrit, S., Gueth, F., et al. 2014, A&A, 568, L5 [Google Scholar]
- Codella, C., Ceccarelli, C., Caselli, P., et al. 2017, A&A, 605, L3 [Google Scholar]
- Faure, A., Wiesenfeld, L., Scribano, Y., & Ceccarelli, C. 2012, MNRAS, 420, 699 [NASA ADS] [CrossRef] [MathSciNet] [Google Scholar]
- Harsono, D., van Dishoeck, E. F., Bruderer, S., Li, Z.-Y., & Jørgensen, J.K. 2015, A&A, 577, A22 [NASA ADS] [CrossRef] [EDP Sciences] [Google Scholar]
- Herbst, E., & van Dishoeck, E. F. 2009, ARA&A, 47, 427 [NASA ADS] [CrossRef] [Google Scholar]
- Imai, M., Sakai, N., Oya, Y., et al. 2016, ApJ, 830, L37 [NASA ADS] [CrossRef] [Google Scholar]
- Jørgensen, J. K., van der Wiel, M. H. D., Coutens, A., et al. 2016, A&A, 595, A117 [NASA ADS] [CrossRef] [EDP Sciences] [Google Scholar]
- Kounkel, M., Hartmann, L., Loinard, L., et al. 2017, ApJ, 834, 142 [NASA ADS] [CrossRef] [Google Scholar]
- Lee, C.-F., Ho, P. T. P., Beuther, H., et al. 2006, ApJ, 639, L292 [NASA ADS] [CrossRef] [Google Scholar]
- Lee, C.-F., Ho, P. T. P., Hirano, N., et al. 2007, ApJ, 659, L499 [NASA ADS] [CrossRef] [Google Scholar]
- Lee, C.-F., Ho, P. T. P., Bourke, T. L., et al. 2008, ApJ, 685, 1026 [NASA ADS] [CrossRef] [Google Scholar]
- Lee, C.-F., Hirano, N., Zhang, Q., et al. 2014, ApJ, 786, 114 [NASA ADS] [CrossRef] [Google Scholar]
- Lee, C.-F., Hirano, N., Zhang, Q., et al. 2015, ApJ, 805, 186 [NASA ADS] [CrossRef] [Google Scholar]
- Lee, C.-F., Hwang, H.-C., & Li, Z.-Y. 2016 ApJ, 826, 213 [NASA ADS] [CrossRef] [Google Scholar]
- Lee, C.-F., Li, Z.-Y., Ho P.-T.-P., et al. 2017a, Sci. Adv., 3, 2935 [Google Scholar]
- Lee, C.-F., Li, Z.-Y., Ho P.-T.-P., et al. 2017b, ApJ, 843, L27 [NASA ADS] [CrossRef] [Google Scholar]
- Lee, C.-F., Ho P.-T.-P., Li, Z.-Y., et al. 2017c, Nat. Astron., 1, 152 [NASA ADS] [CrossRef] [Google Scholar]
- Lee, C.-F., Li, Z.-Y., Codella, C., et al. 2018, ApJ, 856, L14 [NASA ADS] [CrossRef] [Google Scholar]
- Leurini, S., Codella, C., Cabrit, S., et al. 2016, A&A, 595, L4 [NASA ADS] [CrossRef] [EDP Sciences] [Google Scholar]
- Martí-Vidal, I., Vlemmings, W. H. T., Müller, S., & Casey, S. 2014, A&A, 563, A136 [NASA ADS] [CrossRef] [EDP Sciences] [Google Scholar]
- Murillo, N. M., Lai, S.-P., Bruderer, S., Harsolo, D., & van Dishoeck, E. F. 2013, A&A, 560, A103 [NASA ADS] [CrossRef] [EDP Sciences] [Google Scholar]
- Oya, Y., Sakai, N., López-Sepulcre, A., et al. 2016, ApJ, 824, 88 [NASA ADS] [CrossRef] [Google Scholar]
- Pickett, H. M., Poynter, R. L., Cohen, E. A., et al. 1998, J. Quant. Spectr. Rad. Transf., 60, 883 [NASA ADS] [CrossRef] [Google Scholar]
- Podio, L., Codella, C., Gueth, F., et al. 2015, A&A, 581, A85 [NASA ADS] [CrossRef] [EDP Sciences] [Google Scholar]
- Sakai, N., Sakai, T., Hirota, T., et al. 2014a, Nature, 507, 78 [NASA ADS] [CrossRef] [Google Scholar]
- Sakai, N., Oya, Y., Sakai, T., et al. 2014b, ApJ, 791, L38 [NASA ADS] [CrossRef] [Google Scholar]
- Sakai, N., Oya, Y., López-Sepulcre, A., et al. 2016, MNRAS, 820, L34 [Google Scholar]
- Sakai, N., Oya, Y., Higuchi, A. E., et al. 2017, MNRAS, 467, L76 [NASA ADS] [Google Scholar]
- Tabone, B., Cabrit, S., Bianchi, E., et al. 2017, A&A, 607, L6 [NASA ADS] [CrossRef] [EDP Sciences] [Google Scholar]
- Taquet, V., López-Sepulcre, A., Ceccarelli, C., et al. 2015, ApJ, 804, 81 [NASA ADS] [CrossRef] [Google Scholar]
- Tobin, J., Hartmann, L., Looney, L. W., & Chiang, H.-F. 2010, ApJ, 712, 1010 [NASA ADS] [CrossRef] [Google Scholar]
- Wiseman, J., Wootten, A., Zinnecker, H., & McCaoughrean, M. 2001, ApJ, 550, L87 [NASA ADS] [CrossRef] [Google Scholar]
- Zinnecker, H., McCaughrean, M. J., & Rayner, J. T. 1998, Nature, 394, 862 [NASA ADS] [CrossRef] [PubMed] [Google Scholar]
Errors on absolute positions of these sources at these frequencies are smaller than 1 mas (https://almascience.eso.org/sc/).
We used the GILDAS uv-fit task, which allows fitting models directly through the uv visibilities. The error on centroid position provided by uv-fit is the function of the channel S/N and atmospheric seeing, and is typically much smaller than the beam size. As reported by Martí-Vidal et al. (2014), for instance, an unlimited over-resolution power can, in principle, be achieved if the dynamic range of the observations is arbitrarily large.
These velocities allow us to trace the disc because at velocities closer to vsys, the emission is dominated by the molecular static cloud.
All Tables
CH3CHO and HDO emission lines detected towards HH 212 mm during Cycle 1 and Cycle 4 observations.
All Figures
|
Fig. 1 Left panel: HH 212 protostellar system as observed by ALMA-Band 7 during Cycle 1. Blue and red contours plot the blue- and red-shifted SiO(8–7) jet and the C34S(7–6) asymmetric cavity (magenta and green contours) overlaid on the continuum at 0.9 mm (white contours). Positions are given with respect to the coordinates of the MM1 protostar, reported in Sect. 2. The filled ellipse shows the synthesised beam (HPBW) for the continuum: 0.′′36 × 0.′′28 (–62°). The beam for the SiO and C34S images is 0.′′43 × 0.′′33 (–64°). First contours and steps for the continuum are 5σ (1.5 mJy beam−1) and 60σ, respectively. For SiO, the first contours and steps are 5σ and 25σ, respectively: the blue map has been obtained by integrating down to –21 km s−1 (1σ = 29 mJy beam−1 km s−1), and the red map collects emission up to +12 km s−1 (1σ = 23 mJy beam−1 km s−1). The C34 S map has been obtained by integrating the velocities from −1 to +1 km s−1 with respect to the systemic velocity vsys = +1.7 km s−1 (Lee et al. 2014): the first contour and steps are 5σ (10 mJy beam−1 km s−1) and 3σ, respectively. Central panels: zoom-in of the central region as observed by ALMA Band 7 Cycle 1: CH3CHO(181,17–171,16)E and CH3CHO(184,15–174,14)A emission integrated over ±5 km s−1 with respect to vsys (black contours). The first contours and steps are 3σ (18 mJy beam−1 km s−1). The HPBWs are 0.′′41 × 0.′′33 (–64°) for CH3CHO(181,17–171,16) E and of the equatorial plane, and 0.′′44 × 0.′′33 (–63°) for CH3CHO(184,15–174,14)A. The black triangle shows the MM1 coordinates, and the tilted cross indicates the directions of the jet and of the equatorial plane. Right panels: further zoom-in of the central region, as observed by ALMA Band 7 Cycle 4, showing the HDO(33,1–42,2), CH3CHO(180,18–170,17)E, and CH3CHO(180,18–170,17)A. The emission was integrated over 10 km s−1 around vsys (upper panels; black contours). The first contours and steps are 3σ (14 mJy beam−1 km s−1). The HPBW is 0.′′15 × 0.′′12 (PA = − 88°). The corresponding first-moment maps are reported in colour scale in the lower panels. Contours are from 0 to +4 km s−1 in steps of 0.5 km s−1. |
| In the text | |
|
Fig. 2 CH3CHO and HDO line profiles in Tb scale (with a spectral resolution of 1 km s−1) observed during ALMA Cycle 1 and 4 (right panels) operations. Species, transitions, and upper level excitations (Eu in K) are reported (see Table 1). The vertical dashed line stands for the systemic velocity vsys = +1.7 km s−1 (e.g. Lee et al. 2014). Red curves are Gaussian fits, the results of which are reported in Table 1. In some of the panels, vertical red segments indicate an additional CH3CHO line close to that centred at vsys. The CH2DOH labels (see also the magenta profile in the upper left panel, residual of the (185,14 –175,13)A and (185,13–175,12)A fit) are for emission lines of deuterated methanol, published by Bianchi et al. (2017). Some unidentified lines (U labels) are also reported. |
| In the text | |
|
Fig. 3 Upper panel: rotation diagrams for CH3CHO, derived using Cycle 1 (black points) and Cycle 4 (red) data. A total emitting region size of 0.′′18 is assumed (see text). The parameters Nu, gu, and Eup are the column density, degeneracy, and energy of the upper level, respectively. The derived values of the rotational temperature and total column density are reported. Lower panel: LVG predictions of the temperature vs. HDO column density required to reproduce the observed velocity-integrated emission (the portion of the plot delimited by solid curves; see Table 1) densities of 108 cm−3 (blue), 109 cm−3 (magenta), and 1010 cm−3 (red). Dashed lines are for the optical depth (τ = 0.3 and 0.4), increasing with column density. A source size of 0.′′18 is assumed. The grey zone shows the temperature derived from CH3CHO (see upper panel). |
| In the text | |
|
Fig. 4 Channel maps of the HDO(33,1–42,2) (upper panels) and CH3CHO(180,18–170,17) E&A (lower panels) blue- and red-shifted (continuum-subtracted) emissions observed during ALMA Cycle 4 towards the HH 212 mm protostar. Each panel shows the emission integrated over a velocity interval of 1 km s−1 shifted with respect to the systemic velocity (see the magenta channel, sampling the velocity between +1.5 km s−1 and +2.5 km s−1) by the value given in the upper right corner. The black cross (oriented to illustrate the direction of the SiO jet and consequently the equatorial plane, see Fig. 1) indicates the position of the protostar. The ellipse in all the leftmost panels shows the ALMA synthesised beam (HPBW): 0.′′15 ×0.′′12 (PA = –88°). First contours and steps correspond to 3σ (4.5 mJy beam−1 km s−1 for HDO and 3.0 mJy beam−1 km s−1 for CH3CHO). |
| In the text | |
|
Fig. 5 HDO(33,1–42,2) (upper), CH3CHO(180,18–170,17) E&A (middle), and C17O(3–2) (lower) channel maps emitting vsys ± 2–3 km s−1 (blue and red) overlaid on top of the disc traced by Lee et al. (2017a) using ALMA Band 7 continuum observations (grey scale). C17O(3–2) emission (a tracer of the HH 212 disc at these velocities; see also Codella et al. 2014) has also been observed in our Cycle 4 dataset (Tabone et al. 2017). The first contours and steps correspond to 3σ (60 mJy beam−1 km s−1 for HDO and CH3CHO, and 73 mJy beam−1 km s−1 for C17O) and 5σ, respectively. |
| In the text | |
|
Fig. 6 Distribution of the HDO(33,1–42,2) (upper panel), and CH3CHO(180,18–170,17) E&A (middle and lower panels) centroid positions (from fits in the uv domain with1σ error bars) in the velocity channels (sampled at the original spectral resolution of 0.42 km s−1). Magenta points show the emission in the channel sampling the systemic velocity, and red and blue datapoints denote the channels that are red- and blue-shifted in the velocity range (with respect to vsys), as identified by the labels. The points are overlaid on the disc traced by Lee et al. (2017a) using ALMA Band 7 continuum observations (colour scale and contours). |
| In the text | |
|
Fig. 7 Position–velocity cut of HDO(33,1–42,2) (colour scale, magenta contours) along (left panels) and perpendicular (right panels) to the equatorial plane (PA = 112°; see Fig. 1) overlaid with the CH3CHO(180,18–170,17)-E (upper panels) and CH3CHO(180,18–170,17)-A (lower panels), drawn as white contours. The first contours and steps correspond to 3σ (3.1 K km s−1). Dashed lines mark the position of the HH 212 mm protostar and the cloud VLSR (+1.7 km s−1; Lee et al. 2014). The error bars are drawn in the bottom right corners. |
| In the text | |
|
Fig. 8 Cartoon (not to scale) illustrating the scenario expected in the inner 60 au region around the protostar for low-velocity emission (≤1 km s−1 with respect to vsys) in case of outflowing (left panel) or infalling (right panel) chemically enriched gas (see text). |
| In the text | |
Current usage metrics show cumulative count of Article Views (full-text article views including HTML views, PDF and ePub downloads, according to the available data) and Abstracts Views on Vision4Press platform.
Data correspond to usage on the plateform after 2015. The current usage metrics is available 48-96 hours after online publication and is updated daily on week days.
Initial download of the metrics may take a while.