Fig. 6
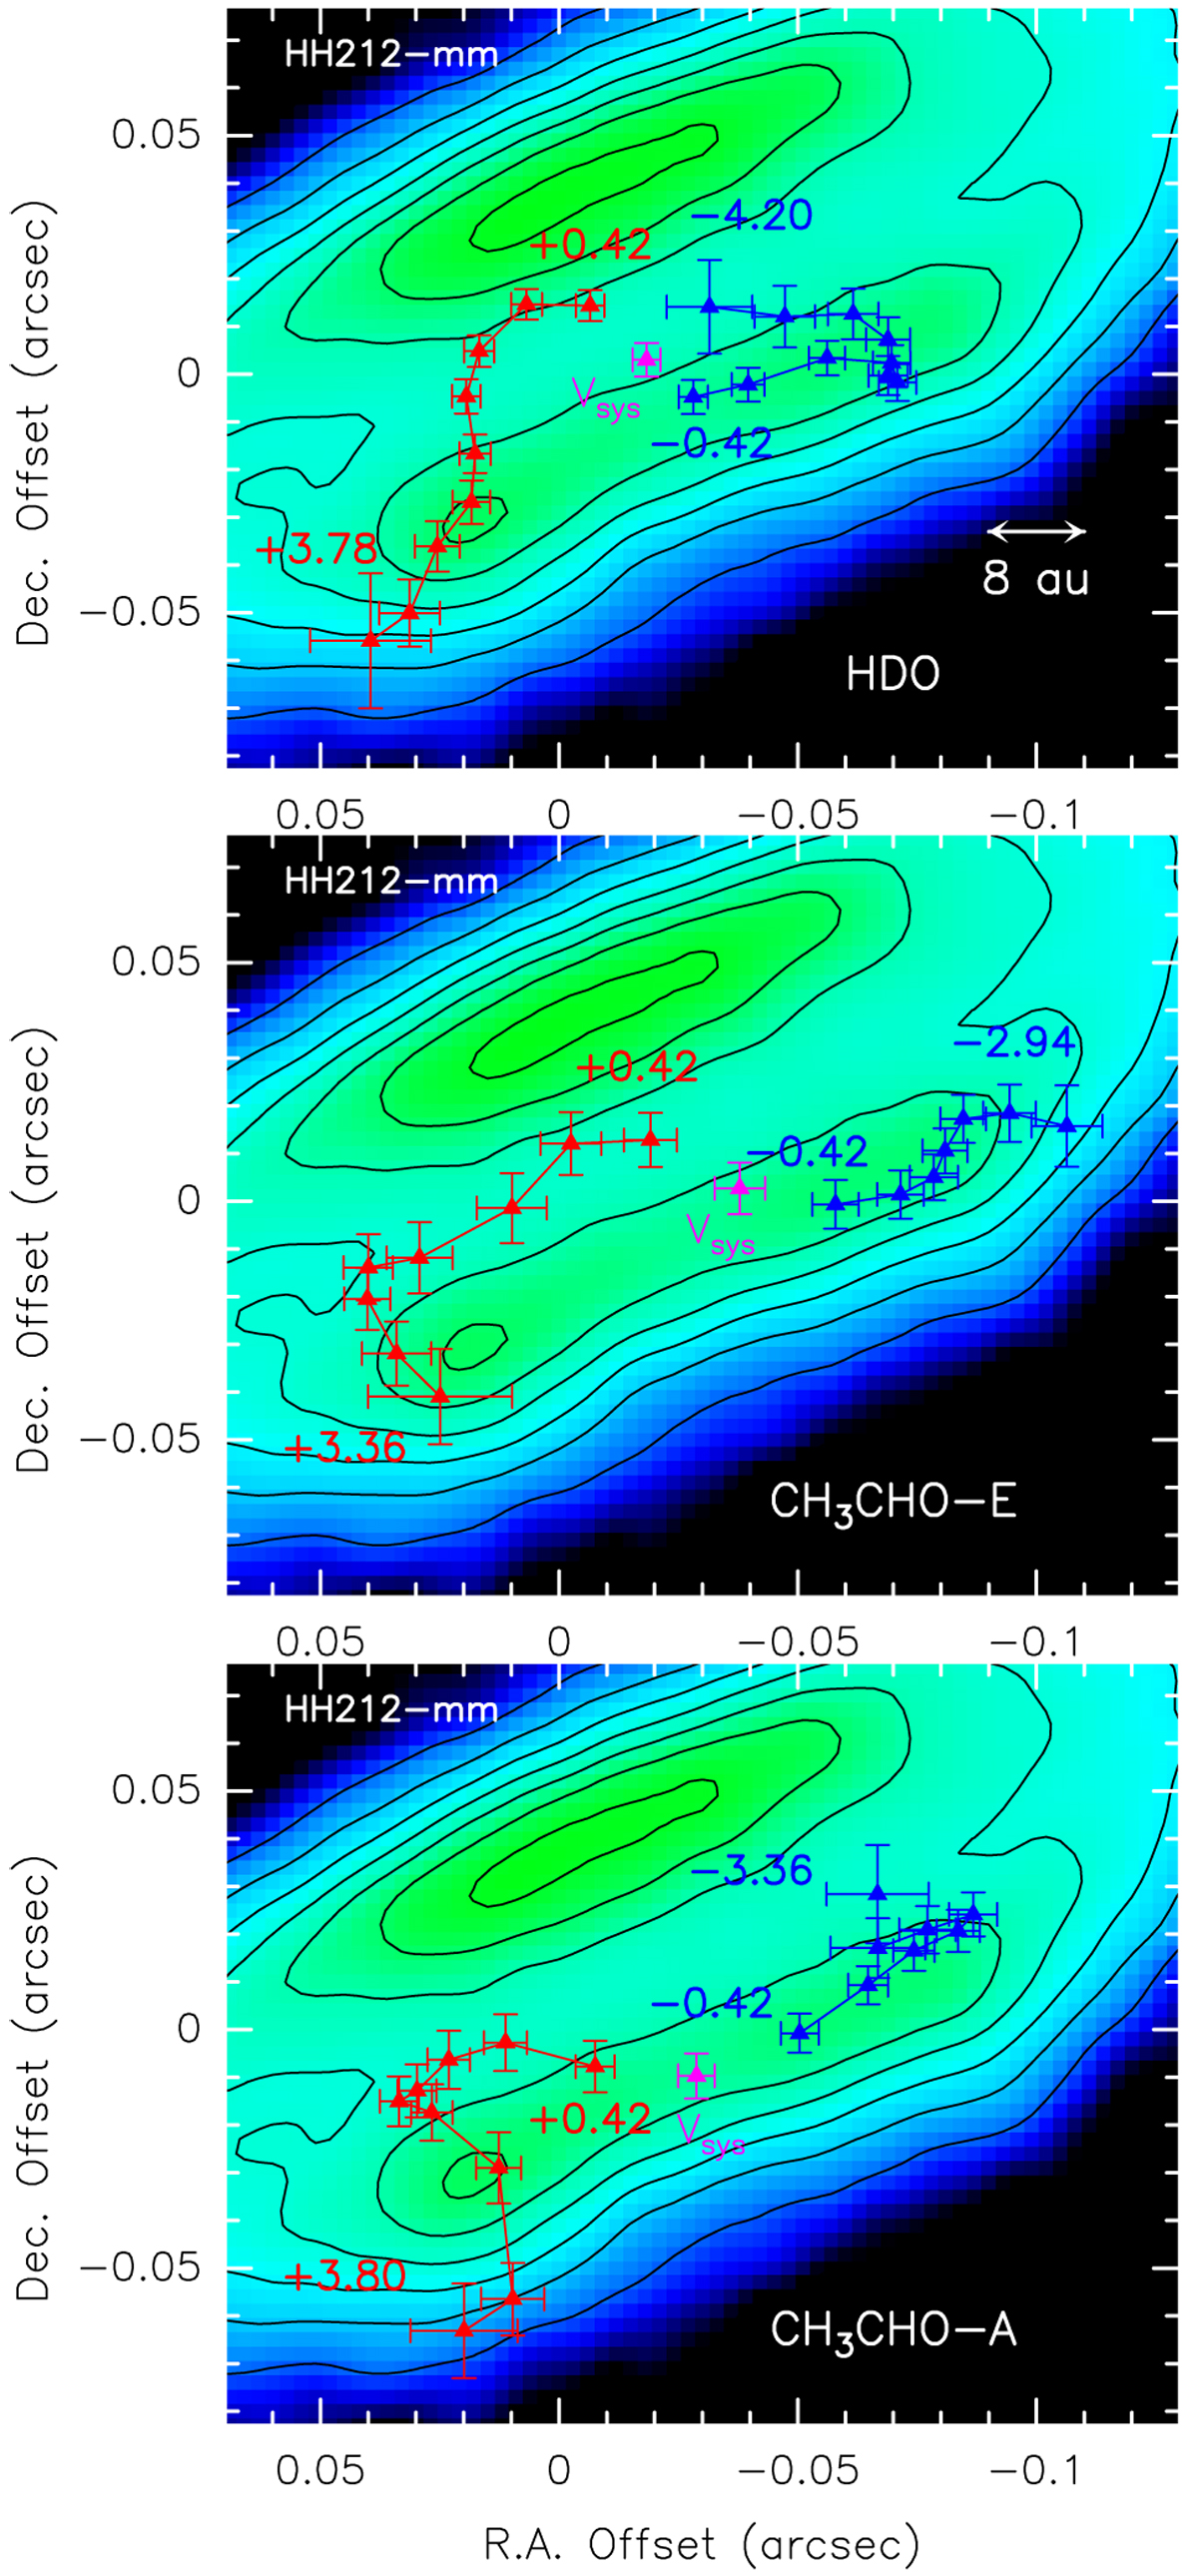
Distribution of the HDO(33,1–42,2) (upper panel), and CH3CHO(180,18–170,17) E&A (middle and lower panels) centroid positions (from fits in the uv domain with1σ error bars) in the velocity channels (sampled at the original spectral resolution of 0.42 km s−1). Magenta points show the emission in the channel sampling the systemic velocity, and red and blue datapoints denote the channels that are red- and blue-shifted in the velocity range (with respect to vsys), as identified by the labels. The points are overlaid on the disc traced by Lee et al. (2017a) using ALMA Band 7 continuum observations (colour scale and contours).
Current usage metrics show cumulative count of Article Views (full-text article views including HTML views, PDF and ePub downloads, according to the available data) and Abstracts Views on Vision4Press platform.
Data correspond to usage on the plateform after 2015. The current usage metrics is available 48-96 hours after online publication and is updated daily on week days.
Initial download of the metrics may take a while.