Fig. 3
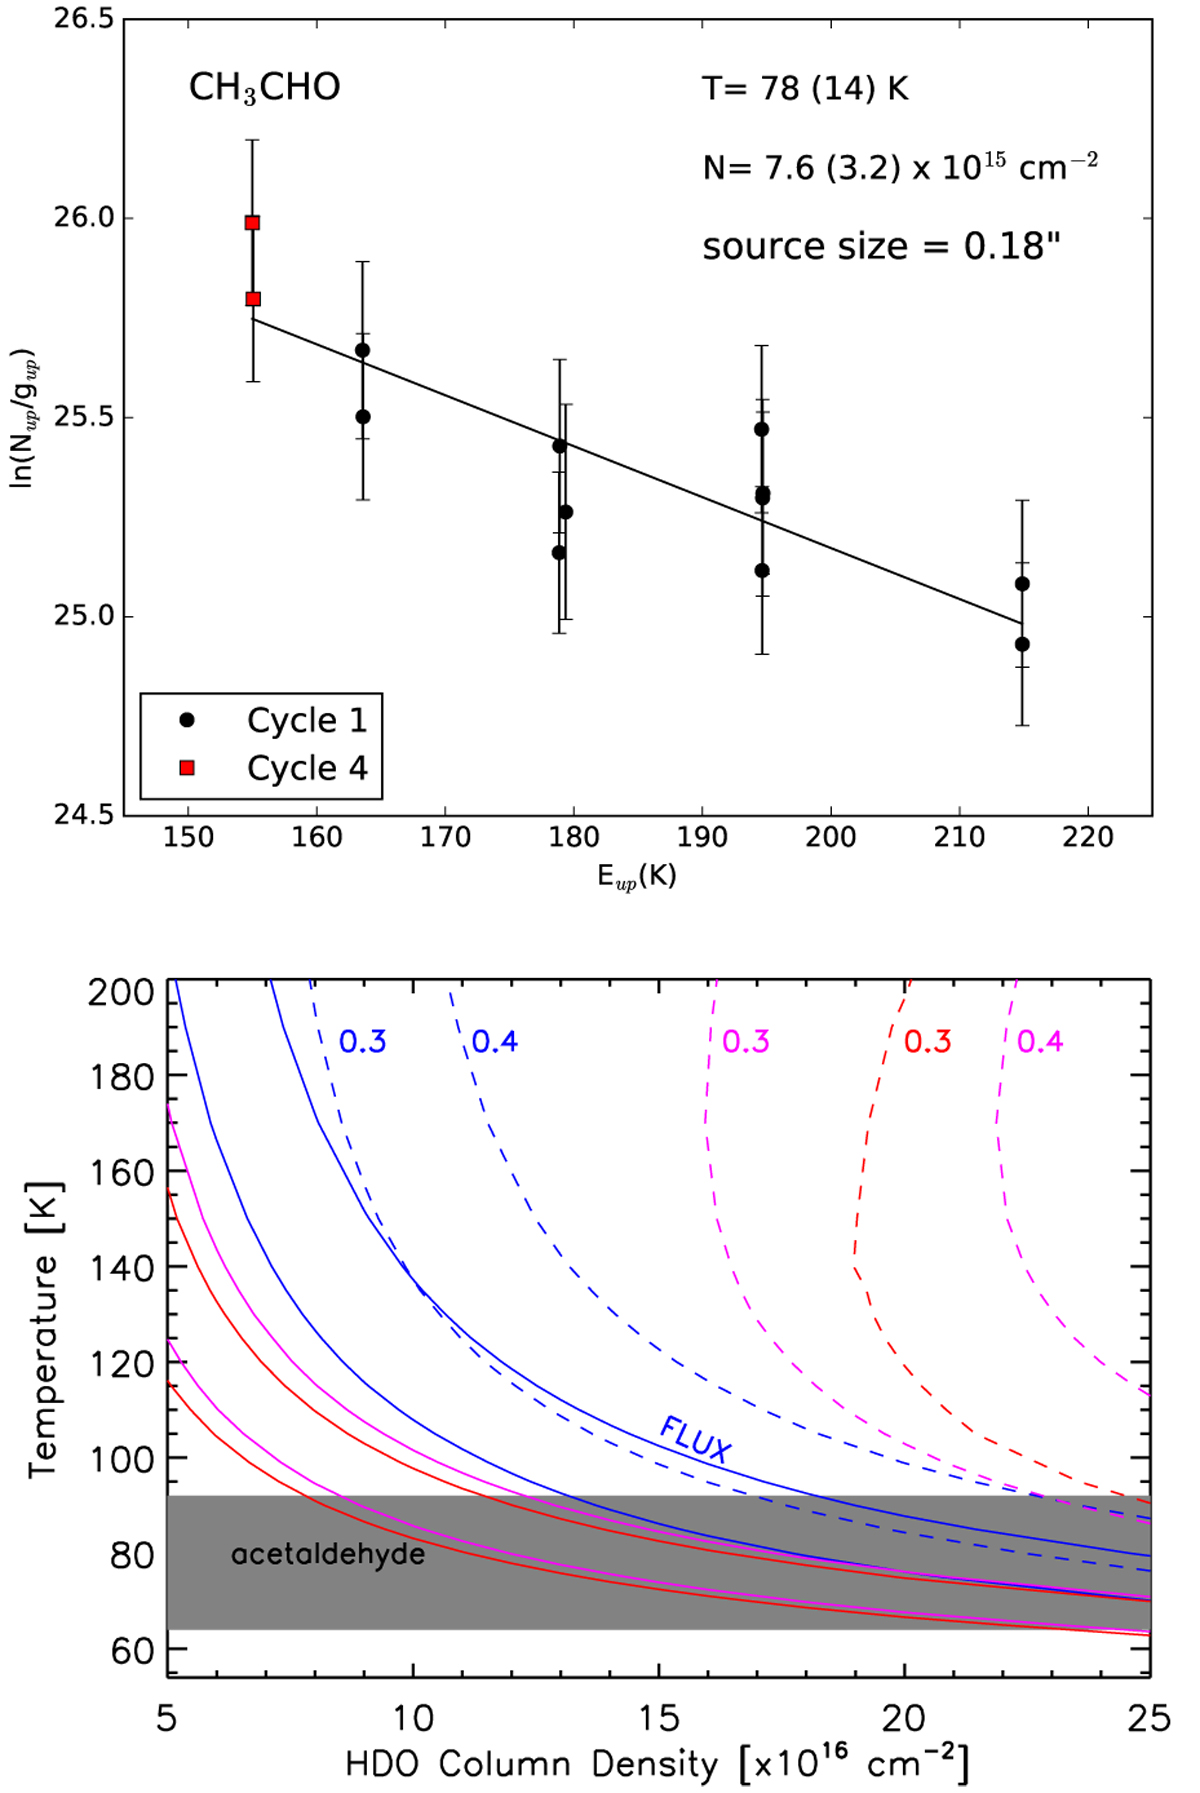
Upper panel: rotation diagrams for CH3CHO, derived using Cycle 1 (black points) and Cycle 4 (red) data. A total emitting region size of 0.′′18 is assumed (see text). The parameters Nu, gu, and Eup are the column density, degeneracy, and energy of the upper level, respectively. The derived values of the rotational temperature and total column density are reported. Lower panel: LVG predictions of the temperature vs. HDO column density required to reproduce the observed velocity-integrated emission (the portion of the plot delimited by solid curves; see Table 1) densities of 108 cm−3 (blue), 109 cm−3 (magenta), and 1010 cm−3 (red). Dashed lines are for the optical depth (τ = 0.3 and 0.4), increasing with column density. A source size of 0.′′18 is assumed. The grey zone shows the temperature derived from CH3CHO (see upper panel).
Current usage metrics show cumulative count of Article Views (full-text article views including HTML views, PDF and ePub downloads, according to the available data) and Abstracts Views on Vision4Press platform.
Data correspond to usage on the plateform after 2015. The current usage metrics is available 48-96 hours after online publication and is updated daily on week days.
Initial download of the metrics may take a while.