Fig. 5
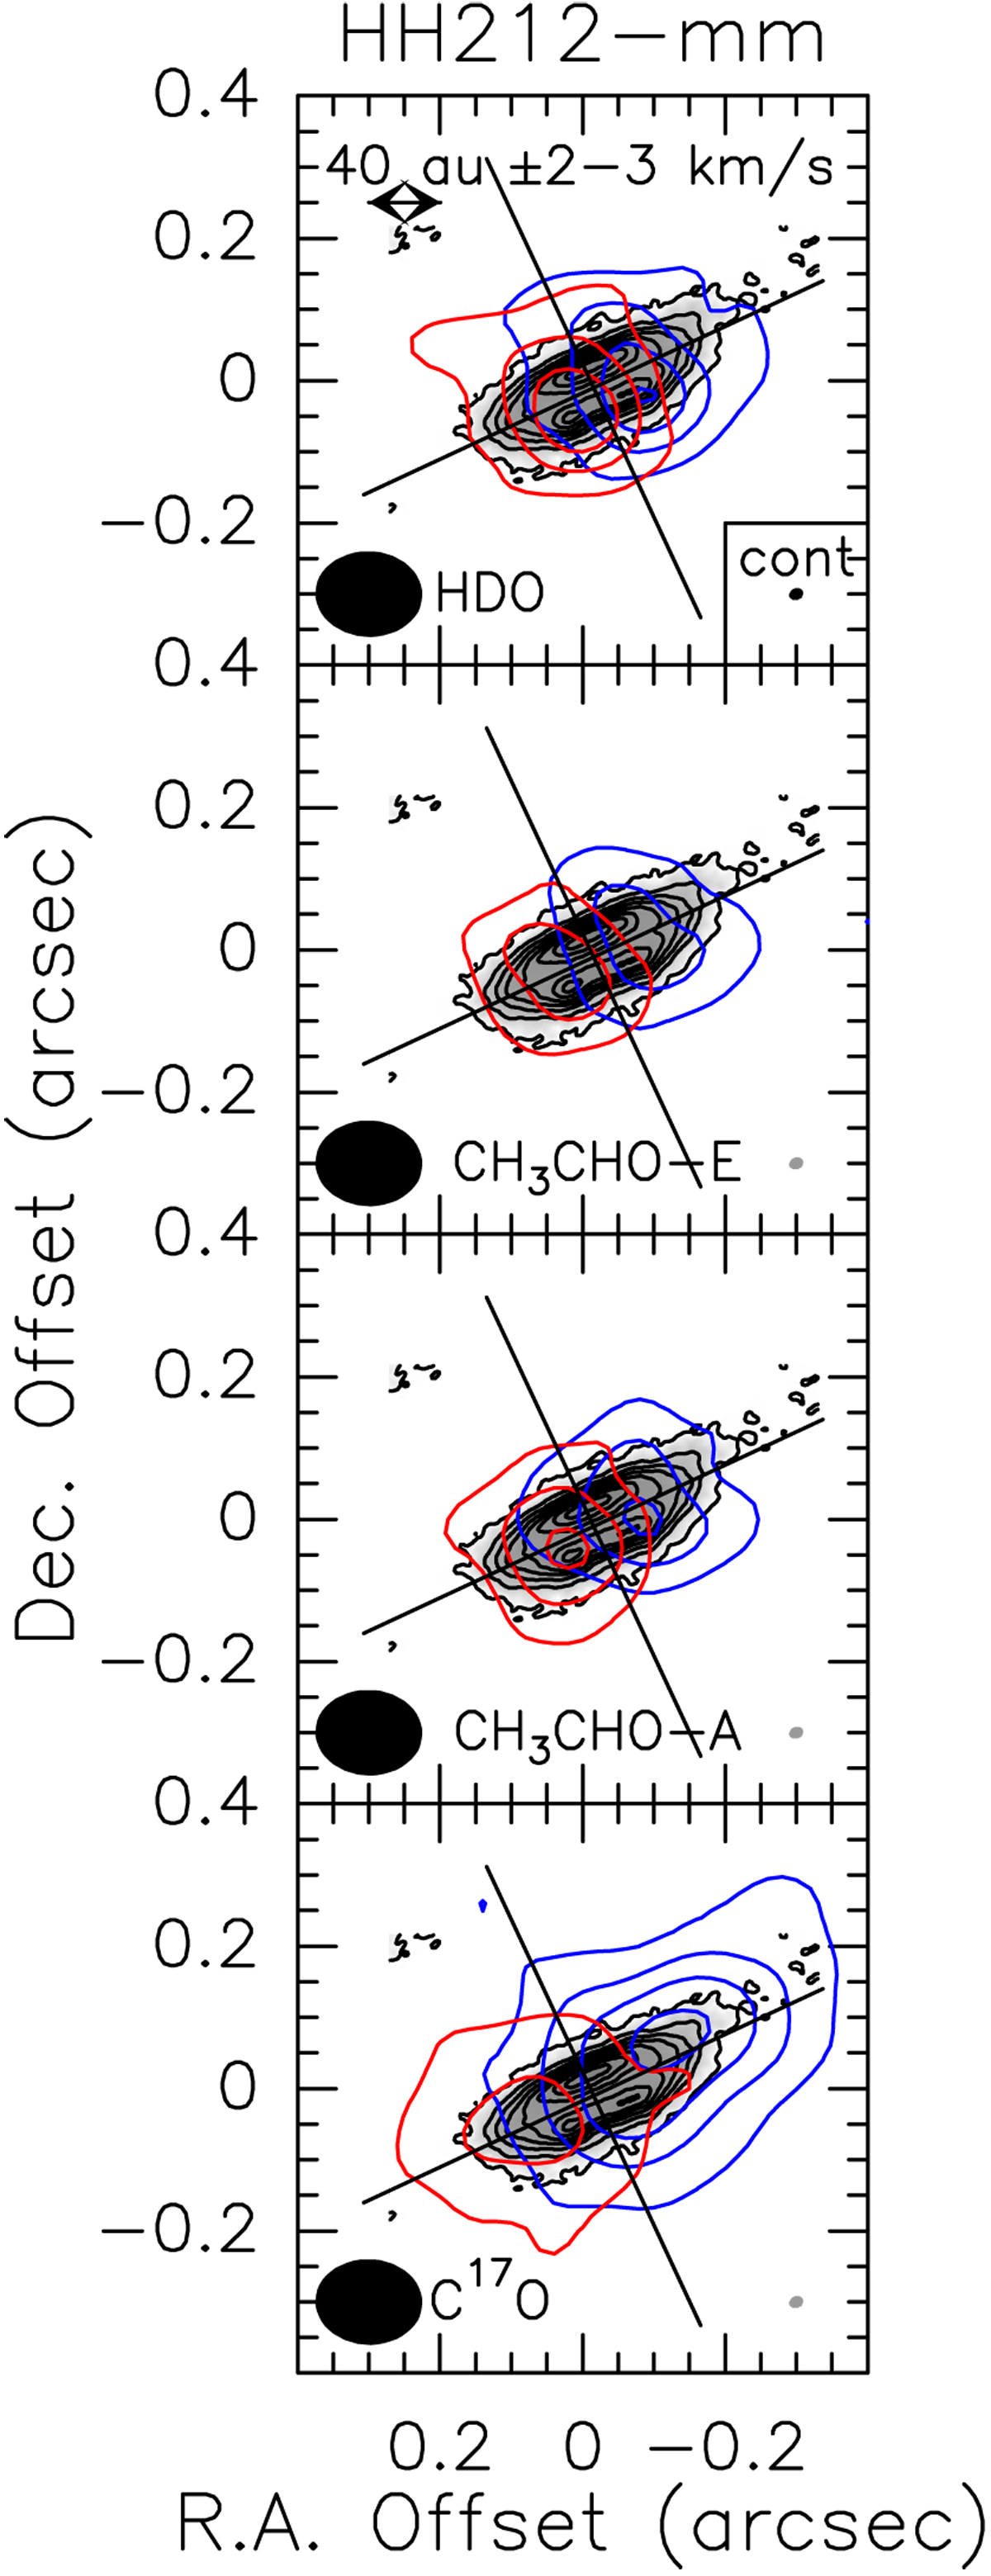
HDO(33,1–42,2) (upper), CH3CHO(180,18–170,17) E&A (middle), and C17O(3–2) (lower) channel maps emitting vsys ± 2–3 km s−1 (blue and red) overlaid on top of the disc traced by Lee et al. (2017a) using ALMA Band 7 continuum observations (grey scale). C17O(3–2) emission (a tracer of the HH 212 disc at these velocities; see also Codella et al. 2014) has also been observed in our Cycle 4 dataset (Tabone et al. 2017). The first contours and steps correspond to 3σ (60 mJy beam−1 km s−1 for HDO and CH3CHO, and 73 mJy beam−1 km s−1 for C17O) and 5σ, respectively.
Current usage metrics show cumulative count of Article Views (full-text article views including HTML views, PDF and ePub downloads, according to the available data) and Abstracts Views on Vision4Press platform.
Data correspond to usage on the plateform after 2015. The current usage metrics is available 48-96 hours after online publication and is updated daily on week days.
Initial download of the metrics may take a while.