Fig. 1
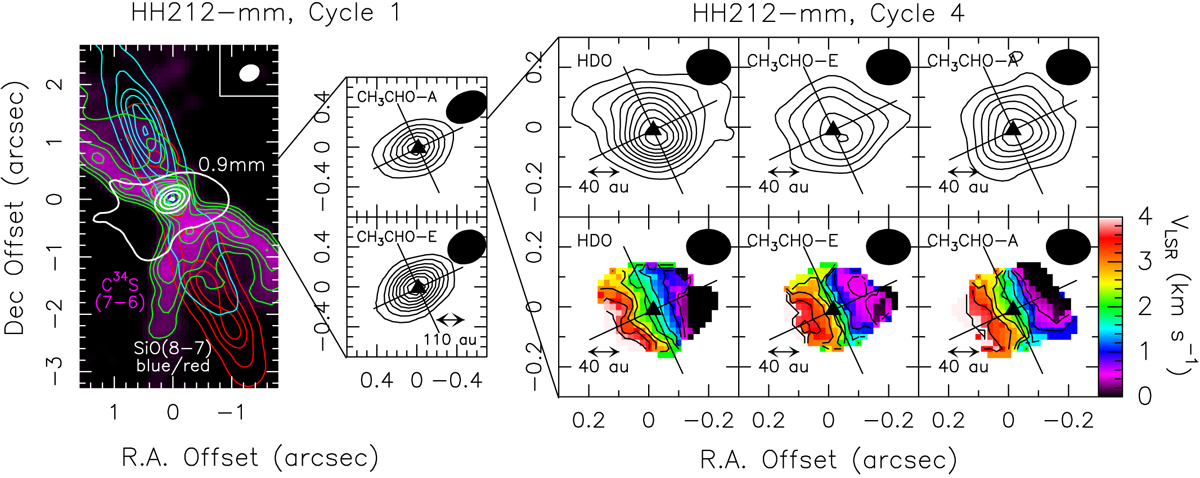
Left panel: HH 212 protostellar system as observed by ALMA-Band 7 during Cycle 1. Blue and red contours plot the blue- and red-shifted SiO(8–7) jet and the C34S(7–6) asymmetric cavity (magenta and green contours) overlaid on the continuum at 0.9 mm (white contours). Positions are given with respect to the coordinates of the MM1 protostar, reported in Sect. 2. The filled ellipse shows the synthesised beam (HPBW) for the continuum: 0.′′36 × 0.′′28 (–62°). The beam for the SiO and C34S images is 0.′′43 × 0.′′33 (–64°). First contours and steps for the continuum are 5σ (1.5 mJy beam−1) and 60σ, respectively. For SiO, the first contours and steps are 5σ and 25σ, respectively: the blue map has been obtained by integrating down to –21 km s−1 (1σ = 29 mJy beam−1 km s−1), and the red map collects emission up to +12 km s−1 (1σ = 23 mJy beam−1 km s−1). The C34 S map has been obtained by integrating the velocities from −1 to +1 km s−1 with respect to the systemic velocity vsys = +1.7 km s−1 (Lee et al. 2014): the first contour and steps are 5σ (10 mJy beam−1 km s−1) and 3σ, respectively. Central panels: zoom-in of the central region as observed by ALMA Band 7 Cycle 1: CH3CHO(181,17–171,16)E and CH3CHO(184,15–174,14)A emission integrated over ±5 km s−1 with respect to vsys (black contours). The first contours and steps are 3σ (18 mJy beam−1 km s−1). The HPBWs are 0.′′41 × 0.′′33 (–64°) for CH3CHO(181,17–171,16) E and of the equatorial plane, and 0.′′44 × 0.′′33 (–63°) for CH3CHO(184,15–174,14)A. The black triangle shows the MM1 coordinates, and the tilted cross indicates the directions of the jet and of the equatorial plane. Right panels: further zoom-in of the central region, as observed by ALMA Band 7 Cycle 4, showing the HDO(33,1–42,2), CH3CHO(180,18–170,17)E, and CH3CHO(180,18–170,17)A. The emission was integrated over 10 km s−1 around vsys (upper panels; black contours). The first contours and steps are 3σ (14 mJy beam−1 km s−1). The HPBW is 0.′′15 × 0.′′12 (PA = − 88°). The corresponding first-moment maps are reported in colour scale in the lower panels. Contours are from 0 to +4 km s−1 in steps of 0.5 km s−1.
Current usage metrics show cumulative count of Article Views (full-text article views including HTML views, PDF and ePub downloads, according to the available data) and Abstracts Views on Vision4Press platform.
Data correspond to usage on the plateform after 2015. The current usage metrics is available 48-96 hours after online publication and is updated daily on week days.
Initial download of the metrics may take a while.