Fig. 2
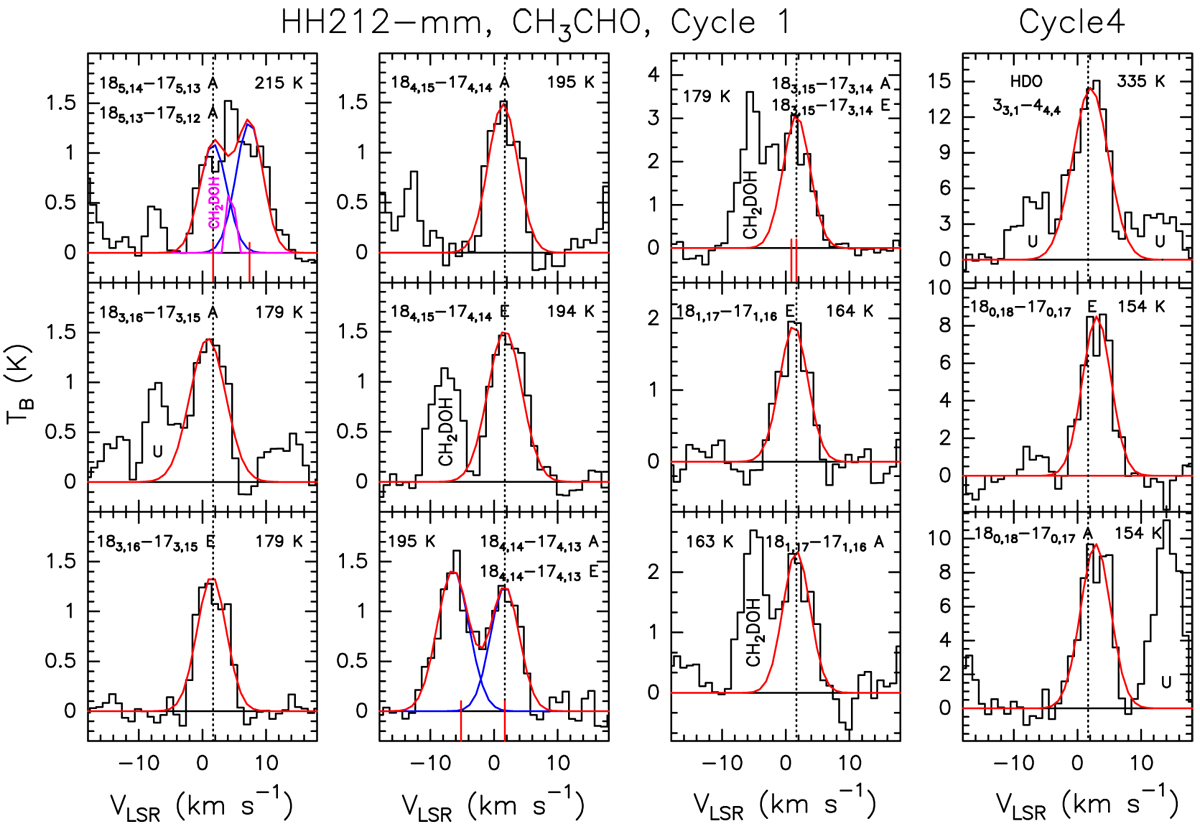
CH3CHO and HDO line profiles in Tb scale (with a spectral resolution of 1 km s−1) observed during ALMA Cycle 1 and 4 (right panels) operations. Species, transitions, and upper level excitations (Eu in K) are reported (see Table 1). The vertical dashed line stands for the systemic velocity vsys = +1.7 km s−1 (e.g. Lee et al. 2014). Red curves are Gaussian fits, the results of which are reported in Table 1. In some of the panels, vertical red segments indicate an additional CH3CHO line close to that centred at vsys. The CH2DOH labels (see also the magenta profile in the upper left panel, residual of the (185,14 –175,13)A and (185,13–175,12)A fit) are for emission lines of deuterated methanol, published by Bianchi et al. (2017). Some unidentified lines (U labels) are also reported.
Current usage metrics show cumulative count of Article Views (full-text article views including HTML views, PDF and ePub downloads, according to the available data) and Abstracts Views on Vision4Press platform.
Data correspond to usage on the plateform after 2015. The current usage metrics is available 48-96 hours after online publication and is updated daily on week days.
Initial download of the metrics may take a while.