| Issue |
A&A
Volume 616, August 2018
|
|
|---|---|---|
| Article Number | A169 | |
| Number of page(s) | 15 | |
| Section | Extragalactic astronomy | |
| DOI | https://doi.org/10.1051/0004-6361/201629942 | |
| Published online | 11 September 2018 | |
The second-closest gamma-ray burst: sub-luminous GRB 111005A with no supernova in a super-solar metallicity environment
1
Astronomical Observatory Institute, Faculty of Physics, Adam Mickiewicz University, ul. Słoneczna 36, 60-286 Poznań, Poland
e-mail: This email address is being protected from spambots. You need JavaScript enabled to view it.
2
Scottish Universities Physics Alliance (SUPA), Institute for Astronomy, University of Edinburgh, Royal Observatory, Blackford Hill, Edinburgh EH9 3HJ, UK
3
Dark Cosmology Centre, Niels Bohr Institute, University of Copenhagen, Juliane Maries Vej 30, 2100 Copenhagen Ø, Denmark
4
National Astronomical Observatories, Chinese Academy of Sciences, Beijing 100012, PR China
5
CSIRO Astronomy and Space Science, Locked Bag 194, Narrabri, NSW 2390, Australia
6
Department of Physics, University of Warwick, Coventry CV4 7AL, UK
7
Department of Earth and Space Sciences, Chalmers University of Technology, Onsala Space Observatory, 43992 Onsala, Sweden
8
Joint Institute for VLBI ERIC, Postbus 2, 7990 AA Dwingeloo, The Netherlands
9
Harvard-Smithsonian Center for Astrophysics, 60 Garden St., Cambridge, MA 02138, USA
10
Instituto de Astrofísica de Canarias (IAC), 38205 La Laguna, Tenerife, Spain
11
Universidad de La Laguna, Dpto. Astrofísica, 38206 La Laguna, Tenerife, Spain
12
Universität Wien, Institut für Astrophysik, Türkenstraße 17, 1180 Wien, Austria
13
Department of Physics, The George Washington University, 725 21st Street NW, Washington, DC 20052, USA
14
Department of Space Sciences and Astronomy, Hebei Normal University, Shijiazhuang 050024, PR China
15
Key Laboratory of Dark Matter and Space Astronomy, Purple Mountain Observatory, Chinese Academy of Sciences, Nanjing 210008, PR China
16
Sterrenkundig Observatorium, Universiteit Gent, Krijgslaan 281-S9, 9000 Gent, Belgium
17
Department of Physics and Astrophysics, Vrije Universiteit Brussel, Pleinlaan 2, 1050 Brussels, Belgium
18
Department of Physics and Astronomy, University of Leicester, Leicester LE1 7RH, UK
19
Astronomisches Institut, Ruhr-Universität Bochum, Universitätsstrasse 150, 44801 Bochum, Germany
20
Jodrell Bank Centre for Astrophysics, School of Physics & Astronomy, The University of Manchester, Alan Turing Building, Oxford Road, Manchester M13 9PL, UK
21
Leiden Observatory, University of Leiden, PO Box 9513, 2300 RA Leiden, The Netherlands
Received:
21
October
2016
Accepted:
26
May
2018
Abstract
We report the detection of the radio afterglow of a long gamma-ray burst (GRB) 111005A at 5-345 GHz, including very long baseline interferometry observations with a positional error of 0.2 mas. The afterglow position is coincident with the disc of a galaxy ESO 58049 at z = 0.01326 (∼1″ from its centre), which makes GRB 111005A the second-closest GRB known to date, after GRB 980425. The radio afterglow of GRB 111005A was an order of magnitude less luminous than those of local low-luminosity GRBs, and obviously less luminous than those of cosmological GRBs. The radio flux was approximately constant and then experienced an unusually rapid decay a month after the GRB explosion. Similarly to only two other GRBs, we did not find the associated supernovae (SNe), despite deep near- and mid-infrared observations 1-9 days after the GRB explosion, reaching ∼20 times fainter than other SNe associated with GRBs. Moreover, we measured a twice-solar metallicity for the GRB location. The low y-ray and radio luminosities, rapid decay, lack of a SN, and super-solar metallicity suggest that GRB 111005A represents a rare class of GRB that is different from typical core-collapse events. We modelled the spectral energy distribution of the GRB 111005A host finding that it is a moderately star-forming dwarf galaxy, similar to the host of GRB 980425. The existence of two local GRBs in such galaxies is still consistent with the hypothesis that the GRB rate is proportional to the cosmic star formation rate (SFR) density, but suggests that the GRB rate is biased towards low SFRs. Using the far-infrared detection of ESO 580-49, we conclude that the hosts of both GRBs 111005A and 980425 exhibit lower dust content than what would be expected from their stellar masses and optical colors.
Key words: dust, extinction / galaxies: abundances / galaxies: individual: ESO 580-49 / galaxies: star formation / gamma-ray burst: general / gamma-ray burst: individual: 111005A
© ESO 2018
1. Introduction
Long (duration >2 s) gamma ray-burst (GRBs) have been shown to be collapses of very massive stars (e.g. Hjorth et al. 2003; Stanek et al. 2003; see a review in Hjorth & Bloom 2012), and because of very short main-sequence lifetimes of such stars, GRBs are expected to trace galaxies with on-going star-formation (but see Rossi et al. 2014). This could potentially be used as a tool to study cosmic star formation rate (SFR) density, but requires prior understanding of GRBs and their host galaxies. Most GRBs reside at z 2–3 (Jakobsson et al. 2006, 2012; Fynbo et al. 2009; Greiner et al. 2011; Hjorth et al. 2012; Krühler et al. 2012b; Salvaterra et al. 2012; Perley et al. 2016a) and there are only a few examples of low-z GRBs. Therefore, the GRB rate and properties at low-z are very poorly constrained.
Low-z GRBs and their hosts provide an opportunity to study their properties at a level of detail that is inaccessible for more distant specimens. For example, the local environments of GRBs, characterised with high-resolution observations, provide constraints on the age, mass, and the explosion mechanism of the GRB progenitor (Castro Cerón et al. 2006; Östlin et al. 2008; Leloudas et al. 2011; Levan et al. 2014; Arabsalmani et al. 2015; Greiner et al. 2016). Moreover, low-z GRBs are promising candidates for the detection of non-electromagnetic signals such as gravitational waves and neutrinos.
Similarly, the radio/submillimetre(submm) observations of afterglows of low-z GRBs (see Weiler et al. 2002 for a review and de Ugarte Postigo et al. 2012 for a compilation) allow for measurements of the physical conditions of the explosion and the surrounding circumburst medium (Soderberg et al. 2004; Frail et al. 2005; Taylor et al. 2005; van der Horst et al. 2005, 2008, 2014; Margutti et al. 2013), and even of the size of the expanding ejecta, if very long baseline interferometry (VLBI) observations are available (Taylor et al. 2004; Pihlström et al. 2007).
When it comes to the host galaxies, only thirteen of them have been detected in the far-infrared (FIR) (but see Perley et al. 2017a): those of GRB 980425 (Le Floc’h et al. 2012; Michałowski et al. 2014b), 980613, 020819B, 051022, 070306, 080207, 080325, 090417B (Hunt et al. 2014; Hatsukade et al. 2014; Schady et al. 2014), 010222 (Frail et al. 2002), 000210, 000418 (Berger et al. 2003; Tanvir et al. 2004), 031203 (Watson et al. 2011; Symeonidis et al. 2014), and 080607 (Wang et al. 2012). Therefore, we still do not posses a significant sample of GRB hosts whose dust emission can be studied, and this is where low-z GRBs can be useful.
GRB 111005A triggered the Burst Alert Telescope (BAT; Barthelmy et al. 2005) onboard the Swift satellite (Gehrels et al. 2004) at 08:05:14 UT on 2011 Oct 5. The burst was localised at 14:53:08, 19:43:48 with a 90% error circle of 3′ (Saxton et al. 2011), further revised to 2.1′ (Barthelmy et al. 2011). The duration of 26 7 s (Barthelmy et al. 2011) classifies GRB 111005A in the long GRB category (Kouveliotou et al. 1993). Barthelmy et al. (2011) reported the burst’s power law spectral index of 2.03 0.27, the fluence in the 15–150 keV band of (6.2 1.1) 10 7 erg cm2 and the peak photon flux in this band of 1.1 0.3 ph cm−2 s−1. At the time of the burst, the Sun was close to its position, so no X-ray or optical observations in the early stages were possible. Near-infrared (NIR) images taken during twilight and close to the horizon did not reveal any variable source (Levan et al. 2011b; Nardini et al. 2011; Malesani et al. 2011; Motohara et al. 2011). The potential association of GRB 111005A to a galaxy ESO 580-49 at z = 0.01326 was suggested by Levan et al. (2011d), whereas Zauderer et al. (2011) detected a radio source coincident with this galaxy (EVLA-S1 at 14:53:07.78, 19:44:12.2). The association of the GRB and this local galaxy is confirmed by our multi-facility campaign presented in this paper and reported initially in Xu et al. (2011b,a) and Michałowski et al. (2011).
The objectives of these papers are: (i) to report the discovery and the confirmation of the low redshift of GRB 111005A, (ii) determine the nature of this GRB, and (iii) to study its host galaxy in the context of other GRB hosts and of local star-forming galaxies.
We use a cosmological model with H0 = 70 km s−1 Mpc−1, ΩΛ = 0.7, and Ωm = 0.3, meaning that GRB 111005A at z = 0.01326 is at a luminosity distance of 57.4 Mpc and 1″ corresponds to 271 pc at its redshift. We also assume the Chabrier (2003) initial mass function (IMF), to which all SFR and stellar masses were converted (by dividing by 1.8) if given originally assuming the Salpeter (1955) IMF.
2. Data
2.1. Radio
We have obtained the data with the Australia Telescope Compact Array (ATCA) using the Compact Array Broad-band Back-end (CABB; Wilson et al. 2011) at 2–2000 days after the GRB event, that is, during the period from 2011 Oct 7 to 2016 Sep 07, detecting the afterglow up to a month after the event. The array was in various configurations during this period (see Table 1). The data reduction and analysis were done using the MIRAID package (Sault & Killeen 2004; Sault et al. 1995). We have added the data obtained two years after the burst presented in Michałowski et al. (2015).
Results of the afterglow observations of GRB 111005A.
We also observed GRB 111005A at 5 GHz with the European VLBI Network (EVN) during the 2011 Oct 17–18 realtime e-VLBI run in two parts, in the intervals 11:23–13:17 UT on 17 Oct and 13:08–15:08 UT on 18 Oct. The participating telescopes were Effelsberg (Germany), Jodrell Bank Mk2 (United Kingdom), Medicina (Italy), Onsala (Sweden), Toruń (Poland), Yebes (Spain) and the phased-array Westerbork Synthesis Radio Telescope (WSRT, Netherlands). The field was centred at the position α = 14:53:07.78, δ = 19:44:12.2 (Zauderer et al. 2011). The target was phase-referenced to the compact VLBI calibrator J1459-1810 at an angular distance of 2.2 degrees. Two candidate secondary calibrators/check sources were selected from the Karl G. Jansky Very Large Array (VLA) NVSS survey (Condon et al. 1998) 1, NVSS J145203.58-19438.00 (hereafter VLA1) and NVSS J145024.98-190915.2 (VLA2) at a distance of 15 and 51 arcmin, respectively. The phase-referencing cycle was 1m – 1.5m – 1.5m on J1459-1810, GRB 111005A and VLA1, respectively, with every second cycle including VLA2 for 1.5 min. The second epoch was observed (also at 5 GHz) on 2011 Nov 24 in the interval 8:25–12:35 UT with the same array with the addition of Hartbeesthoek (South Africa). Since the angular distance between our field and the Sun has decreased to slightly below 15 degrees, we decided to use much closer VLA1 (detected during the first epoch) as phase-reference source; we observed VLA1 for 1m20s and the target for 2m30s per cycle.
The data were analysed with the NRAO Astronomical Image Processing System2 (AIPS; van Moorsel et al. 1996) using standard procedures as described in the EVN Data Analysis Guide3 and the maps were made in DIFMAP (Shepherd et al. 1994). GRB 111005A was not detected at any of the epochs. On 2011 Oct 17–18, we achieved a relatively high image noise of 100 μJy beam−1 due to various failures during the experiment, therefore we can give a 5σ upper limit of 500 μJy. On 2011 Nov 24, we achieved an image noise of 35 μJy beam−1 and the 5σ upper limit is 175 μJy. We note however that the combination of small Sun-distance and low declination of the target might have resulted in significant correlation losses at this epoch.
We also observed GRB 111005A at 15.3 GHz by the Very Long Baseline Array (VLBA) on 2011 Oct 21. The experiment lasted six hours and used a recording data rate of 512 Mbps (8 BBCs, dual sideband, 16 MHz filter, and 1-bit quantisation). To further remove the residual tropospheric delay after the traditional phase-referencing calibration, two short (30 min) geodetic observations were scheduled at the beginning and end of the observations (Mioduszewski & Kogan 2009). The source J1459 1810 was again observed as the main reference source. The cycle time was about 90 s (30 s on the calibrator, 50 s on the GRB 111005A or VLA1, ∼10 s on slewing telescopes). The nearby source VLA1 was also observed as a phase-referencing checker. The total on-source time was 122 min on GRB 111005A and 18 min on VLA1. The bright calibrator 1329-049 was observed as a fringe finder for a scan of 4 min.
The data were correlated by the software correlator DiFX (Deller et al. 2011) with a frequency resolution 125 kHz (128 frequency points per subband) and an integration time of 1 s. Following the steps suggested by Mioduszewski & Kogan (2009), we solved and applied the tropospheric delay. The rest of the steps are the same as for the EVN data reduction. The target was clearly detected in the image after all the calibration solutions were transferred from the calibrator to the targets.
We also obtained the radio observations with the WSRT. Additionally, we analysed the WSRT data alone taken during our EVN run. Data reduction and analysis were done using the AIPS package. Only the early WSRT observations during the EVN run resulted in a detection.
2.2. (Sub)millimetre
We observed GRB 111005A with the Plateau de Bure Interferometer (PdBI) in the compact “D” configuration on 2011 Dec 26 with the full array of six antennae in dual polarisation mode, and under excellent atmospheric weather conditions. The total observing time was 1.4 h. The receivers were tuned to 94.5 GHz and the spectral bandwidth of the WideX correlator was 3.6 GHz. The flux calibration was done on MWC349 with a flux accuracy of 5% and the data were reduced with the GILDAS software package CLIC and MAP. The FWHM of the beam is 12ʺ̣2 × 4ʺ̣6 at PA = 156.7 deg. The source was not detected.
We also performed submm (870 μm) observations on 2011 Oct 10, that is, five days after the burst using the Large Apex BOlometer CAmera (LABOCA; Siringo et al. 2009) mounted at the Atacama Pathfinder Experiment (APEX; Güsten et al. 2006). A total of 0.9 h of on-source data were obtained in the on- off photometric mode. The weather was extremely poor with 2–3 mm of precipitable water vapour, resulting in elevated noise and a non-detection.
2.3. Optical and mid-IR
2.3.1. Imaging
Despite a location close to the Sun, we obtained early multi-wavelength imaging observations of GRB 111005A using the VLT, with additional later observations from the William Herschel Telescope (WHT). A full log of observations is shown in Table 2. Early observations were obtained with the X-shooter acquisition camera and the HAWK-I instrument at the VLT, taking place approximately 15 h after the burst. Comparison observations for HAWK-I were obtained the following night (39 h after burst), but further optical imaging was not obtained until 2012 May 21 with the WHT, and 2013 Apr 01, again with the X-shooter acquisition camera.
The orbit of the Spitzer Space Telescope is such that it suffers from different periods of sun-block compared with ground-based or low-Earth orbiting satellites. Because of this, Spitzer was able to obtain observations on 2011 Oct 14, nine days after the burst, with a second comparison epoch obtained at 2012 Apr 14. The first epoch was close to the expected time of the optical peak of any SNe associated with the burst, although an earlier peak is expected at longer wavelengths.
Digital image subtraction images with the ISIS-II code of Alard & Lupton (1998) reveals no residuals in any of our images. Limiting magnitudes were estimated based on placing artificial sources within the images (in particular at the VLBA location) and then measuring the residual flux in the subtracted images. The location of the GRB is within the disc of the galaxy, although somewhat away from the nucleus and regions of highest surface brightness (see Fig. 1), such that the photon noise from the galaxy has a smaller impact on the limiting magnitudes than might otherwise be the case, although this contribution is larger in the Spitzer observations which have a rather poor PSF. In several cases, subtractions offer limited potential. In the K-band there is only a short baseline (1 day) between each epoch of observations. While this is likely very sensitive for GRB afterglows (it is a factor of 2.5 in time), it is less so for any SNe, which may only vary by a few hundredths to a few tenths of a magnitude in this time frame in the K-band (although the early light curves of SNe may also show a strong rise). Therefore, the limit does not necessarily reflect a limit from a “transient” free observation. We note that insertion of manual point sources in this case would result in a clear detection of a point source superimposed on the stellar field of the galaxy for sources brighter than K 18 mag. Similarly, for our X-shooter observations, there exists no later time observations taken with the same instrument, while the lack of calibrations taken with these data (taken with an acquisition camera) means also complicates subtractions. These limits are therefore obtained by both noting the point at which a point source becomes clearly visible in the images when inserted (necessarily a qualitative judgement) and by subtraction of the images from later observations taken both with the same camera, but a different filter, and in the same filter, but with a different camera. In practice, the limitations of both approaches yield rather similar answers in each case.
Photometric calibration was performed relative to the AAVSO Photometric All-Sky Survey (APASS; Henden et al. 2012) for our optical observations and the Two Micron All Sky Survey (2MASS; Jarrett et al. 2000; Skrutskie et al. 2006) in the infrared (IR); known zero points were used for Spitzer observations. In the case of our X-shooter observations, a limited number of APASS secondary standards were visible in our FOV (none in the first epoch i-band observations). Therefore, we initially calibrate the WHT observations to APASS, and then to the X-shooter acquisition data. We therefore calibrate all of our optical data to SDSS filters. Astrometric calibration was performed relative to the Third US Naval Observatory CCD Astrograph Catalog (UCAC3; Zacharias et al. 2010), and yielded a WCS fit to better than 0.1″ in most cases. This enables the VLBA position to be placed on our images to sub-pixel accuracy.
We obtained a single orbit of observations with the Hubble Space Telescope (HST), using Wide Field Camera 3 on 2015 Jun 03 (proposal 13949, PI: A. Levan). Observations were obtained in the F438W and F606W with the UVIS channel, and in the F160W filter in the IR channel. The exposure times for each filter were 1044, 686, and 306 respectively, and the data were reduced via astrodrizzle in the standard fashion. To precisely place the location of GRB 111005A on these images we subsequently align them to 2MASS observations using six stars in the field (one is omitted because of a significant offset from its 2MASS position, likely due to high proper motion). The resulting RMS of the fit to the world co-ordinate system is 0.1” in each axis.
Log of optical/IR observations of GRB 111005A.
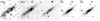 |
Fig. 1. Mosaic of the images of the GRB 111005A host. The images are from GALEX (FUV and NUV), Swift/UVOT (u-band) and Spitzer (Levan et al. 2011a). North is up and east is to the left. Each panel is 90″ × 90″ (24 kpc × 24 kpc). The red circle shows the VLBA position. |
2.3.2. Spectroscopy
In addition to our imaging observations, we obtained spectroscopy with the WHT on 2012 May 21, using the ISIS spectrograph with the R600B and R600R gratings. A total of four 300 s exposures were obtained in each arm, with the slit aligned to run through the major axis of the galaxy. The slit position is shown in Fig. 2.
The host galaxy of GRB 111005A was also observed with the X-shooter spectrograph mounted on the ESO VLT on 2013 Apr 01 (proposal 090.A-0088, PI: J. Fynbo). The observation lasted 2600 s at a fixed slit position of 151 degrees east of north illustrated in Fig. 3. This slit position covers both the centre of the galaxy and the radio position of the GRB.
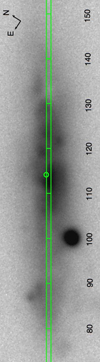 |
Fig. 2. Position of the WHT slit with regions marked by their distance from its beginning. The BPT diagnostic and metallicities of these regions are shown in Figs. 11 and 12, respectively. The circle denotes the afterglow VLBA position. |
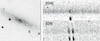 |
Fig. 3. Left panel: orientation of the VLT/X-shooter slit. The white cross marks our VLBA position of GRB 111005A. Right panel: 2D spectra. The horizontal axis corresponds to the wavelengths and the vertical axis to the position along the slit. The rotation curve is clearly visible with each line. The emission to the left panel corresponds to the galaxy centre, whereas the one to the right panel is offset ∼4.5″ to the northwest and has a much harder ionising flux as it exhibits much higher [O III]/[O II] ratio. |
2.4. Archival data
We analysed the VLA data taken during 2011 Nov 05–Oct 14 (Zauderer et al. 2011). VLA was in the D configuration. We first applied the VLA pipeline4 written in the Common Astronomy Software Applications (CASA) package (McMullin et al. 2007). The data were then imaged and analysed in CASA.
We have obtained the archival Swift/UVOT (Roming et al. 2005) u-band data taken on 2011 Dec 29 (85 days after the burst) and 2012 Jan 04 (91 days after the burst). We combined all images from a given epoch and subtracted the later combined image from the earlier one, which did not reveal any variable source (Fig. 4). Therefore we averaged all the data for the host galaxy analysis. We measured its flux in a 67.5″ aperture.
We obtained the host galaxy photometry from the NASA/IPAC Extragalactic Database, including IRAS and AKARI data. We also added our radio data from Michałowski et al. (2015). Finally, we have measured its ultraviolet (UV) emission from the GALEX (Martin et al. 2003, 2005)5 archive, using 67.5″ apertures.
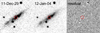 |
Fig. 4. Swift/UVOT u-band images of the GRB 111005A host taken at two epochs and the result of the subtraction showing no variable source. North is up and east is to the left. Each panel is 90″ × 90″ (24 kpc × 24 kpc). The red circle shows the VLBA position. |
3. Methods
For the host galaxy emission we applied the SED fitting method detailed in Michałowski et al. (2008, 2009, 2010a,b, 2012a, 2014a, see therein a discussion of the derivation of galaxy properties and typical uncertainties) which is based on 35 000 templates from the library of Iglesias-Páramo et al. (2007) plus some templates of Silva et al. (1998) and Michałowski et al. (2008), all of which were developed using GRASIL6 (Silva et al. 1998). They are based on numerical calculations of radiative transfer within a galaxy, which is assumed to be a triaxial axisymmetric system with diffuse dust and dense molecular clouds, in which stars are born.
The templates cover a broad range of galaxy properties from quiescent to starburst and span an Av range from 0 to 5.5 mag. The extinction curve (Fig. 3 of Silva et al. 1998) is derived from the modified dust grain size distribution of Draine & Lee (1984). The star formation histories are assumed to be a smooth Schmidt-type law (i.e. the SFR is proportional to the gas mass to some power; see Silva et al. 1998, for details) with a starburst (if any) on top of that, starting 50 Myr before the time at which the SED is computed. There are seven free parameters in the library of Iglesias-Páramo et al. (2007): the normalisation of the Schmidt-type law, the timescale of the mass infall, the intensity of the starburst, the timescale for molecular cloud destruction, the optical depth of the molecular clouds, the age of the galaxy and the inclination of the disc with respect to the observer.
We also used MAGPHYS7 (Multi-wavelength Analysis of Galaxy Physical Properties; da Cunha et al. 2008), which is an empirical, physically motived SED modelling code that is based on the energy balance between the energy absorbed by dust and that re-emitted in the IR. We used the Bruzual & Charlot (2003) stellar population models and adopted the Chabrier (2003) IMF. Similarly to GRASIL, in MAGPHYS, two dust media are assumed: a diffuse interstellar medium (ISM) and dense stellar birth clouds. Four dust components are taken into account: cold dust (15–25 K), warm dust (30-60 K), hot dust (130–250 K) and polycyclic aromatic hydrocarbons (PAHs). A simple power-law attenuation law is assumed.
We excluded some data from the SED modelling. The IRAS 100 μm and AKARI 140 μm fluxes are likely affected by poor resolution and are overestimated (such as in the case of the GRB 980425 host with the 160 μm Spitzer fluxes a factor of two higher than the Herschel/PACS fluxes; compare Le Floc’h et al. 2012 and Michałowski et al. 2014b). On the other hand, the ATCA radio observations from Michałowski et al. (2015) resolved the host (beamsize from ∼30″ × 4″ to 10″ ″ 2″), so the flux is likely underestimated.
4. Results
Our best position of the GRB 111005A afterglow comes from the VLBA observations with 1.31 0.491 mas FWHM beam (Fig. 5). This results in the position of the radio afterglow of α = 14:53:07.8078276, δ = 19:44:11.995387 (J2000) with the 1σ error of 0.2 mas. The source is not resolved with the 3σ upper limit on the angular size of <0.38 mas.
All data obtained during our multi-facility campaign are presented in Table 1, whereas the host galaxy photometry is presented in Table 3. The light curve and the three-epoch spectral energy distribution (SED) of the afterglow are shown in Figs. 6 and 7, respectively. Figure 8 shows the luminosity of the radio afterglow compared with cosmological GRBs (Chandra & Frail 2012) and local low-luminosity GRB 980425 (Kulkarni et al. 1998), GRB 031203 (Soderberg et al. 2004), GRB 060218 (Soderberg et al. 2006), and GRB 100316D (Margutti et al. 2013).
Figure 1 shows the images of the host galaxy at the UV and Spitzer wavelengths. The SED of the host galaxy is shown in Fig. 9. The galaxy properties derived using GRASIL and MAGPHYS are shown in Tables 4 and 5, respectively. All results of these two codes are consistent, especially the stellar mass estimates, which results from the good optical/NIR data coverage. We note that GRASIL uses the mass absorption coefficient κ(1.2 mm) = 0.67 cm2 g−1 (Silva et al. 1998), i.e. κ(850 μm) = 1.34 cm2 g−1 (assuming β = 2), whereas MAGPHYS uses the value 1.7 times smaller κ(850 μm) = 0.77 cm2 g−1 (da Cunha et al. 2008; Dunne et al. 2000), which should result in a higher dust mass. Indeed, MAGPHYS predicts a factor of 1.7 larger dust mass, so this difference can be fully explained by the difference in κ.
The WHT spectrum (Fig. 10) shows a wealth of star-forming emission lines (including O[II], O[III], Hβ, Hα, N[II], S[II]) visible across the galaxy disc, as well as a strong central bulge which appears as a near point source running through the spectra. The Baldwin–Phillips–Terlevich (BPT; Baldwin et al. 1981) diagnostics (Fig. 11) are generally consistent with star forming activity (not active galactic nuclei [AGN]), including that close to the nuclear regions of the galaxy, although we do note a region approximately 10″ from the nucleus in which AGN-like ratios are observed. The metallicity around the GRB region and nucleus of the galaxy as inferred by the R23 diagnostic is relatively high (Fig. 12), and suggests the GRB is born in a region with metallicity in excess of solar.
None of our subtractions yield any obvious residual emission in the optical or NIR. At 55 Mpc we would have expected either a GRB afterglow or an associated SN to be extremely bright. SN 1998bw would have appeared at a magnitude of R < 16.5 at the time of our first optical observations, and would have been clearly visible as a point source on the host galaxy. While these observations could be of limited value due to (unknown) extinction within the host galaxy, our Spitzer observations effectively remove that concern, and suggest that any SNe associated with GRB 111005A must have been a factor >50 fainter than SN 1998bw. In Fig. 13, we plot these limits graphically compared with both the expectations of models of broad lined SN Ic (Levan et al. 2005, in the case of the near-IR extrapolated into the mid-IR using a simple blackbody model), as well as observations of SN 2011dh, a SN IIb with good Spitzer observations (Helou et al. 2013). The Spitzer observations largely remove any concerns relating to extinction since even an AV = 30 mag would yield A3.6 = 1.5 mag, and so we would expect to have detected the resulting SNe. Indeed, we note that the deep IR limits (∼22 mag AB) imply an absolute magnitude of MIR > 12, comparable to the magnitude of the faint red transient detected by Kulkarni et al. (2007) in M85, which has been suggested to be a stellar merger. Therefore, we cover the full range of expected supernova properties, and probe into regions normally occupied by SN impostors.
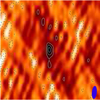 |
Fig. 5. VLBA image of the GRB 111005A afterglow on 2011 Oct 21 (16.5 days after the burst). North is up and east is to the left. The panel is 0.01″ × 0.01″ (2.7 pc 2.7 pc). The positive and negative contours are shown as solid and dashed lines, respectively at 2, 1, 2, 3, 4σ with the rms of 0.15 mJy beam−1. The beam (1.31 0.491 mas FWHM) is shown as a blue ellipse in the bottom-right corner. |
Photometry of ESO580-49, the host galaxy of GRB 111005A.
GRASIL results from the SED fitting.
MAGPHYS results from the SED fitting.
5. Discussion
5.1. Association of GRB 111005A with ESO 580-49 at z = 0.01326
The redshift of GRB 111005A has not been measured from the afterglow emission, so we provide here the evidence that GRB 111005A exploded in ESO 580-49. First of all, there is little doubt that the radio object detected by ATCA, WSRT, and VLBA before 40 days after the burst is the afterglow of GRB 111005A. Even though there have been cases of the detection of unrelated variable radio sources near SN positions (e.g. Brunthaler et al. 2010), one is highly unlikely to find a variable decaying radio object visible for only 40 days (with no rebrightening until at least ∼2000 days) spatially and temporarily coincident with a γ-ray error circle of a few arcminutes. Specifically, the object detected by VLBA must be the afterglow, because otherwise such a ∼0.7 mJy object would be detected by late time ATCA observations at a similar frequency, which have coarser spatial resolution and lower noise (see Table 1); if the source was not decaying, ATCA would have therefore detected an equal or stronger signal.
Moreover, its radio spectrum rises with frequency (Fig. 7), likely due to self-absorption. This is unheard of for star-forming galaxies or AGN, but is expected for GRB afterglows. Hence, we treat the VLBA position as the most precise position of GRB 111005A.
Moreover, the flux evolution at 18 and 34 GHz (Fig. 6) is not due to differences in resolution (and hence different contamination by the host galaxy), because ∼2000 days after the burst we did not detect any signal using the array configuration similar to the one used for early observations (see Table 1), which resulted in detections. Indeed, the observations on 2016 Sep 06 and 07 resulted in non-detections even though they have coarser resolution than those on 2011 Nov 02 and 08, during which we obtained strong detections. This would not be the case if the flux drop was the result of the difference in resolution.
At lower frequencies, the situation is different. The WSRT detection on 2011 Oct 18 during the EVN run is not consistent with the EVN upper limit. This can be explained if the signal is dominated by the extended emission of the host galaxy, not the point-like emission of the GRB. However, this may also be due to correlation losses during the EVN observations.
Even more revealing is the inconsistency between the VLA and ATCA observations at 5.5–5.8 GHz (Fig. 6 and Table 1). The VLA observations with poorer spatial resolution resulted in a detection of a non-variable source, whereas the ATCA observations with better resolution resulted in an upper limit approximately three times lower than the VLA detection. This strongly suggests that the emission detected by VLA is related to the host galaxy, not the GRB. We therefore conclude that the emission of the afterglow at the frequencies lower than 10 GHz was not detected. This may be due to strong self-absorption.
The question of whether GRB 111005A is hosted by ESO 580-49, or is a background object is less definite, and must be addressed on statistical grounds. We estimated the chance coincidence of such a bright galaxy using the SDSS r-band counts (Yasuda et al. 2001, their Table 2), showing ∼0.42 deg−2 galaxies brighter than ESO 580-49 (r ∼ 14 mag). It is somewhat arbitrary to estimate the angular distance of GRB 111005A to ESO 580-49, as it is located inside the galaxy disc. The sub-arcsec VLBA position is ∼1″ from the galaxy centre as seen on the 3.6 μm image (Fig. 1), which gives a negligibly small probability of chance association of ∼ 10−7, meaning that such a bright galaxy should not be found by chance even in a sample of ∼ 1000 Swift GRBs. This implies that ESO 580-49 is the host galaxy of GRB 111005A.
From now on, we therefore assume z = 0.01326 as a red-shift of GRB 111005A. This is the second closest GRB discovered to date, closely following the GRB 980425 at z = 0.0085 (Tinney et al. 1998).
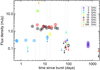 |
Fig. 6. Radio light curve of the afterglow of GRB 111005A. Data points are colour-coded by frequency. Dotted lines show the time intervals at which the SEDs are shown in Fig. 7. The fluxes at ∼650 days are host detections (see Table 1). |
5.2. Prompt emission
The redshift of z = 0.01326 implies a peak luminosity of Lγ = (6.0 ± 1.4) × 1046 erg s−1 (15–150 keV band). This is comparable to the peak luminosity of GRB 980425 of (5.5 ± 0.7) × 1046 erg s−1 (24–1820 keV band; Galama et al. 1998) implying that GRB 111005A was also a low-luminosity burst.
The shape of the light curve of the prompt emission of GRB 111005A (Fig. 14; Evans et al. 2007, 2009) was similar in some respects to that of other SN-less long GRBs: 060505 (Gehrels et al. 2006) and 060614 (McBreen et al. 2008). All three GRBs exhibit a prominent peak at the time of the trigger. The difference is that the peak was ×5 s long for GRBs 060505 and 060614, whereas it was 26 s long for GRB 111005A. Moreover, the peak for GRB 060614 was followed by a fainter emission lasting ∼60 s, which was not the case for the other two.
5.3. Afterglow emission
GRB 111005A was also sub-luminous when it comes to its radio emission. Figure 8 shows that it is an order of magnitude less luminous than the local low-luminosity GRBs. In particular the 18 GHz emission of GRB 111005A (green points on this figure) is ten times less luminous than the GRB 031203 (Soderberg et al. 2004) and 060218 (Soderberg et al. 2006) at 22.5 GHz at a similar epoch. Similarly, 5 and 9 GHz limits for GRB 111005A (violet and blue arrows on this figure) are 10–100 times lower than the luminosity of GRB 980425 (Kulkarni et al. 1998), 031203, 060218, and GRB 100316D (Margutti et al. 2013).
The temporal behaviour of the radio afterglow of GRB 111005A was also unusual. It shows a relatively constant flux, and then a rapid decay (α ∼ 4.5 with F ∝ t−α) approximately a month after the GRB explosion. A flat evolution with a subsequent decay is expected from the model of the burst exploding in the uniform medium, but the break should occur after a few days and the decay slope should be shallower (∼2–3; Fig. 1 of Smith et al. 2005a). Such rapid decay has not been observed for any other GRB (e.g. Soderberg et al. 2004; Smith et al. 2005b; van der Horst et al. 2005, 2014; de Ugarte Postigo et al. 2012).
We fitted a line to the afterglow SEDs in the log-log space (power-law Sν ∝ να; Fig. 7) and determined the following parameters:
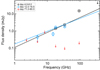 |
Fig. 7. SEDs of the afterglow of GRB 111005A. Data points are colour-coded by the time at which they were obtained. The lines corresponds to a power-law fits (consistent with each other within errors) described in Eqs. (1) and (2). |
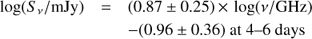 (1)
(1)
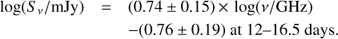 (2)
(2)
These lines are consistent with each other within errors, and the slope of α = 0.74–0.87 is within the range of slopes of other GBRs (e.g. Smith et al. 2005b; van der Horst et al. 2005, 2014; de Ugarte Postigo et al. 2012). On the other hand, this slope is unlikely for AGN emission, which shows negative slopes (e.g. Fig. 2 of Prandoni et al. 2009), except for blazars (which is not the case for this galaxy, as it is viewed edge-on).
Our VLBA upper limit of <0.38 mas on the size of the afterglow 16.5 days after the burst corresponds to <0.1 pc at z = 0.01326. This is smaller than the size of the radio afterglow of GRB 030329 of 0.19 ± 0.06 pc measured 24.5 days after the burst (Taylor et al. 2004). Depending on the model, at t = 16.5 days these data suggest a size of 0.14–0.19 pc for GRB 030329, meaning that GRB 111005A expanded a factor of >1.5–2 slower. The mean apparent expansion velocity of GRB 111005A is <1.1 × 10⁶ km s−1 (<3.7c; consistent with both mildly relativistic and non-relativistic expansion), indeed lower than ∼6c measured for GRB 030329 at 24.5 days (Pihlström et al. 2007).
5.4. The lack of a supernova
The non-detection of SN emission in the NIR for GRB 111005A (Fig. 13) cannot be ascribed to dust obscuration, effectively ruling out the origin of GRB 111005A as either a classical long-GRB, or any other standard core collapse event down to limits ∼20 times fainter than luminosities measured for other SNe associated with GRBs. This is similar to GRB 060505 and 060614, for which Fynbo et al. (2006), Della Valle et al. (2006), and Gal-Yam et al. (2006) did not detect SN emission despite deep observations (see also Gehrels et al. 2006).
The lack of SN emission in long GRBs has been the subject of a long debate (Fynbo et al. 2006; Della Valle et al. 2006; Gal-Yam et al. 2006; Gehrels et al. 2006; King et al. 2007; Hjorth & Bloom 2012; Retter & Heller 2012; Yang et al. 2015; Jin et al. 2015). Theoretical stellar explosion models explain such behaviour by invoking explosions that do not result in the ejection of large amounts of nickel (Heger et al. 2003; Fryer et al. 2006). This happens either because nickel is not produced, or falls back on the forming black hole. It is likely that GRB 111005A belongs to this category.
Alternatively, the lack of SNe in GRB 060614, together with a weak NIR bump, was interpreted as a Li-Paczyński macronova/kilonova resulting from a compact binary merger (Yang et al. 2015; Jin et al. 2015; Wang et al. 2017; Dado & Dar 2018; Yue et al. 2018). We do not have the necessary NIR data to test this hypothesis for GRB 111005A, but it is also plausible. For future bursts it will be possible to test this with gravitational wave observatories (Li et al. 2016; LIGO Scientific Collaboration et al. 2017; Kim et al. 2017).
5.5. Mechanism of explosion
Based on the result presented above, we discuss here all the possible mechanisms for GRB 111005A: A classical core-collapse event, an off-axis GRB, AGN activity, a tidal disruption event (TDE), and X-ray binaries. We conclude that none of these models fully explain all the properties of GRB 111005A, meaning that this burst likely represents a new type of explosion not characterised yet before.
Classical core-collapse event. The classical long GRB collapsar model is disfavoured mostly by the rapid flux decline (α ∼ 4.5; Sect. 5.2) at ∼30 days after the burst. Moreover, low γ-ray and radio luminosities, and the lack of an SN, suggest that GRB 111005A represents a different class of GRB, and is unlike typical core-collapse events.
Off-axis GRB. A GRB with the jet axis at an angle to the line-of-sight exhibits a different afterglow evolution (van Eerten et al. 2010; van Eerten & MacFadyen 2011; Kathirgamaraju et al. 2016). We explored the off-axis GRB library of van Eerten et al. (2010)8, and found these models inconsistent with our data in three aspects: (i) they do not reproduce sharp flux decline after ∼30 days; (ii) they exhibit slightly rising (instead of flat) evolution before ∼30 days; (iii) they exhibit a flatter spectral slope compared with our data. Finally, the off-axis GRB model does not explain the lack of a SN for GRB 111005A.
Active galactic nuclei. The VLBA position of GRB 111005A (with 0.2 mas uncertainty) is ∼1″(∼300 pc) from the galaxy centre where the black hole is likely located, so this scenario is unlikely (Fig. 15). However, it cannot be ruled out that, due to the projection effect, the supermassive black hole is located behind the dust cloud at the position where we detected GRB 111005A. This would then be the first long GRB associated with an AGN, and the second GRB in general, after the short GRB 150101B (Xie et al. 2016). However, the positive radio spectral slope of GRB 111005A (Sect. 5.3) disfavours the AGN scenario.
Tidal disruption event. A TDE occurs when a star is torn apart by a supermassive black hole due to tidal forces (Hills 1975; Rees 1988). GRB 111005A was detected close in the central area of a galaxy which makes this scenario more promising than ever for a GRB event. However, the VLBA position of GRB 111005A appears to be ∼1“ from the exact galaxy centre where the black hole is likely located (Fig. 15). Moreover, the radio light curve of a well-studied TDE was shown to rise over a few hundred days after the onset (Bloom et al. 2011; Levan et al. 2011c; Zauderer et al. 2011, 2013; Berger et al. 2012), unlike this GRB. This scenario is therefore unlikely for GRB 111005A.
X-ray binary. An X-ray binary is a system of a compact object and another star, in which the matter is flowing from the latter to the former. The radio behaviour of GRB 111005A is inconsistent with that of X-ray binaries, because they exhibit nearly flat radio spectra (Bogdanov et al. 2015; Tetarenko et al. 2015, compare with Fig. 7). Moreover, the luminosity density of GRB 111005A of ∼1028 erg s−1 Hz−1 at 18 GHz (Fig. 8) corresponds to the luminosity of ∼1038 erg s−1, which is three to four orders of magnitude higher than luminosities of X-ray binaries (e.g. Bogdanov et al. 2015).
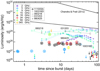 |
Fig. 8. Radio luminosity of the afterglow of GRB 111005A (circles), compared with cosmological GRBs (region marked by black lines; Chandra & Frail 2012), GRB 980425 (small stars; Kulkarni et al. 1998), GRB 031203 (small squares; Soderberg et al. 2004), GRB 060218 (small triangles; Soderberg et al. 2006), and GRB 100316D (small diamonds; Margutti et al. 2013). Datapoints are colour-coded by frequency. |
5.6. Environment of the GRB explosion
The HST observations are shown in Fig. 15, where wide and narrow fields of view are presented. The observations provide an excellent view of the morphology of the galaxy, which appears to be a slightly disturbed spiral galaxy. Unlike for the vast majority of GRB hosts, the high spatial resolution of the HST images resolves the galaxy at the ∼24 parsec level. This means that numerous individual star forming regions are visible as well as prominent dust lanes. There is little evidence for any prominent bulge. The VLBA position for GRB 111005A is clearly offset from the nucleus of the galaxy, and lies in a dust lane in a region that does show strong IR emission typical of obscured star forming regions. The position offers direct evidence that GRBs can reside behind significant dust columns, but the absence of any counterpart in the near and mid-infrared suggests that the dust extinction would have to be extreme to evade detection.
In the VLT/X-shooter spectrum (Fig. 3), in addition to the continuum from the host, we detect strong emission lines. The emission line profile along the slit clearly shows two peaks. One peak is aligned with the centre of the host galaxy and the other peak is offset by about 4.5″ to the Northwest along the slit. This is illustrated in Fig. 3 for the [O II] and [O III] lines. It is clear that the clump offset from the centre of the host has a much harder ionising flux as the [O III]/[O II] ratio is much stronger here.
5.7. Global properties of the host galaxy
ESO 580-49, the host of GRB 111005A, is clearly a star-forming disc galaxy viewed edge-on with multiple star-forming regions visible in the UV (Fig. 1). The galaxy is asymmetric, with the northwest part being more star-forming (or less dust-obscured), as evidenced by more prominent UV emission. On the other hand, NIR images (tracing the stellar mass distribution) are much more symmetric, and show a disc structure of the galaxy.
As shown in Fig. 9, at wavelengths longer than 1 μm, the SED of the GRB 111005A host is very similar to that of the GRB 980425 host (when scaled up by a factor of four to match the IR luminosity of the GRB 111005A host). At shorter wavelengths, the scaled GRB 980425 is brighter, which is partially a consequence of the much lower inclination compared with the nearly edge-on GRB 111005A host, and therefore a much lower dust attenuation.
Figure 16 shows the dust-to-stellar mass ratio as a function of NUV−r colour of the GRB 111005A and 980425 hosts compared with other local galaxies observed by Herschel (adopted from Fig. 5 of Michałowski et al. 2014b). It shows that the hosts of both GRBs 111005A and 980425 are close to the lower envelope of the dust-to-stellar mass ratio at their NUV−r colours. Recently, Hatsukade et al. (2014, but see Perley et al. 2017b), Stanway et al. (2015b), and Michałowski et al. (2016, 2018a) claimed that GRB/SN hosts exhibit low molecular gas masses (see alternative views in Arabsalmani et al. 2018 and Michałowski et al. 2018b), and we show here than they may also be dust-deficient.
As in Michałowski et al. (2014b) and Kohn et al. (2015), we integrated the local (mostly z < 0.03) IR luminosity function (Sanders et al. 2003) to show that ∼95% of local galaxies are less luminous than the GRB 111005A host (with LIR ∼ 109.6 L⊙), and that ∼25% of the total star formation activity in the local universe happens in these faint galaxies. Having two GRB hosts (980425 and 111005A) below this cut and none above is still consistent with the GRB rate being proportional to the cosmic SFR density (SFRD), but there is a tension with such a proportionality.
This can also be demonstrated by calculating an SFR-weighted mean IR luminosity of local galaxies. If GRBs trace SFRD in an unbiased way, their host galaxies should have a mean IR luminosity similar to this SFR-weighted mean of other galaxies. Mean luminosity of galaxies characterised by the luminosity function ϕ is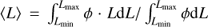 . However, in order to compare this to GRB hosts, the mean must be weighted by SFRs, because a galaxy with a higher SFR has a higher probability of hosting a GRB. The mean therefore becomes
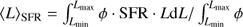 . Assuming SFR ∝ LIR and using the parameters of the Sanders et al. (2003) luminosity function, this gives
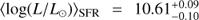 , or
, or 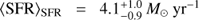 using the Kennicutt (1998) conversion and assuming the Chabrier (2003) IMF (propagating the errors on the luminosity function parameters using the Monte Carlo method). This value is only weakly dependent on the adopted cut-off luminosities, log(Lmin/L⊙) = 7 and log(Lmax/L⊙) = 13, as is mostly constrained by the shape of the luminosity function close to its knee. This mean SFR is a factor of approximately ten higher than the SFRs of the hosts of GRBs 111005A and 980425; if higher numbers of low-z GRBs are found in such low-luminosity galaxies, then this would mean that the GRB rate is not simply proportional to the cosmic SFRD, and is biased towards low-luminosity galaxies, at least locally.
This is in line with the result of Perley et al. (2013, 2015, 2016b), Vergani et al. (2015) and Schulze et al. (2015) that GRB hosts are biased towards less-massive galaxies than what would be expected from the assumption that the GRB rate is proportional to the cosmic SFRD (see also Boissier et al. 2013). Perley et al. (2016b) explained this effect by the bias of GRBs against galaxies with super-solar metallicities, which corresponds to the aversion to massive galaxies at low-z (as opposed to high-z when this metallicity cutoff is higher than metallicities of most galaxies, even the massive ones). On the other hand, Michałowski et al. (2012b), Hunt et al. (2014), Schady et al. (2014), Kohn et al. (2015) and Greiner et al. (2015) argued for GRB host properties to be consistent with those of the general population of star-forming galaxies. Further investigation is therefore needed.
The sample of SN-less GRBs is small, but it is instructive to compare the GRB 111005A host with the hosts of two other such GRBs. Both the hosts of GRB 111005A and 060505 (Thöne et al. 2008) have stellar masses of ∼109.7 M⊙, whereas that of GRB 060614 is much less massive with 108.2 M⊙ (Castro Cerón et al. 2010). This range is well within that of other long GRBs (Savaglio et al. 2009; Castro Cerón et al. 2010; Perley et al. 2016b). Similarly, SFRs of the hosts of GRB 111005A and 060505 are similar (∼0.5 M⊙ yr−1), whereas that of the GRB 060614 host is much smaller (∼0.02 M⊙ yr−1). Finally, the hosts of both GRB 111005A and 060505 are spirals (Ofek et al. 2007; Thöne et al. 2008), whereas the host of GRB 060614 is a much more compact galaxy (Gal-Yam et al. 2006). We therefore conclude that the hosts of GRB 111005A and 060505 are similar, but that of GRB 060614 is a much smaller galaxy. Nonetheless, none of these properties differentiate them from other long GRBs, though the GRB 060614 is one of the smallest GRB hosts.
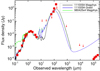 |
Fig. 9. SED of ESO 580-49, the host galaxy of GRB 111005A. Datapoints are shown as red squares and arrows, whereas GRASIL and MAGPHYS models are shown as a blue and black lines, respectively. The data at 100, 140 μm and in the radio were not used in the modelling due to either too poor spatial resolution, or resolving out the extended emission (see Sect. 3). The SED of the GRB 980425 host (Michałowski et al. 2014b) scaled up by a factor of four is shown for comparison (green line). |
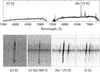 |
Fig. 10. Top panel: spectrum of the GRB 111005A host added over the entire extend of the slit (Fig. 2). Some emission lines are marked, and the bottom panels show their 2D spectra. The horizontal axis corresponds to the wavelengths and the vertical axis to the position along the slit (400 pixels, i.e. 8011). The rotation curve is clearly visible with each line. The drop at ∼5300 Å is due to the dichroic gap between the blue and red arms of the ISIS. |
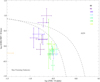 |
Fig. 11. BPT diagnostic (Baldwin et al. 1981) along the slit of the host of GRB 111005A. Most of the regions are consistent with star forming activity. The nucleus lies at approximately 115″. The regions along the slit are defined in Fig. 2. |
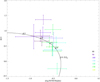 |
Fig. 12. The R23 metallicity diagnostic along the host of GRB 111005A. The nucleus lies at approximately 115″. The regions along the slit are defined in Fig. 2. |
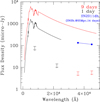 |
Fig. 13. Limits on supernova-like emission from GRB111005A (arrows). The lines show the models from Levan et al. (2005), scaled to a distance of 55 Mpc. In the case of the nine-day epoch we have used a model from seven days, and extended the template from 2.2 to 4.8 μm based on a purely thermal extrapolation. We also show the observations of the type IIb SN 2011dh in M51 (Helou et al. 2013), as it would appear at 55 Mpc. |
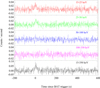 |
Fig. 14. Prompt emission light curve of GRB 111005A. The first four panels show four Swift/BAT energy bands, whereas the last one shows the combined emission. |
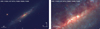 |
Fig. 15. HST image of the GRB 111005A host showing the entire galaxy (left panel) and the central region (right panel). The green circle shows the GRB 111005A afterglow VLBA position. It is located behind a dust lane (with suppressed optical emission). |
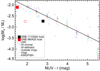 |
Fig. 16. Dust-to-stellar mass ratio as a function of UV-to-optical colour of the GRB 111005A (black square), GRB 980425 host (red square; Michałowski et al. 2014b), LMC (open red square; M∗ from Skibba et al. 2012 and Md derived applying the method of Bianchi 2013 to the data from Meixner et al. 2013), KINGFISH galaxies (blue plusses; Kennicutt et al. 2011), and the averages of other local galaxies in eight colour bins (Table 1 and Fig. 4 of Cortese et al. 2012). The solid line represents a linear fit to the data. Both GRBs 111005A and 980425 are a factor of ∼2 below the trend. This figure is reproduced from Michałowski et al. (2014b). |
5.8. Metallicity of the host and the GRB site
Indeed, this issue is complicated by the discovery of GRB hosts with solar or super-solar metallicities (Prochaska et al. 2009; Levesque et al. 2010; Krühler et al. 2012a; Savaglio et al. 2012; Elliott et al. 2013; Schulze et al. 2014; Hashimoto et al. 2015; Schady et al. 2015; Stanway et al. 2015a). This can either be explained if the metallicity cutoff is not strict, but only decreases the number of high-metallicity GRBs, not ruling them out, or if these particular GRBs represent a different class of events with a different physical mechanism, for example a binary system (Fryer & Heger 2005; Trenti et al. 2015).
We found a high metallicity for the GRB 111005A host, around 1–2 times solar (Fig. 12). A similar conclusion was drawn by Tanga et al. (2018) using integral field spectroscopy. Therefore, despite distance and host luminosity (Fig. 9) being similar to that of GRB 980425, the GRB 111005A host has much higher metallicity. Moreover, the GRB itself did not explode in the most metal-poor region of the galaxy (Fig. 12), which was the case for the other low-z GRBs (Christensen et al. 2008; Levesque et al. 2011; Thöne et al. 2014; Izzo et al. 2017).
Super-solar metallicity of the GRB 111005A host and its mass of ∼5 × 10⁹ M⊙ (Tables 4 and 5) are inconsistent with the solar metallicity cutoff and the mass cutoff of <2 109 M proposed by Perley et al. (2016b) at z ∼ 0. This suggests that GRB 111005A belongs to a different category from GRBs for which these cutoff values were derived. Those GRBs are all at higher redshifts than GRB 111005A, and were selected in an optically unbiased way. Therefore, GRB 111005A likely belongs to a rare class of event, which is not present in an unbiased sample of approximately one hundred events.
6. Conclusions
Using the 5–345 GHz observations of the afterglow of GRB 111005A, we found that it is located in an edge-on disc galaxy at z = 0.01326, which makes it the second closest GRB known to date. The low γ-ray and radio luminosities, rapid decay, lack of a SN and super-solar metallicity suggest that GRB 111005A represents a class of GRBs that is different from typical core-collapse events. The existence of two local GRBs in low-luminosity galaxies is still consistent with the hypothesis that the GRB rate is proportional to the cosmic SFR density, but suggests that the GRB rate may be biased towards low SFRs. The hosts of both GRBs 111005A and 980425 also exhibit lower dust content than what would be expected from their stellar masses and optical colours.
Galaxy Evolution Explorer; http://galex.stsci.edu/
Acknowledgments
We thank Joanna Baradziej and our referee for help with improving this paper; the staff at the ATCA, EVN, VLBA, WSRT, PdBI, APEX, VLT, WHT, Spitzer and HST for scheduling these observations. Axel Weiss for help with the APEX observations; and Jan Martin Winters for help with the PdBI observations. M.J.M. and A.-L.T. acknowledge the support of the National Science Centre, Poland through the POLONEZ grant 2015/19/P/ST9/04010. M.J.M. acknowledges the support of the UK Science and Technology Facilities Council, the SUPA Postdoctoral and Early Career Researcher Exchange Program, and the hospitality at the Harvard-Smithsonian Center for Astrophysics and the National Astronomical Observatories, Chinese Academy of Sciences. This project has received funding from the European Union’s Horizon 2020 research and innovation programme under the Marie Skłodowska-Curie grant agreement No. 665778. The Dark Cosmology Centre is funded by the Danish National Research Foundation. H.D. acknowledges financial support from the Spanish Ministry of Economy and Competitiveness (MINECO) under the 2014 Ramon y Cajal program MINECO RYC-2014-15686. L.S. acknowledges the support by National Basic Research Program of China (No. 2014CB845800) and the National Natural Science Foundation of China (No. 11361140349 and No. 11103083). The Australia Telescope is funded by the Commonwealth of Australia for operation as a National Facility managed by CSIRO. The National Radio Astronomy Observatory is a facility of the National Science Foundation operated under cooperative agreement by Associated Universities, Inc. This work made use of the Swinburne University of Technology software correlator, developed as part of the Australian Major National Research Facilities Programme and operated under licence. The European VLBI Network is a joint facility of independent European, African, Asian, and North American radio astronomy institutes. Scientific results from data presented in this publication are derived from the following EVN project code: RP018. e-VLBI research infrastructure in Europe was supported by the European Union’s Seventh Framework Programme (FP7/2007-2013) under grant agreement RI-261525 NEXPReS. This work has been supported by the European Commission Framework Programme 7, Advanced Radio Astronomy in Europe, grant agreement No. 227290. This publication is based on data acquired with the Atacama Pathfinder Experiment (APEX). APEX is a collaboration between the Max-Planck-Institut fur Radioastronomie, the European Southern Observatory, and the Onsala Space Observatory. Based on observations carried out with the IRAM Plateau de Bure Interferometer. IRAM is supported by INSU/CNRS (France), MPG (Germany) and IGN (Spain). The Westerbork Synthesis Radio Telescope is operated by the ASTRON (Netherlands Institute for Radio Astronomy) with support from the Netherlands Foundation for Scientific Research (NWO). Based on observations made with ESO Telescopes at the La Silla Paranal Observatory under programmes 288.D-5004, 088.D-0523, and 090.A-0088. The WHT and its override programme are operated on the island of La Palma by the Isaac Newton Group in the Spanish Observatorio del Roque de los Muchachos of the Instituto de Astrofisica de Canarias. Based on observations made with the NASA/ESA Hubble Space Telescope, obtained at the Space Telescope Science Institute, which is operated by the Association of Universities for Research in Astronomy, Inc., under NASA contract NAS 5-26555. These observations are associated with program # 13949. This work made use of data supplied by the UK Swift Science Data Centre at the University of Leicester. This research has made use of the NASA/ IPAC Infrared Science Archive, which is operated by the Jet Propulsion Laboratory, California Institute of Technology, under contract with the National Aeronautics and Space Administration. This research is based on observations with AKARI, a JAXA project with the participation of ESA. Galaxy Evolution Explorer (GALEX) is a NASA Small Explorer, launched in 2003 April. We gratefully acknowledge NASA’s support for construction, operation, and science analysis for the GALEX mission, developed in cooperation with the Centre National d’Etudes Spatiales of France and the Korean Ministry of Science and Technology. This research has made use of data obtained from the High Energy Astrophysics Science Archive Research Center (HEASARC), provided by NASA’s Goddard Space Flight Center. This publication makes use of data products from the Two Micron All Sky Survey, which is a joint project of the University of Massachusetts and the Infrared Processing and Analysis Center/California Institute of Technology, funded by the National Aeronautics and Space Administration and the National Science Foundation. This research was made possible through the use of the AAVSO Photometric All-Sky Survey (APASS), funded by the Robert Martin Ayers Sciences Fund. This research has made use of the GHostS database (www.grbhosts.org; Savaglio et al. 2009), which is partly funded by Spitzer/NASA grant RSA Agreement No. 1287913; the GRB list maintained by Jochen Greiner (www.mpe.mpg.de/∼jcg/grbgen.html); the NASA/IPAC Extragalactic Database (NED) which is operated by the Jet Propulsion Laboratory, California Institute of Technology, under contract with the National Aeronautics and Space Administration; SAOImage DS9, developed by Smithsonian Astrophysical Observatory (Joye & Mandel 2003); the NASA’s Astrophysics Data System Bibliographic Services; and the Edward Wright Cosmology Calculator www.astro.ucla.edu/∼wright/CosmoCalc.html (Wright 2006).
References
- Alard, C., & Lupton, R. H. 1998, ApJ, 503, 325 [NASA ADS] [CrossRef] [Google Scholar]
- Arabsalmani, M., Roychowdhury, S., Zwaan, M. A., Kanekar, N., & Michałowski, M. J. 2015, MNRAS, 454, L51 [NASA ADS] [CrossRef] [Google Scholar]
- Arabsalmani, M., Le Floc’h, E., Dannerbauer H., et al. 2018, MNRAS, 476, 2332 [NASA ADS] [CrossRef] [Google Scholar]
- Baldwin, J. A., Phillips, M. M., & Terlevich, R. 1981, PASP, 93, 5 [NASA ADS] [CrossRef] [EDP Sciences] [Google Scholar]
- Barthelmy, S. D., Barbier, L. M., Cummings, J. R., et al. 2005, Space Sci. Rev., 120, 143 [NASA ADS] [CrossRef] [Google Scholar]
- Barthelmy, S. D., Baumgartner, W. H., Cummings, J. R., et al. 2011, GRB Coordinates Network, 12415 [Google Scholar]
- Berger, E., Cowie, L. L., Kulkarni, S. R., et al. 2003, ApJ, 588, 99 [NASA ADS] [CrossRef] [Google Scholar]
- Berger, E., Zauderer, A., Pooley, G. G., et al. 2012, ApJ, 748, 36 [NASA ADS] [CrossRef] [Google Scholar]
- Bianchi, S. 2013, A&A, 552, A89 [NASA ADS] [CrossRef] [EDP Sciences] [Google Scholar]
- Bloom, J. S., Giannios, D., Metzger, B. D., et al. 2011, Science, 333, 203 [CrossRef] [PubMed] [Google Scholar]
- Bogdanov, S., Archibald, A. M., Bassa, C., et al. 2015, ApJ, 806, 148 [NASA ADS] [CrossRef] [Google Scholar]
- Boissier, S., Salvaterra, R., Le Floc’h, E., et al. 2013, A&A, 557, A34 [NASA ADS] [CrossRef] [EDP Sciences] [Google Scholar]
- Brunthaler, A., Martí-Vidal, I., Menten, K. M., et al. 2010, A&A, 516, A27 [NASA ADS] [CrossRef] [EDP Sciences] [Google Scholar]
- Bruzual, G., & Charlot, S. 2003, MNRAS, 344, 1000 [NASA ADS] [CrossRef] [Google Scholar]
- Castro Cerón, J. M., Michałowski, M. J., Hjorth J., et al. 2006, ApJ, 653, L85 [NASA ADS] [CrossRef] [Google Scholar]
- Castro Cerón, J. M., Michałowski, M. J., Hjorth, J., et al. 2010, ApJ, 721, 1919 [NASA ADS] [CrossRef] [Google Scholar]
- Chabrier, G. 2003, ApJ, 586, L133 [NASA ADS] [CrossRef] [Google Scholar]
- Chandra, P., & Frail, D. A. 2012, ApJ, 746, 156 [NASA ADS] [CrossRef] [Google Scholar]
- Christensen, L., Vreeswijk, P. M., Sollerman, J., et al. 2008, A&A, 490, 45 [NASA ADS] [CrossRef] [EDP Sciences] [Google Scholar]
- Condon, J. J., Cotton, W. D., Greisen, E. W., et al. 1998, AJ, 115, 1693 [NASA ADS] [CrossRef] [Google Scholar]
- Cortese, L., Ciesla, L., Boselli, A., et al. 2012, A&A, 540, A52 [NASA ADS] [CrossRef] [EDP Sciences] [Google Scholar]
- da Cunha, E., Charlot, S., & Elbaz, D. 2008, MNRAS, 388, 1595 [NASA ADS] [CrossRef] [Google Scholar]
- Dado, S., & Dar, A. 2018, ApJ, 855, 88 [NASA ADS] [CrossRef] [Google Scholar]
- de Ugarte Postigo, A., Lundgren, A., Martín, S., et al. 2012, A&A, 538, A44 [NASA ADS] [CrossRef] [EDP Sciences] [Google Scholar]
- Della Valle, M., Chincarini, G., Panagia, N., et al. 2006, Nature, 444, 1050 [NASA ADS] [CrossRef] [PubMed] [Google Scholar]
- Deller, A. T., Brisken, W. F., Phillips, C. J., et al. 2011, PASP, 123, 275 [NASA ADS] [CrossRef] [Google Scholar]
- Draine, B. T., Lee, H. M. 1984, ApJ, 285, 89 [Google Scholar]
- Dunne, L., Eales, S., Edmunds, M., et al. 2000, MNRAS, 315, 115 [NASA ADS] [CrossRef] [Google Scholar]
- Elliott, J., Krühler, T., Greiner, J., et al. 2013, A&A, 556, A23 [NASA ADS] [CrossRef] [EDP Sciences] [Google Scholar]
- Evans, P. A., Beardmore, A. P., Page, K. L., et al. 2007, A&A, 469, 379 [NASA ADS] [CrossRef] [EDP Sciences] [Google Scholar]
- Evans, P. A., Beardmore, A. P., Page, K. L., et al. 2009, MNRAS, 397, 1177 [NASA ADS] [CrossRef] [Google Scholar]
- Frail, D. A., Bertoldi, F., Moriarty-Schieven, G. H., et al. 2002, ApJ, 565, 829 [NASA ADS] [CrossRef] [Google Scholar]
- Frail, D. A., Soderberg, A. M., Kulkarni, S. R., et al. 2005, ApJ, 619, 994 [NASA ADS] [CrossRef] [Google Scholar]
- Fryer, C. L., & Heger, A. 2005, ApJ, 623, 302 [NASA ADS] [CrossRef] [Google Scholar]
- Fryer, C. L., Young, P. A., & Hungerford, A. L. 2006, ApJ, 650, 1028 [NASA ADS] [CrossRef] [Google Scholar]
- Fynbo, J. P. U., Watson, D., Thone, C. C., et al. 2006, Nature, 444, 1047 [NASA ADS] [CrossRef] [PubMed] [Google Scholar]
- Fynbo, J. P. U., Jakobsson, P., Prochaska, J. X., et al. 2009, ApJS, 185, 526 [NASA ADS] [CrossRef] [Google Scholar]
- Galama, T. J., Vreeswijk, P. M., van Paradijs, J., et al. 1998, Nature, 395, 670 [NASA ADS] [CrossRef] [Google Scholar]
- Gal-Yam, A., Fox, D. B., Price, P. A., et al. 2006, Nature, 444, 1053 [NASA ADS] [CrossRef] [PubMed] [Google Scholar]
- Gehrels, N., Chincarini, G., Giommi, P., et al. 2004, ApJ, 611, 1005 [NASA ADS] [CrossRef] [Google Scholar]
- Gehrels, N., Norris, J. P., Barthelmy, S. D., et al. 2006, Nature, 444, 1044 [NASA ADS] [CrossRef] [PubMed] [Google Scholar]
- Greiner, J., Krühler, T., Klose, S., et al. 2011, A&A, 526, A30 [NASA ADS] [CrossRef] [EDP Sciences] [Google Scholar]
- Greiner, J., Fox, D. B., Schady, P., et al. 2015, ApJ, 809, 76 [NASA ADS] [CrossRef] [Google Scholar]
- Greiner, J., Michałowski, M. J., Klose, S., et al. 2016, A&A, 593, A17 [NASA ADS] [CrossRef] [EDP Sciences] [Google Scholar]
- Güsten, R., Nyman, L. Å., Schilke, P., et al. 2006, A&A, 454, L13 [NASA ADS] [CrossRef] [EDP Sciences] [Google Scholar]
- Hashimoto, T., Perley, D. A., Ohta, K., et al. 2015, ApJ, 806, 250 [NASA ADS] [CrossRef] [Google Scholar]
- Hatsukade, B., Ohta, K., Endo, A., et al. 2014, Nature, 510, 247 [NASA ADS] [CrossRef] [Google Scholar]
- Heger, A., Fryer, C. L., Woosley, S. E., Langer, N., & Hartmann, D. H. 2003, ApJ, 591, 288 [NASA ADS] [CrossRef] [Google Scholar]
- Helou, G., Kasliwal, M. M., Ofek, E. O., et al. 2013, ApJ, 778, L19 [NASA ADS] [CrossRef] [Google Scholar]
- Henden, A. A., Levine, S. E., Terrell, D., Smith, T. C., & Welch, D. 2012, J. Am. Assoc. Variable Star Observers (JAAVSO), 40, 430 [Google Scholar]
- Hills, J. G. 1975, Nature, 254, 295 [NASA ADS] [CrossRef] [Google Scholar]
- Hjorth, J., & Bloom, J. S. 2012, The Gamma-Ray Burst - Supernova Connection, Cambridge University Press, 169 [CrossRef] [Google Scholar]
- Hjorth, J., Sollerman, J., Møller, P., et al. 2003, Nature, 423, 847 [NASA ADS] [CrossRef] [PubMed] [Google Scholar]
- Hjorth, J., Malesani, D., Jakobsson, P., et al. 2012, ApJ, 756, 187 [NASA ADS] [CrossRef] [Google Scholar]
- Hunt, L. K., Palazzi, E., Michałowski, M. J., et al. 2014, A&A, 565, A112 [NASA ADS] [CrossRef] [EDP Sciences] [Google Scholar]
- Iglesias-Páramo, J., Buat, V., Hernández-Fernández, J., et al. 2007, ApJ, 670, 279 [NASA ADS] [CrossRef] [Google Scholar]
- Izzo, L., Thöne, C. C., Schulze, S., et al. 2017, MNRAS, 472, 4480 [NASA ADS] [CrossRef] [Google Scholar]
- Jakobsson, P., Levan, A., Fynbo, J. P. U., et al. 2006, A&A, 447, 897 [NASA ADS] [CrossRef] [EDP Sciences] [Google Scholar]
- Jakobsson, P., Hjorth, J., Malesani, D., et al. 2012, ApJ, 752, 62 [NASA ADS] [CrossRef] [Google Scholar]
- Jarrett, T. H., Chester, T., Cutri, R., et al. 2000, AJ, 119, 2498 [NASA ADS] [CrossRef] [Google Scholar]
- Jin, Z. P., Li, X., Cano, Z., et al. 2015, ApJ, 811, L22 [NASA ADS] [CrossRef] [Google Scholar]
- Joye, W. A., & Mandel E. 2003, ASP Conf. Ser., 294, 489 [Google Scholar]
- Kathirgamaraju, A., Barniol Duran, R., & Giannios D. 2016, MNRAS, 461, 1568 [NASA ADS] [CrossRef] [Google Scholar]
- Kennicutt, R. C. 1998, ARA&A, 36, 189 [Google Scholar]
- Kennicutt, R. C., Calzetti, D., Aniano, G., et al. 2011, PASP, 123, 1347 [NASA ADS] [CrossRef] [Google Scholar]
- Kim, S., Schulze, S., Resmi, L., et al. 2017, ApJ, 850, L21 [NASA ADS] [CrossRef] [Google Scholar]
- King, A., Olsson, E., & Davies, M. B. 2007, MNRAS, 374, L34 [NASA ADS] [Google Scholar]
- Kohn, S. A., Michałowski, M. J., Bourne, N., et al. 2015, MNRAS, 448, 1494 [NASA ADS] [CrossRef] [Google Scholar]
- Kouveliotou, C., Meegan, C. A., Fishman, G. J., et al. 1993, ApJ, 413, L101 [NASA ADS] [CrossRef] [Google Scholar]
- Krühler, T., Fynbo, J. P. U., Geier, S., et al. 2012a, A&A, 546, A8 [NASA ADS] [CrossRef] [EDP Sciences] [Google Scholar]
- Krühler, T., Malesani, D., Milvang-Jensen, B., et al. 2012b, ApJ, 758, 46 [NASA ADS] [CrossRef] [Google Scholar]
- Kulkarni, S. R., Ofek, E. O., Rau, A., et al. 2007, Nature, 447, 458 [Google Scholar]
- Kulkarni, S. R., Frail, D. A., Wieringa, M. H., et al. 1998, Nature, 395, 663 [NASA ADS] [CrossRef] [Google Scholar]
- Lauberts, A., & Valentijn, E. A. 1989, The Surface Photometry Catalogue of the ESO-Uppsala Galaxies (European Southern Observatory) [Google Scholar]
- Le Floc’h, E., Charmandaris, V., Gordon, K., et al. 2012, ApJ, 746, 7 [NASA ADS] [CrossRef] [Google Scholar]
- Leloudas, G., Gallazzi, A., Sollerman, J., et al. 2011, A&A, 530, A95 [NASA ADS] [CrossRef] [EDP Sciences] [Google Scholar]
- Levan, A., Nugent, P., Fruchter, A., et al. 2005, ApJ, 624, 880 [NASA ADS] [CrossRef] [Google Scholar]
- Levan, A., Hjorth, J., Malesani, D., et al. 2011a, Search for a supernova in a GRB at 55 Mpc, Spitzer Proposal ID 80234 [Google Scholar]
- Levan, A. J., Malesani, D., Hjorth, J., Tanvir, N. R., & Wiersema, K. 2011b, GRB Coordinates Network, 12416 [Google Scholar]
- Levan, A. J., Tanvir, N. R., Cenko, S. B., et al. 2011c, Science, 333, 199 [NASA ADS] [CrossRef] [PubMed] [Google Scholar]
- Levan, A. J., Tanvir, N. R., Wiersema, K., & O’Brien, P. T. 2011d, GRB Coordinates Network, 12414 [Google Scholar]
- Levan, A. J., Tanvir, N. R., Fruchter, A. S., et al. 2014, ApJ, 792, 115 [NASA ADS] [CrossRef] [Google Scholar]
- Levesque, E. M., Kewley, L. J., Graham, J. F., & Fruchter, A. S. 2010, ApJ, 712, L26 [NASA ADS] [CrossRef] [Google Scholar]
- Levesque, E. M., Berger, E., Soderberg, A. M., & Chornock, R. 2011, ApJ, 739, 23 [NASA ADS] [CrossRef] [Google Scholar]
- Li, X., Hu, Y. M., Fan, Y. Z., & Wei, D. M. 2016, ApJ, 827, 75 [NASA ADS] [CrossRef] [Google Scholar]
- LIGO Scientific Collaboration, Virgo Collaboration, GBM F., et al. 2017, ApJ, 848, L12 [Google Scholar]
- Malesani, D., Levan, A. J., Tanvir, N. R., et al. 2011, GRB Coordinates Network, 12418 [Google Scholar]
- Margutti, R., Soderberg, A. M., Wieringa, M. H., et al. 2013, ApJ, 778, 18 [NASA ADS] [CrossRef] [Google Scholar]
- Martin, C., Barlow, T., Barnhart, W., et al. 2003, Proc. SPIE., 4854, 336 [NASA ADS] [CrossRef] [Google Scholar]
- Martin, D. C., Fanson, J., Schiminovich, D., et al. 2005, ApJ, 619, L1 [Google Scholar]
- McBreen, S., Foley, S., Watson, D., et al. 2008, ApJ, 677, L85 [NASA ADS] [CrossRef] [Google Scholar]
- McMullin, J. P., Waters, B., Schiebel, D., Young, W., & Golap, K. 2007, ASP Conf. Ser., 376, 127 [Google Scholar]
- Meixner, M., Panuzzo, P., Roman-Duval, J., et al. 2013, AJ, 146, 62 [NASA ADS] [CrossRef] [Google Scholar]
- Michałowski, M. J. 2015, A&A, 577, A80 [NASA ADS] [CrossRef] [EDP Sciences] [Google Scholar]
- Michałowski, M. J., Hjorth, J., Castro Cerón, J. M., & Watson, D. 2008, ApJ, 672, 817 [NASA ADS] [CrossRef] [Google Scholar]
- Michałowski, M. J., Hjorth, J., Malesani, D., et al. 2009, ApJ, 693, 347 [NASA ADS] [CrossRef] [Google Scholar]
- Michałowski, M. J., Hjorth, J., & Watson, D. 2010a, A&A, 514, A67 [NASA ADS] [CrossRef] [EDP Sciences] [Google Scholar]
- Michałowski, M. J., Watson, D., & Hjorth, J. 2010b, ApJ, 712, 942 [NASA ADS] [CrossRef] [Google Scholar]
- Michałowski, M., Xu, D., Stevens, J., et al. 2011, GRB Coordinates Network, 12422 [Google Scholar]
- Michałowski, M. J., Dunlop, J. S., Cirasuolo, M., et al. 2012a, A&A, 541, A85 [NASA ADS] [CrossRef] [EDP Sciences] [Google Scholar]
- Michałowski, M. J., Kamble, A., Hjorth, J., et al. 2012b, ApJ, 755, 85 [NASA ADS] [CrossRef] [Google Scholar]
- Michałowski, M. J., Hayward, C. C., Dunlop, J. S., et al. 2014a, A&A, 571, A75 [NASA ADS] [CrossRef] [EDP Sciences] [Google Scholar]
- Michałowski, M. J., Hunt, L. K., Palazzi, E., et al. 2014b, A&A, 562, A70 [NASA ADS] [CrossRef] [EDP Sciences] [Google Scholar]
- Michałowski, M. J., Gentile, G., Hjorth, J., et al. 2015, A&A, 582, A78 [NASA ADS] [CrossRef] [EDP Sciences] [Google Scholar]
- Michałowski, M. J., Castro Cerón, J. M., Wardlow, J. L., et al. 2016, A&A, 595, A72 [NASA ADS] [CrossRef] [EDP Sciences] [Google Scholar]
- Michałowski, M. J., Gentile, G., Krühler, T., et al. 2018a, A&A, in press, DOI: 10.1051/0004-6361/201732356 [Google Scholar]
- Michałowski, M. J., Karska, A., Rizzo, J. R., et al. 2018b, A&A, in press, DOI: 10.1051/0004-6361/201833250 [Google Scholar]
- Mioduszewski, A. J., & Kogan, L. 2009, AIPS Memo, 110 [Google Scholar]
- Moshir, M. 1990, in IRAS Faint Source Catalogue, version 2.0 [Google Scholar]
- Motohara, K., Konishi, M., Tanabe, T., et al. 2011, GRB Coordinates Network, 12420 [Google Scholar]
- Murakami, H., Baba, H., Barthel, P., et al. 2007, PASJ, 59, 369 [Google Scholar]
- Nardini, M., Greiner, J., & Kruehler, T. 2011, GRB Coordinates Network, 12417 [Google Scholar]
- Ofek, E. O., Cenko, S. B., Gal-Yam, A., et al. 2007, ApJ, 662, 1129 [NASA ADS] [CrossRef] [Google Scholar]
- Östlin, G., Zackrisson, E., Sollerman, J., Mattila, S., & Hayes, M. 2008, MNRAS, 387, 1227 [NASA ADS] [CrossRef] [Google Scholar]
- Perley, D. A., Levan, A. J., Tanvir, N. R., et al. 2013, ApJ, 778, 128 [NASA ADS] [CrossRef] [Google Scholar]
- Perley, D. A., Perley, R. A., Hjorth, J., et al. 2015, ApJ, 801, 102 [NASA ADS] [CrossRef] [Google Scholar]
- Perley, D. A., Krühler, T., Schulze, S., et al. 2016a, ApJ, 817, 7 [NASA ADS] [CrossRef] [Google Scholar]
- Perley, D. A., Tanvir, N. R., Hjorth, J., et al. 2016b, ApJ, 817, 8 [NASA ADS] [CrossRef] [Google Scholar]
- Perley, D. A., Hjorth, J., Tanvir, N. R., & Perley, R. A. 2017a, MNRAS, 465, 970 [NASA ADS] [CrossRef] [Google Scholar]
- Perley, D. A., Krühler, T., Schady, P., et al. 2017b, MNRAS, 465, L89 [NASA ADS] [CrossRef] [Google Scholar]
- Pihlström, Y. M., Taylor, G. B., Granot, J., & Doeleman, S. 2007, ApJ, 664, 411 [NASA ADS] [CrossRef] [Google Scholar]
- Prandoni, I., Morganti, R., & Mignano, A. 2009, ArXiv e-prints [arXiv:0909.3761] [Google Scholar]
- Prochaska, J. X., Sheffer, Y., Perley, D. A., et al. 2009, ApJ, 691, L27 [NASA ADS] [CrossRef] [Google Scholar]
- Rees, M. J. 1988, Nature, 333, 523 [NASA ADS] [CrossRef] [Google Scholar]
- Retter, A., & Heller, S. 2012, New Astron., 17, 73 [NASA ADS] [CrossRef] [Google Scholar]
- Roming, P. W. A., Kennedy, T. E., Mason, K. O., et al. 2005, Space Sci. Rev., 120, 95 [NASA ADS] [CrossRef] [Google Scholar]
- Rossi, A., Piranomonte, S., Savaglio, S., et al. 2014, A&A, 572, A47 [NASA ADS] [CrossRef] [EDP Sciences] [Google Scholar]
- Salpeter, E. E. 1955, ApJ, 121, 161 [Google Scholar]
- Salvaterra, R., Campana, S., Vergani, S. D., et al. 2012, ApJ, 749, 68 [NASA ADS] [CrossRef] [Google Scholar]
- Sanders, D. B., Mazzarella, J. M., Kim, D. C., Surace, J. A., & Soifer, B. T. 2003, AJ, 126, 1607 [Google Scholar]
- Sault, R. J., & Killeen, N. E. B. 2004, The Miriad User’s Guide (Sydney: Australia Telescope National Facility) (www.atnf.csiro.au/computing/software/miriad/) [Google Scholar]
- Sault, R. J., Teuben, P. J., & Wright, M. C. H. 1995, ASP Conf. Ser., 77, 433 [NASA ADS] [Google Scholar]
- Savaglio, S., Glazebrook, K., & LeBorgne, D. 2009, ApJ, 691, 182 [NASA ADS] [CrossRef] [MathSciNet] [Google Scholar]
- Savaglio, S., Rau, A., Greiner, J., et al. 2012, MNRAS, 420, 627 [NASA ADS] [CrossRef] [Google Scholar]
- Saxton, C. J., Barthelmy, S. D., D’Elia, V., et al. 2011, GRB Coordinates Network, 12413 [Google Scholar]
- Schady, P., Savaglio, S., Müller, T., et al. 2014, A&A, 570, A52 [NASA ADS] [CrossRef] [EDP Sciences] [Google Scholar]
- Schady, P., Krühler, T., Greiner, J., et al. 2015, A&A, 579, A126 [NASA ADS] [CrossRef] [EDP Sciences] [Google Scholar]
- Schulze, S., Malesani, D., Cucchiara, A., et al. 2014, A&A, 566, A102 [NASA ADS] [CrossRef] [EDP Sciences] [Google Scholar]
- Schulze, S., Chapman, R., Hjorth, J., et al. 2015, ApJ, 808, 73 [NASA ADS] [CrossRef] [Google Scholar]
- Shepherd, M. C., Pearson, T. J., & Taylor, G. B. 1994, BAAS, 26, 987 [NASA ADS] [Google Scholar]
- Silva, L., Granato, G. L., Bressan, A., & Danese, L. 1998, ApJ, 509, 103 [NASA ADS] [CrossRef] [Google Scholar]
- Siringo, G., Kreysa, E., Kovács, A., et al. 2009, A&A, 497, 945 [NASA ADS] [CrossRef] [EDP Sciences] [Google Scholar]
- Skibba, R. A., Engelbracht, C. W., Aniano, G., et al. 2012, ApJ, 761, 42 [NASA ADS] [CrossRef] [Google Scholar]
- Skrutskie, M. F., Cutri, R. M., Stiening, R., et al. 2006, AJ, 131, 1163 [NASA ADS] [CrossRef] [Google Scholar]
- Smith, I. A., Tilanus, R. P. J., Tanvir, N., et al. 2005a, A&A, 439, 987 [NASA ADS] [CrossRef] [EDP Sciences] [Google Scholar]
- Smith, I. A., Tilanus, R. P. J., Tanvir, N., et al. 2005b, A&A, 439, 981 [NASA ADS] [CrossRef] [EDP Sciences] [Google Scholar]
- Soderberg, A. M., Kulkarni, S. R., Berger, E., et al. 2004, Nature, 430, 648 [NASA ADS] [CrossRef] [Google Scholar]
- Soderberg, A. M., Kulkarni, S. R., Nakar, E., et al. 2006, Nature, 442, 1014 [CrossRef] [Google Scholar]
- Springob, C. M., Masters, K. L., Haynes, M. P., Giovanelli, R., & Marinoni, C. 2007, ApJS, 172, 599 [NASA ADS] [CrossRef] [Google Scholar]
- Stanek, K. Z., Matheson, T., Garnavich, P. M., et al. 2003, ApJ, 591, L17 [NASA ADS] [CrossRef] [Google Scholar]
- Stanway, E. R., Levan, A. J., Tanvir, N., et al. 2015a, MNRAS, 446, 3911 [NASA ADS] [CrossRef] [Google Scholar]
- Stanway, E. R., Levan, A. J., Tanvir, N. R., Wiersema, K., & van der Laan, T. P. R. 2015b, ApJ, 798, L7 [NASA ADS] [CrossRef] [Google Scholar]
- Symeonidis, M., Oates, S. R., de Pasquale, M., et al. 2014, MNRAS, 443, L124 [NASA ADS] [CrossRef] [Google Scholar]
- Tanga, M., Krühler, T., Schady, P., et al. 2018, A&A, 615, A136 [NASA ADS] [CrossRef] [EDP Sciences] [Google Scholar]
- Tanvir, N. R., Barnard, V. E., Blain, A. W., et al. 2004, MNRAS, 352, 1073 [NASA ADS] [CrossRef] [Google Scholar]
- Taylor, G. B., Frail, D. A., Berger, E., & Kulkarni, S. R. 2004, ApJ, 609, L1 [NASA ADS] [CrossRef] [Google Scholar]
- Taylor, G. B., Momjian, E., Pihlström, Y., Ghosh, T., & Salter, C. 2005, ApJ, 622, 986 [NASA ADS] [CrossRef] [Google Scholar]
- Tetarenko, A. J., Sivakoff, G. R., Miller-Jones, J. C. A., et al. 2015, ApJ, 805, 30 [Google Scholar]
- Thöne, C. C., Fynbo, J. P. U., Östlin, G., et al. 2008, ApJ, 676, 1151 [NASA ADS] [CrossRef] [Google Scholar]
- Thöne, C. C., Christensen, L., Prochaska, J. X., et al. 2014, MNRAS, 441, 2034 [NASA ADS] [CrossRef] [Google Scholar]
- Tinney, C., Stathakis, R., Cannon, R., et al. 1998, IAU Circ., 6896 [Google Scholar]
- Trenti, M., Perna, R., & Jimenez, R. 2015, ApJ, 802, 103 [NASA ADS] [CrossRef] [Google Scholar]
- van der Horst, A. J., Rol, E., Wijers, R. A. M. J., et al. 2005, ApJ, 634, 1166 [NASA ADS] [CrossRef] [Google Scholar]
- van der Horst, A. J., Kamble, A., Resmi, L., et al. 2008, A&A, 480, 35 [NASA ADS] [CrossRef] [EDP Sciences] [Google Scholar]
- van der Horst, A. J., Paragi, Z., de Bruyn, A. G., et al. 2014, MNRAS, 444, 3151 [NASA ADS] [CrossRef] [Google Scholar]
- van Eerten, H., Zhang, W., & MacFadyen, A. 2010, ApJ, 722, 235 [NASA ADS] [CrossRef] [Google Scholar]
- van Eerten, H. J., & MacFadyen, A. I. 2011, ApJ, 733, L37 [NASA ADS] [CrossRef] [Google Scholar]
- van Moorsel, G., Kemball, A., & Greisen, E. 1996, ASP Conf. Ser., 101, 37 [NASA ADS] [Google Scholar]
- Vergani, S. D., Salvaterra, R., Japelj, J., et al. 2015, A&A, 581, A102 [NASA ADS] [CrossRef] [EDP Sciences] [Google Scholar]
- Wang, W. H., Chen, H. W., & Huang, K. Y. 2012, ApJ, 761, L32 [NASA ADS] [CrossRef] [Google Scholar]
- Wang, Y. Z., Huang, Y. J., Liang, Y. F., et al. 2017, ApJ, 851, L20 [NASA ADS] [CrossRef] [Google Scholar]
- Watson, D., French, J., Christensen, L., et al. 2011, ApJ, 741, 58 [NASA ADS] [CrossRef] [Google Scholar]
- Weiler, K. W., Panagia, N., Montes, M. J., & Sramek, R. A. 2002, ARA&A, 40, 387 [NASA ADS] [CrossRef] [Google Scholar]
- Wilson, W. E., Ferris, R. H., Axtens, P., et al. 2011, MNRAS, 416, 832 [NASA ADS] [CrossRef] [Google Scholar]
- Wright, E. L. 2006, PASP, 118, 1711 [NASA ADS] [CrossRef] [Google Scholar]
- Xie, C., Fang, T., Wang, J., Liu, T., & Jiang, X. 2016, ApJ, 824, L17 [NASA ADS] [CrossRef] [Google Scholar]
- Xu, D., Michałowski, M., Stevens, J., & Edwards, P. 2011a, GRB Coordinates Network, 12435 [Google Scholar]
- Xu, D., Michałowski, M., Stevens, J., et al. 2011b, GRB Coordinates Network, 12421 [Google Scholar]
- Yang, B., Jin, Z. P., Li, X., et al. 2015, Nat. Commun., 6, 7323 [NASA ADS] [CrossRef] [PubMed] [Google Scholar]
- Yasuda, N., Fukugita, M., Narayanan, V. K., et al. 2001, AJ, 122, 1104 [NASA ADS] [CrossRef] [Google Scholar]
- Yue, C., Hu, Q., Zhang, F. W., et al. 2018, ApJ, 853, L10 [NASA ADS] [CrossRef] [Google Scholar]
- Zacharias, N., Finch, C., Girard, T., et al. 2010, AJ, 139, 2184 [NASA ADS] [CrossRef] [Google Scholar]
- Zauderer, A., Berger, E., Soderberg, A. M., & A. F.D. 2011, GRB Coordinates Network, 12419 [Google Scholar]
- Zauderer, B. A., Berger, E., Soderberg, A. M., et al. 2011, Nature, 476, 425 [NASA ADS] [CrossRef] [PubMed] [Google Scholar]
- Zauderer, B. A., Berger, E., Margutti, R., et al. 2013, ApJ, 767, 152 [Google Scholar]
All Tables
All Figures
|
Fig. 1. Mosaic of the images of the GRB 111005A host. The images are from GALEX (FUV and NUV), Swift/UVOT (u-band) and Spitzer (Levan et al. 2011a). North is up and east is to the left. Each panel is 90″ × 90″ (24 kpc × 24 kpc). The red circle shows the VLBA position. |
| In the text | |
|
Fig. 2. Position of the WHT slit with regions marked by their distance from its beginning. The BPT diagnostic and metallicities of these regions are shown in Figs. 11 and 12, respectively. The circle denotes the afterglow VLBA position. |
| In the text | |
|
Fig. 3. Left panel: orientation of the VLT/X-shooter slit. The white cross marks our VLBA position of GRB 111005A. Right panel: 2D spectra. The horizontal axis corresponds to the wavelengths and the vertical axis to the position along the slit. The rotation curve is clearly visible with each line. The emission to the left panel corresponds to the galaxy centre, whereas the one to the right panel is offset ∼4.5″ to the northwest and has a much harder ionising flux as it exhibits much higher [O III]/[O II] ratio. |
| In the text | |
|
Fig. 4. Swift/UVOT u-band images of the GRB 111005A host taken at two epochs and the result of the subtraction showing no variable source. North is up and east is to the left. Each panel is 90″ × 90″ (24 kpc × 24 kpc). The red circle shows the VLBA position. |
| In the text | |
|
Fig. 5. VLBA image of the GRB 111005A afterglow on 2011 Oct 21 (16.5 days after the burst). North is up and east is to the left. The panel is 0.01″ × 0.01″ (2.7 pc 2.7 pc). The positive and negative contours are shown as solid and dashed lines, respectively at 2, 1, 2, 3, 4σ with the rms of 0.15 mJy beam−1. The beam (1.31 0.491 mas FWHM) is shown as a blue ellipse in the bottom-right corner. |
| In the text | |
|
Fig. 6. Radio light curve of the afterglow of GRB 111005A. Data points are colour-coded by frequency. Dotted lines show the time intervals at which the SEDs are shown in Fig. 7. The fluxes at ∼650 days are host detections (see Table 1). |
| In the text | |
|
Fig. 7. SEDs of the afterglow of GRB 111005A. Data points are colour-coded by the time at which they were obtained. The lines corresponds to a power-law fits (consistent with each other within errors) described in Eqs. (1) and (2). |
| In the text | |
|
Fig. 8. Radio luminosity of the afterglow of GRB 111005A (circles), compared with cosmological GRBs (region marked by black lines; Chandra & Frail 2012), GRB 980425 (small stars; Kulkarni et al. 1998), GRB 031203 (small squares; Soderberg et al. 2004), GRB 060218 (small triangles; Soderberg et al. 2006), and GRB 100316D (small diamonds; Margutti et al. 2013). Datapoints are colour-coded by frequency. |
| In the text | |
|
Fig. 9. SED of ESO 580-49, the host galaxy of GRB 111005A. Datapoints are shown as red squares and arrows, whereas GRASIL and MAGPHYS models are shown as a blue and black lines, respectively. The data at 100, 140 μm and in the radio were not used in the modelling due to either too poor spatial resolution, or resolving out the extended emission (see Sect. 3). The SED of the GRB 980425 host (Michałowski et al. 2014b) scaled up by a factor of four is shown for comparison (green line). |
| In the text | |
|
Fig. 10. Top panel: spectrum of the GRB 111005A host added over the entire extend of the slit (Fig. 2). Some emission lines are marked, and the bottom panels show their 2D spectra. The horizontal axis corresponds to the wavelengths and the vertical axis to the position along the slit (400 pixels, i.e. 8011). The rotation curve is clearly visible with each line. The drop at ∼5300 Å is due to the dichroic gap between the blue and red arms of the ISIS. |
| In the text | |
|
Fig. 11. BPT diagnostic (Baldwin et al. 1981) along the slit of the host of GRB 111005A. Most of the regions are consistent with star forming activity. The nucleus lies at approximately 115″. The regions along the slit are defined in Fig. 2. |
| In the text | |
|
Fig. 12. The R23 metallicity diagnostic along the host of GRB 111005A. The nucleus lies at approximately 115″. The regions along the slit are defined in Fig. 2. |
| In the text | |
|
Fig. 13. Limits on supernova-like emission from GRB111005A (arrows). The lines show the models from Levan et al. (2005), scaled to a distance of 55 Mpc. In the case of the nine-day epoch we have used a model from seven days, and extended the template from 2.2 to 4.8 μm based on a purely thermal extrapolation. We also show the observations of the type IIb SN 2011dh in M51 (Helou et al. 2013), as it would appear at 55 Mpc. |
| In the text | |
|
Fig. 14. Prompt emission light curve of GRB 111005A. The first four panels show four Swift/BAT energy bands, whereas the last one shows the combined emission. |
| In the text | |
|
Fig. 15. HST image of the GRB 111005A host showing the entire galaxy (left panel) and the central region (right panel). The green circle shows the GRB 111005A afterglow VLBA position. It is located behind a dust lane (with suppressed optical emission). |
| In the text | |
|
Fig. 16. Dust-to-stellar mass ratio as a function of UV-to-optical colour of the GRB 111005A (black square), GRB 980425 host (red square; Michałowski et al. 2014b), LMC (open red square; M∗ from Skibba et al. 2012 and Md derived applying the method of Bianchi 2013 to the data from Meixner et al. 2013), KINGFISH galaxies (blue plusses; Kennicutt et al. 2011), and the averages of other local galaxies in eight colour bins (Table 1 and Fig. 4 of Cortese et al. 2012). The solid line represents a linear fit to the data. Both GRBs 111005A and 980425 are a factor of ∼2 below the trend. This figure is reproduced from Michałowski et al. (2014b). |
| In the text | |
Current usage metrics show cumulative count of Article Views (full-text article views including HTML views, PDF and ePub downloads, according to the available data) and Abstracts Views on Vision4Press platform.
Data correspond to usage on the plateform after 2015. The current usage metrics is available 48-96 hours after online publication and is updated daily on week days.
Initial download of the metrics may take a while.