Fig. 5.
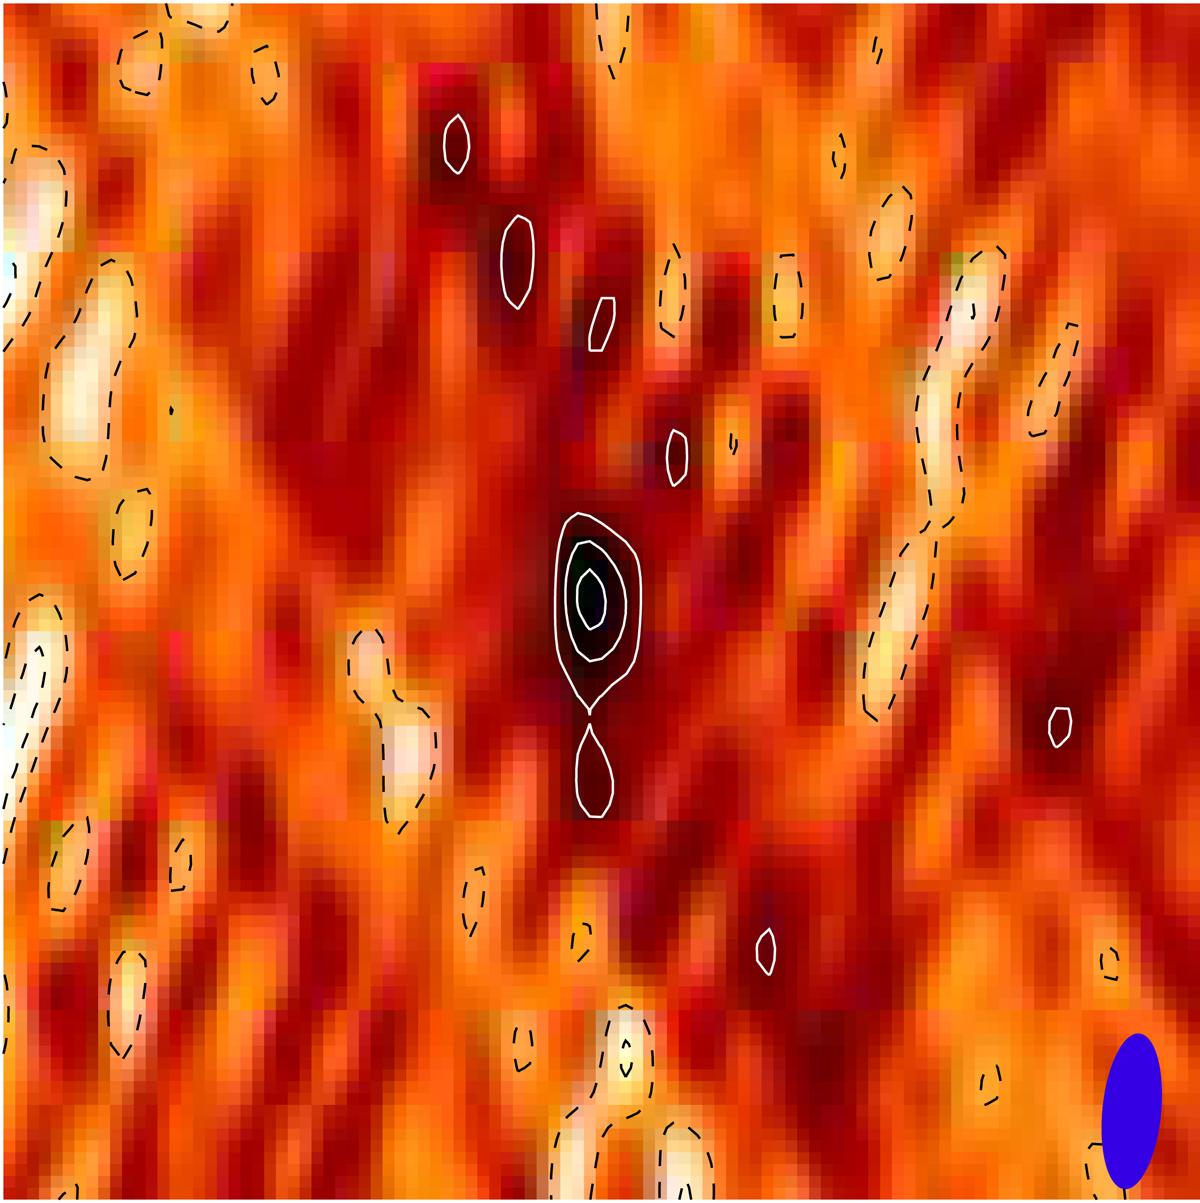
VLBA image of the GRB 111005A afterglow on 2011 Oct 21 (16.5 days after the burst). North is up and east is to the left. The panel is 0.01″ × 0.01″ (2.7 pc 2.7 pc). The positive and negative contours are shown as solid and dashed lines, respectively at 2, 1, 2, 3, 4σ with the rms of 0.15 mJy beam−1. The beam (1.31 0.491 mas FWHM) is shown as a blue ellipse in the bottom-right corner.
Current usage metrics show cumulative count of Article Views (full-text article views including HTML views, PDF and ePub downloads, according to the available data) and Abstracts Views on Vision4Press platform.
Data correspond to usage on the plateform after 2015. The current usage metrics is available 48-96 hours after online publication and is updated daily on week days.
Initial download of the metrics may take a while.