Fig. 3.
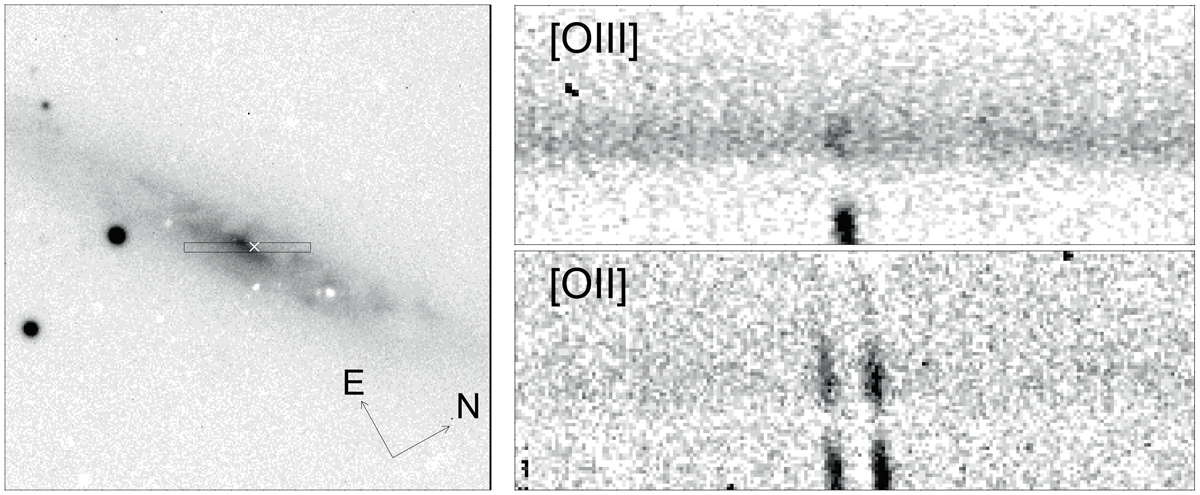
Left panel: orientation of the VLT/X-shooter slit. The white cross marks our VLBA position of GRB 111005A. Right panel: 2D spectra. The horizontal axis corresponds to the wavelengths and the vertical axis to the position along the slit. The rotation curve is clearly visible with each line. The emission to the left panel corresponds to the galaxy centre, whereas the one to the right panel is offset ∼4.5″ to the northwest and has a much harder ionising flux as it exhibits much higher [O III]/[O II] ratio.
Current usage metrics show cumulative count of Article Views (full-text article views including HTML views, PDF and ePub downloads, according to the available data) and Abstracts Views on Vision4Press platform.
Data correspond to usage on the plateform after 2015. The current usage metrics is available 48-96 hours after online publication and is updated daily on week days.
Initial download of the metrics may take a while.