Fig. 10.
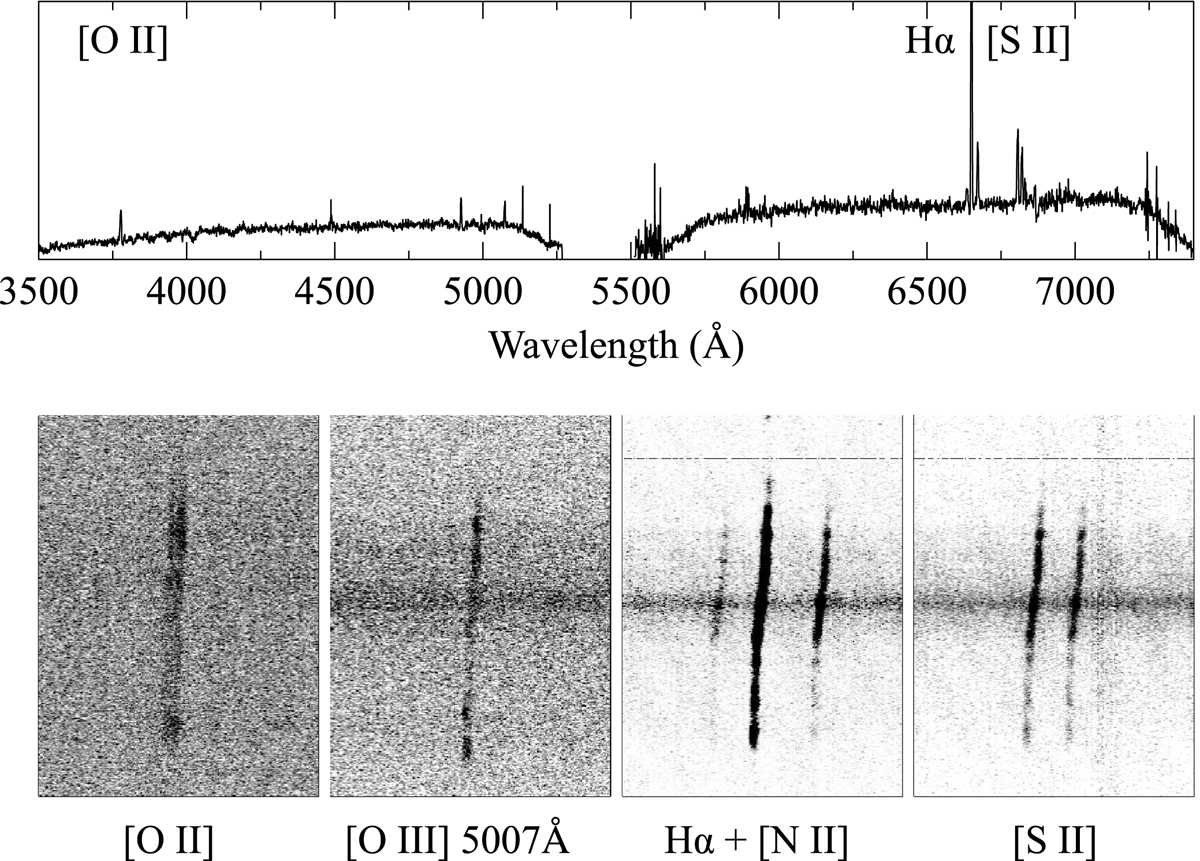
Top panel: spectrum of the GRB 111005A host added over the entire extend of the slit (Fig. 2). Some emission lines are marked, and the bottom panels show their 2D spectra. The horizontal axis corresponds to the wavelengths and the vertical axis to the position along the slit (400 pixels, i.e. 8011). The rotation curve is clearly visible with each line. The drop at ∼5300 Å is due to the dichroic gap between the blue and red arms of the ISIS.
Current usage metrics show cumulative count of Article Views (full-text article views including HTML views, PDF and ePub downloads, according to the available data) and Abstracts Views on Vision4Press platform.
Data correspond to usage on the plateform after 2015. The current usage metrics is available 48-96 hours after online publication and is updated daily on week days.
Initial download of the metrics may take a while.